≡ Menu

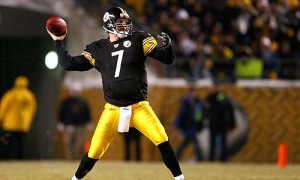
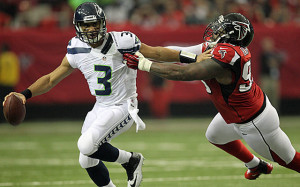
Wilson does his best Roethlisberger.

Wilson does his best Roethlisberger.

On the surface, Russell Wilson and Ben Roethlisberger have almost nothing in common. Wilson was an undersized, overlooked, third-round pick, while Roethlisberger was a first round pick who is one of the most physically imposing quarterbacks in NFL history. But both players had pretty similar rookie years in a couple of respects.

In 2004, Roethlisbeger went 14-0 as the Steelers quarterback. Pittsburgh finished last in pass attempts that season, but Roethlisberger ranked 7th among quarterbacks with a 6.9 Adjusted Net Yards per Attempt average. In 2012, Wilson went 11-5 as starter, the Seahawks ranked 32nd in pass attempts, and Wilson averaged 7.0 ANY/A, the 8th-highest mark in the league. Both teams were powered by great defenses and running games, and for a long time, Roethlisberger carried the label of game manager. He also appeared in three Super Bowls, winning two of them.

Wilson threw 393 passes last season, an average of 24.6 per game. The NFL average was 34.7 pass attempts per game, which means Wilson averaged 10.1 fewer attempts per game than average. I looked at 146 different quarterbacks with at least 50 starts since 1960 and noted how many passes they attempted in their first 16 starts. As it turns out, only four of them — Tom Flores, Chris Chandler, Joe Ferguson, and Roethlisberger — were farther from league average (on the minus side) than Wilson.

In Flores’ case, he was the starter for the Raiders in 1960 but he split time with Babe Parilli: they were essentially running a quarterback-by-committee in Oakland, so that explains why Flores didn’t throw many passes.

Twenty-eight years later, a similar situation unfolded in Indianapolis. Gary Hogeboom started the season, but was quickly benched for Jack Trudeau. Once Trudeau suffered a season-ending knee injury, Chandler took over, but Hogeboom still had 13 or more pass attempts in five of Chandler’s starts.
[continue reading…]

{ 2 comments }

No, Peyton, you are #1

No, Peyton, you are #1.

Back in March, Chase wrote a post investigating how quarterbacks age, finding that they peak at age 29 (with a generalized peak from 26-30) in terms of value over average. Today, I thought I’d quickly look at how quarterbacks age in terms of their performance rate — specifically, their Adjusted Net Yards per Attempt (ANY/A). For newer readers, ANY/A is based on the following formula: (Passing Yards + 20 * Passing TDs – 45 * INTs – Sack Yards Lost) / (Pass Attempts + Sacks).

First, I need to introduce a way of adjusting ANY/A for era: Relative ANY/A. Relative ANY/A is simply equal to:

QB_ANY/A – LgAvg_ANY/A

The table below lists the 30 single-season leaders in Relative ANY/A since the merger. You won’t be too surprised to see the 2004 version of Peyton Manning at the top. That year, Manning averaged 9.8 ANY/A, while the league average was just 5.6 ANY/A. That means Manning gets a Relative ANY/A grade of +4.1 (with the difference due to rounding).
[continue reading…]

{ 17 comments }

Ranking the backup quarterbacks in NFL

Which teams have the best and worst backup quarterbacks? That’s a tricky question, as teams treat the backup quarterback position differently.  For the Eagles, Bills, Jaguars, and Jets, the backup quarterback will be the loser in the training camp battle for the starting job.  In Dallas, Detroit, and Indianapolis, the backup is a savvy veteran who can cover for the star quarterback in a pinch.  Some teams have young quarterback-of-the-future types, the Patriots have a backup who doubles as trade bait (and a third-stringer who doubles as a tight end), and the Steelers are experimenting with a backup who doesn’t have an AARP card.  There are also a number of teams hopelessly lost at the position, perhaps best described as “We learned nothing from watching the 2011 Colts.”

I’ve decided to group the 32 backup quarterbacks, the four eventual winners of the training camp battles, and four other notable backups into four separate categories: The Veterans (30+ years of age), The Quarterbacks of the Future, The Retreads (at least 25 but under 30), and What are they thinking?  Within each category, I’ve listed the quarterbacks from best to worst. For each player, I’ve listed his age as of the opening day of the 2013 season, his draft status, and his number of career passes. The rankings are based on my subjective thoughts.

The Veterans (30+ years of age)

The top of this list consists of starting-caliber quarterbacks, assuming you define “starting-caliber” as a top-twenty quarterback on a good day.  A team could survive starting them for four games and expect to go 2-2. Towards the bottom, you have players who could come off the bench and hold a second-half lead, but don’t expect them to start for more than a week.

1) Michael Vick, Philadelphia Eagles Age: 33.2. Draft: Rd: 1, Pick 1 (2001). Career Passes: 2889
[continue reading…]

{ 20 comments }

Most of you know that counting stats mean little for quarerbacks, but most of you also know that nothing beats meaningless trivia. Last July, I wondered who would lead the NFL in rushing yards from 2012 to 2021? It took a year, but now the natural follow-up question: Who will lead the NFL in passing yards over the next ten seasons?

Did you know that Joe Montana passed for the most yards in the ’80s? Or that Y.A. Tittle passed for the most yards from ’48 to ’57 (AAFC included) and then ’53 to ’62? The table below shows each leader in passing yards for every ten-year period, along with their age and NFL experience during their first season of that decade.
[continue reading…]

{ 19 comments }

The Best Passing Games of 2012 (NFL)

Even Watt couldn't slow down Rodgers and... Henne.

Even Watt couldn't slow down Rodgers and... Henne.

Yesterday, I presented my Rearview ANY/A ratings for quarterbacks and defenses in 2012. Strength of schedule adjustments are important — without it, Peyton Manning‘s numbers were tops in the league, but after the adjustments, Tom Brady moved into the number one slot. To create the season rankings, I had to come up with rankings for each quarterback and each defense in every game last season, so I figured I should present those results as well.

Using the same principles from yesterday’s post, the table below shows all games where a quarterback produced over 100 Adjusted Net Yards above average. You’re probably surprised to see that Chad Henne’s performance in Houston ranks as the single best passing game of 2012. There were only 64 pass plays of 60+ yards last season, but three of them came by Henne against the Texans. That game narrowly edged out Brady’s Thanksgiving Night performance against the Jets (overshadowed by Le Buttfumble), and a separate shredding of the Texans secondary, this time courtesy of Aaron Rodgers. You can click on the boxscore below to see the full PFR boxscore of each game. As always, the table is fully searchable and sortable, and you can click the arrows at the bottom to see more rows.
[continue reading…]

{ 6 comments }

Every year at Footballguys.com, I publish an article called Rearview QB, which adjusts quarterback (and defense) fantasy numbers for strength of schedule. I’ve also done the same thing using ANY/A instead of fantasy points, and today I revive that concept for the 2012 season.

Let’s start with the basics. Adjusted Net Yards per Attempt is defined as (Passing Yards + 20 * Passing Touchdowns – 45 * Interceptions – Sack Yards Lost) divided by (Pass Attempts plus Sacks). ANY/A is my favorite explanatory passing statistic — it is very good at telling you the amount of value provided (or not provided) by a passer in a given game, season, or career.

Let’s start with some basic information. The league average ANY/A in 2012 was 5.93. Peyton Manning averaged 7.89 ANY/A last year, the highest rate in the league among the 39 passers with at least 75 attempts. Since the Broncos star had 583 pass attempts and 21 sacks in 2012, that means he was producing 1.96 ANY/A over league average on 604 dropbacks. That means Manning is credited with 1,185 Adjusted Net Yards above average, a metric I simply call “VALUE” in the table below. Manning led the league in that category, with Tom Brady, Drew Brees, Aaron Rodgers, and Matt Ryan rounding out the top five. Remember, the ANY/A and VALUE results aren’t supposed to surprise you, so it makes sense that the best quarterbacks finish near the top in this category every year.
[continue reading…]

{ 21 comments }

An interesting tweet from Adam Schefter today: Matt Ryan has 56 regular season wins in his first five seasons, the most in NFL history. Ryan has started 78 games, one of only three quarterbacks (Peyton Manning, Joe Flacco) to start at least 75 games in their first five seasons.

I thought it would be interesting to take a look at not just quarterback wins, but quarterback winning percentage (minimum: 15 wins) and wins minus losses (as a compromise between winning percentage and wins). As it turns out, Ryan ranks 1st in wins, 7th in winning percentage, and 1st in wins over losses (or wins over .500) among all quarterbacks to enter the league since 1960.

Quarterback1st YrWinLossTieStartsWin %W-LWin RkWin % RkW-L Rk
Daryle Lamonica19631710180.94416119116
Roger Staubach19692350280.8211871211
Ken Stabler19712051260.7881595319
Tom Brady200148140620.77434441
Jim McMahon198234120460.739222457
Ben Roethlisberger200451200710.71831363
Matt Ryan200856220780.71834171
Kurt Warner199935140490.7142120810
Dan Marino198348210690.69627495
Pat Haden197630131440.69317421013
Tony Romo200627120390.69215561119
Mike Tomczak19862090290.6911951232
Stan Humphries199031140450.68917351313
Philip Rivers200633150480.68818281411
Jay Fiedler199922100320.68812821429
Jack Kemp196029131430.68616481616
John Elway198346211680.684256176
Mark Rypien198842200620.677228187
Joe Flacco200854260800.675282194
Donovan McNabb199943210640.672227207
Doug Flutie19861680240.66781262143
Dave Krieg198119100290.65591032235
Brad Johnson19961580230.65271312350
David Woodley198030161470.64914422422
Jay Schroeder198531170480.64614352522
Elvis Grbac19951690250.6471262650
Vince Ferragamo19791690250.6471262650
Neil O'Donnell199139220610.63917142813
Vince Young200630170470.63813422925
Rex Grossman200319110300.63381033043
Terry Bradshaw197032190510.62713323125
Bernie Kosar198539231630.62716143216
Jim Harbaugh198823140370.6229713335
Michael Vick200131191510.61812353429
Steve Grogan197541260670.61215123519
Joe Namath196537234640.60914173622
Brett Favre199237240610.60713173725
Greg Landry196825162430.6059633835
Marc Bulger200236240600.612193929
Bert Jones197333220550.611283932
Ken Anderson197134230570.59611244132
Jake Delhomme199929200490.5929484235
Steve McNair199529200490.5929484235
Eli Manning200442290710.5921384425
Tony Eason198326180440.5918594543
Chad Pennington200220140340.5886954654
Mark Brunell199531220530.5859354735
Andy Dalton201118130310.58151134857
Eric Hipple198118130310.58151134857
Bobby Hebert198529210500.588485043
Randall Cunningham198530221530.5758425143
Joe Montana197928210490.5717535250
Jim Hart196724183450.5676665354
Boomer Esiason198435270620.5658205443
Jim Kelly198640310710.5639135535
Charley Johnson196226203490.5616595654
Drew Bledsoe199342330750.56985735
Troy Aikman198938300680.5598165843
John Hadl196223184450.5565715957
Virgil Carter196816130290.55231266064
Steve Beuerlein198818150330.54531136164
Gary Danielson197718150330.54531136164
Steve Walsh198919160350.54331036364
Kordell Stewart199723200430.5353716464
Ken O'Brien198431271590.5344356560
Mark Sanchez200933290620.5324286660
Jim Everett198634300640.5314246760
Joe Kapp196724213480.5313666764
Aaron Rodgers200817150320.53121196772
Scott Mitchell199317150320.53121196772
Brian Griese199927240510.5293567164
Quincy Carter200118160340.52921137172
Scott Hunter197117153350.52921197372
Roman Gabriel196219171370.52721037472
Matt Hasselbeck200120180380.5262957572
Mike Phipps197019172380.52621037572
Peyton Manning199842380800.525487760
Kyle Orton200532290610.5253327864
Byron Leftwich200324220460.5222667972
Drew Brees200230280580.5172428072
Bob Griese196729273590.5172488172
Ron Jaworski197517160330.51511198282
Aaron Brooks200035340690.5071208382
Jay Cutler200634340680.50248484
Doug Williams197833331670.50288484
Neil Lomax198130301610.50428484
Jon Kitna199724240480.50668484
Bill Kenney198023230460.50718484
Brian Sipe197422220440.50828484
Jeff Garcia199935360710.493-1209090
Carson Palmer200432330650.492-1329190
Joe Ferguson197331320630.492-1359290
Daunte Culpepper200028290570.491-1539390
Bob Avellini197523240470.489-1719490
Tommy Kramer197722240460.478-2829595
Kyle Boller200320220420.476-2959695
Trent Dilfer199431350660.47-4359799
Don Majkowski198721241460.467-3899897
Bubby Brister198621240450.467-3899997
Kerry Collins199526300560.464-45910099
Phil Simms197923270500.46-47110199
Tom Flores196023282530.453-571102103
Rodney Peete198921260470.447-589103103
David Whitehurst197716201370.446-412610499
Steve Bartkowski197522280500.44-682105106
Trent Green199822290510.431-782106107
Josh Freeman200924320560.429-866107111
Steve Fuller197915200350.429-5131107103
Dave M. Brown199420270470.426-795109107
Gus Frerotte199419261460.424-7103110107
Jason Campbell200627370640.422-1056111113
Derek Anderson200618250430.419-7113112107
Charlie Batch199819270460.413-8103113111
Tony Banks199625360610.41-1163114115
Jeff Blake199421310520.404-1089115113
Jim Zorn197628440720.389-1653116124
Dan Pastorini197121330540.389-1289116118
Warren Moon198426420680.382-1659118124
Alex Smith200519310500.38-12103119118
Jake Plummer199725410660.379-1663120124
Matthew Stafford200917280450.378-11119121115
Jim Plunkett197123380610.377-1571122121
Fran Tarkenton196123393650.377-1671123124
Tim Couch199922370590.373-1582124121
Rick Mirer199320340540.37-1495125120
Sam Bradford201015261420.369-11131126115
Richard Todd197619340530.358-15103127121
Chris Miller198720360560.357-1695128124
Joey Harrington200223430660.348-2071129130
Mike Pagel198215311470.33-16131130124
Vinny Testaverde198719390580.328-20103131130
Jeff George199021440650.323-2389132132
Norm Snead196117413610.303-24119133133
David Carr200222530750.293-3182134135
Archie Manning197115433610.27-28131135134

Of course, having a good (or bad) winning percentage early in a quarterback’s career doesn’t tell us how much of a “winner” that quarterback will be in the future.

{ 1 comment }

The one constant in the Cardinals passing game

The one constant in the Cardinals passing game.

When Tom Brady takes the field as the Patriots starting quarterback in week 1, it will be his 12th consecutive appearance as New England’s opening-week starter. That’s the longest streak in the league, with Eli Manning (9 in 2013), Drew Brees (8), Philip Rivers (8), Tony Romo (7), and Matt Schaub (7) being the only other quarterbacks to start for the same team in each week one since 2007.

On the other hand, the Cardinals will be trotting out their fifth different week 1 starter in as many seasons. Arizona fans hope Carson Palmer will be the right man to finally replace Kurt Warner, after Derek Anderson (2010), Kevin Kolb (2011), and John Skelton (2012) failed. If Chad Henne starts the opener for Jacksonville, that will make it four different quarterbacks in four straight years for the Jaguars (following Blaine Gabbert, Luke McCown, and David Garrard). Palmer’s old team, the Raiders, is the only other team with three different starters the last three years (Matt Flynn, Palmer, and Jason Campbell).

The longest streak of consecutive week one starters is a tie between a pair of Class of ’83 teammates. John Elway started in week 1 every season of his sixteen year career, while Dan Marino started every week 1 from 1984 until 1999. Our games started data only goes back to 1960, but I doubt we would find a sorrier pre-1960 streak than the Chicago Bears from 1998 to 2006. Over a nine-year period, Chicago never had the same quarterback start in week 1 in consecutive years. The full list, beginning in ’98: Erik Kramer, Shane Matthews, Cade McNown, Matthews again, Jim Miller, Kordell Stewart, Rex Grossman, Kyle Orton, and Grossman again. The Ravens, from ’97 to ’03, had seven different week-one starters: Vinny Testaverde, Jim Harbaugh, Scott Mitchell, Tony Banks, Elvis Grbac, Chris Redman, and Kyle Boller, and that doesn’t include Trent Dilfer.

Brandon Weeden is bringing some stability to the Browns quarterback position: if by some chance Jason Campbell steals the job in preseason, he would be Cleveland’s seventh week one starting quarterback in seven years (Charlie Frye in 2007, Derek Anderson, Brady Quinn, Jake Delhomme, Colt McCoy, Weeden, and Campbell). The table below shows each team’s week 1 starters in each of the last ten seasons, along with the projected starter in 2013 according to Footballguys.com (with EJ Manuel (Buffalo), Chad Henne (Jacksonville), Nick Foles (Philadelphia) and Mark Sanchez (New York, for the fifth straight year) projected to win the four open camp jobs.)
[continue reading…]

{ 5 comments }

Manning's worst statistical performance.

Manning's worst statistical performance.

Scott Kacsmar recently wrote about how Daunte Culpepper had the worst performance of his career in his biggest game. In his only NFC Championship Game appearance, Culpepper went 13-of-28 for 78 yards with three interceptions and four sacks. Which made me wonder: how many other great quarterbacks have had their worst game in the playoffs?

I’ll define worst game using the methodology from my Greatest QB of All-Time series [1]For pre-2008, I will be using estimated sack data based on the following formula: Team Sacks allowed X (QB pass attempts / team pass attempts). This means I will calculate each quarterback’s ANY/A [2]I will also include rushing touchdowns and count them the same as passing touchdowns, but will not include any other rushing data. and compare it to league average for that season.

For example, Peyton Manning‘s worst game came in November 2007 against the Chargers. He threw for 328 yards and 2 touchdowns, but that came on 58 dropbacks and with six interceptions. He averaged 1.44 ANY/A that game, in a season where the league average was 5.52 ANY/A. That means Manning was 4.08 ANY/A below average on 58 pass plays, which gave him 239 Adjusted Net Yards below average. The table below shows some of the top quarterbacks in NFL history and which games were their worst. For quarterbacks like Johnny Unitas and Bart Starr, the records are incomplete, as our individual games database only goes back to 1960. The “VALUE” column shows how many Adjusted Net Yards each quarterback was below average.
[continue reading…]

References

References
1 For pre-2008, I will be using estimated sack data based on the following formula: Team Sacks allowed X (QB pass attempts / team pass attempts).
2 I will also include rushing touchdowns and count them the same as passing touchdowns, but will not include any other rushing data.
{ 1 comment }

Scott Kacsmar recently wrote about Robert Griffin III’s struggles on third downs last season. Despite Griffin’s otherworldly rate stats, that was one area where he really struggled in 2012. I thought it would be interesting to take a look at how all quarterbacks fared on “third downs” last season. I put that in quotes because I’m including fourth down data, but don’t want to write third and fourth down throughout this post. Regular readers may recall I did something similar last November, but now we can work with full 2012 season numbers.

To grade third down performance, I included sacks but threw out all rushing data (not for any moral reason, just in the interest of time). The first step in evaluating third down performance is to calculate the league average conversion rate on third downs for each distance. Next, I came up with a best-fit smoothed line based on the data, which is based off the following formula:

Conversion Rate = -0.0001 * Distance^2 – 0.0224 * Distance + 0.5301

Take a look at the table below. For example, there were 309 passes (i.e., pass attempts or sacks — scrambles are not included) and the league-wide conversion rate was 51.1%. Using the best-fit formula, the smoothed rate is 50.8%. There is nothing groundbreaking here — the conversion rates drop as the “to go” number increases, but it helps to quantify what we already know.

To GoPassesFirst DownsRateSmoothed Rate
130915851.1%50.8%
241520850.1%48.5%
348720742.5%46.2%
451222744.3%43.9%
555922640.4%41.6%
654122842.1%39.2%
752118134.7%36.8%
842614333.6%34.5%
936511631.8%32%
1072822030.2%29.6%
112137133.3%27.2%
121533925.5%24.7%
131352417.8%22.2%
141072220.6%19.7%
151432215.4%17.2%
166258.1%14.6%
17681217.6%12%
185036%9.5%
195335.7%6.8%
204836.3%5%

[continue reading…]

{ 23 comments }

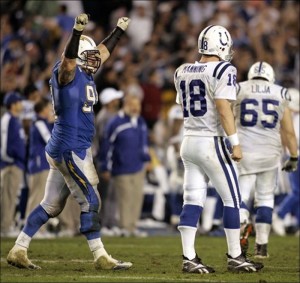
The guy on the right was a loser until he wasn't.

The guy on the right was a loser until he wasn't.

Longtime readers of this blog know that I’m not a big fan of Matt Stafford. Last year, when most people were praising his breakout 2011 season, I questioned whether he was as good as his backers claimed. And, of course, his 2012 performance only raised more questions.

Stafford has a 17-28 career record, which in light of his recent contract extension, has caused people to criticize the Lions for giving big money to a player who is not a “winner.” There are legitimate reasons to criticize Stafford, so why would people fall back on statements like this? I’m sure Lions fans wish the team had won more games under Stafford, but that’s in the past. The real question — and the one faced by Lions management before giving him the extension — is whether his current career record has any predictive value when it comes to his future record.

Since 1960, there have been 77 quarterbacks [1]Because their first seasons as starters came after age 25, I decided to eliminate Jeff Garcia, Trent Green, Warren Moon, Kurt Warner, Ed Brown, Tony Romo, Mark Rypien, and Jim Kelly from this … Continue reading who started at least 25 games in their first four seasons and then 25 more games in years five through eight. There’s some survivor bias in the sample — if you stick around for 25+ starts in years five through eight, you’re probably a pretty good quarterback — but there’s not much we can do about that. If you run a regression using winning percentage through four years as your input and winning percentage in years five through eight as your output, you get the following best-fit equation:

0.450 + 0.20 * Old Win %

The correlation coefficient is a tiny 0.04, and the p-value on the “Old Win %” variable is 0.09. Putting aside the questions of statistical significance, there is no practical effect. Stafford has a 0.377 winning percentage, which means this formula would predict him to win 52.6% of his games from 2013 to 2016. Joe Flacco won 68.75% of his games in his first four seasons; this would say he should be expected to win 58.7% of his games in years five through eight. In other words, someone with a great winning percentage should be expected to win only one more game per season than someone with a terrible winning percentage. And that’s even assuming the results are statistically significant, which many would say they are not. [2]And, of course, it doesn’t mean that that one extra win is because of the quarterback. Presumably, like in the case of Flacco, those quarterbacks who win games early are on good teams, and … Continue reading
[continue reading…]

References

References
1 Because their first seasons as starters came after age 25, I decided to eliminate Jeff Garcia, Trent Green, Warren Moon, Kurt Warner, Ed Brown, Tony Romo, Mark Rypien, and Jim Kelly from this study.
2 And, of course, it doesn’t mean that that one extra win is because of the quarterback. Presumably, like in the case of Flacco, those quarterbacks who win games early are on good teams, and those teams are more likely to stay good than the bad teams.
{ 8 comments }

Wilson scrambles and gets credit for it.

Wilson scrambles and gets credit for it.

I hate passer rating. So do you. Everyone does, except for Kerry Byrne. Passer rating is stupid because it gives a 20-yard bonus for each completion, a 100-yard penalty for each interception, and an 80-yard bonus for each touchdown. In reality, there should be no (or a very small) weight on completions, a 45-yard weight on interceptions, and a 20-yard weight on touchdowns.

But let’s ignore those issues today. Reading Mike Tanier’s recent article inspired me to make see what passer rating would look like if we make three tweaks. I’m not going to change any of the weights in the formula, but just redefine the variables.

1) There’s no reason to exclude sack data from passer rating. I’ve stopped writing about how sacks are just as much (if not more) on the quarterback than other passing metrics, because I think that horse has been pretty well beaten by Jason Lisk and me.

2) Scrambles should be treated like completed passes. If Russell Wilson is about to be sacked, but escapes and run for 7 yards, why should that be treated any differently than if Peyton Manning is about to be sacked, but throws a seven-yard pass at the last second?

3) Lost Fumbles should be counted with interceptions. One could make a few advanced arguments here — we should use all fumbles instead of lost fumbles, or fumbles should be given an even stronger weight than interceptions (although consider that in light of this post), or that we should limit ourselves to just fumbles lost on passing plays. I’m going to play the simple card here, and just use lost fumbles data on the season level.

Passer rating consists of four metrics, all weighted equally: completions per attempt, yards per attempt, touchdowns per attempt, and interceptions per attempt. I will use the same formula with the same weights and the same variables, but redefine what those variables are. Here are the new definitions, with the additions in blue.

Completion percentage is now (Completions plus Scrambles) / (Pass Attempts plus Sacks plus Scrambles)

Yards per Attempt is now (Passing Yards plus Yards on Scrambles minus Sack Yards Lost) / (Pass Attempts plus Sacks plus Scrambles)

Touchdown Rate is now (Passing Touchdowns plus Touchdowns on Scrambles) / (Pass Attempts plus Sacks plus Scrambles)

Turnover Rate will replace Interception Rate in the formula, and is calculated as (Interceptions plus Fumbles Lost) / (Pass Attempts plus Sacks plus Scrambles)

The table below lists all of those metrics for the 32 quarterbacks who had enough pass attempts to qualify for the passer rating crown, along with Alex Smith and Colin Kaepernick, who just missed qualifying. Let’s look at the Robert Griffin III line.

He completed 258 of 393 pass attempts for 3200 yards, with 20 touchdowns and five interceptions. Those are the standard stats that make up passer rating, but he also took 30 sacks and lost 217 yards on those sacks. That makes Griffin’s numbers worse, but he also had 38 scrambles for 302 yards (which gets recorded as 38 completed passes for 302 yards), with no scramble touchdowns. Finally, he lost two fumbles. His new completion percentage is 64.2%, his new yards per attempt is 7.13, his new touchdown rate is 4.3%, and his turnover rate (which includes fumbles) is 1.5%. The final two columns show each quarterback’s passer rating under the normal system and their passer rating using these metrics, which I’ll call the FPPR for short.
[continue reading…]

{ 14 comments }

Sid Luckman did it twice. Two Packers quarterbacks, Arnie Herber and Irv Comp, did it with help from Don Hutson. Sammy Baugh did it as a rookie in 1937.

In five out of eleven seasons from 1936 to 1946, the league leader in passing yards also won the NFL championship. Otto Graham led the AAFC in passing yards in ’47, ’48, and ’49, and the Browns won the championship each of their four seasons in the AAFC. But since then, only two quarterbacks have led the league in passing yards in the same season as winning a title. Can you name them?

Click Show for Answer Show

Want to take a look at the list of all 95 players to lead their league in passing and their team’s final results? Click the “Show” button below:

All Passing Leaders Show

Of course, you already knew that passing yards wasn’t strongly correlated with winning. But what about being the league’s most valuable player? This year, the Miami Heat won the NBA title and LeBron James was the MVP (for the second straight year). But in the NFL, it’s much rarer for a player to pull off that feat: Adrian Peterson won MVP, but the Minnesota Vikings weren’t very close to winning the Super Bowl. Can you name the last player to win the MVP and the Super Bowl in the same year?

Click Show for Answer Show


One more bit of trivia. To really be like LeBron, an NFL player would need to win the MVP, the Super Bowl, and the Super Bowl MVP. That’s happened six times in NFL history, but only once by a non-quarterback. Can you name him?

Click Show for Answer Show

{ 3 comments }

Yards per Attempt is the basic statistic around which the passing game should be measured. It forms the base of my favorite predictive statistic (Net Yards per Attempt) and my favorite explanatory statistic (Adjusted Net Yards per Attempt). But it’s not perfect.

In theory, Yards per Attempt is a system-neutral metric. If you play in a conservative, horizontal offense, you can have a very high completion percentage, like David Carr in 2006. But if you’re not any good (like Carr in 2006), you’ll produce a low yards-per-completion average, dragging down your Y/A average. You can’t really “game” the system to get a high yards per attempt average; the way to finish among the league leaders in Y/A is simply by being very good.

Courtesy of NFLGSIS, I have information on the length of each pass (or Air Yards) thrown during the 2012 regular season. I then calculated, for each distance in the air, the average completion percentage and average yards per completion. In the graph below, the X-Axis shows how far form the line of scrimmage the pass went (or, as Mike Clay calls it, the depth of target). The blue line shows the average completion percentage (off the left Y-Axis) based on the distance of the throw, while the red line shows the average yards per completion (off the right Y-Axis). For example, passes four yards past the LOS are completed 69% of the time and gain 5.4 yards per completion, while 14-yard passes are at 50% and 17.6.

Cmp vs. YPC2

We can also follow up on yesterday’s post by looking at Air Yards vs. YAC for each distance or depth of throw. Air Yards is in red and on the right Y-Axis, while average yards after the catch is in blue and measured against the left Y-Axis. Initially, there is a pretty strong inverse relationship, just like with completion percentage and yards per completion. On a completion that is one yard past the line of scrimmage, the average YAC is 5.5; on a completion 10 yards downfield, the average YAC drops to 3.0. This is why players like Percy Harvin and Randall Cobb will rack up huge YAC numbers. But once you get past 13 or 14 yards, YAC starts to rise again. This makes sense, as that far down the field, a player is just one broken tackle away from a huge gain (I suspect using median YAC might paint a different picture).
[continue reading…]

{ 16 comments }

Luck winds up to throw deep

Luck winds up to throw deep.

Consider the following example. The Colts gain possession at the 20-yard line. Andrew Luck is in shotgun and throws a strike to Reggie Wayne, who catches it at the 30, runs 15 yards, and gets tackled at the 45-yard line. Luck gets credited with 25 passing yards and Wayne records 25 receiving yards. Wayne is also credited with 15 yards after the catch, a statistic that you’ll occasionally see discussed or cited.

But you rarely see Luck’s completion split into (a) 10 yards through the air, and (b) 15 yards after the catch by his receiver. Brian Burke calls those 10 yards “Air Yards” and I think that is a pretty useful moniker. The question is, what do you do with Air Yards? Luck led the NFL in Air Yards per completed pass last year (8.0), but that doesn’t make the statistic an indicator of quality. Tim Tebow’s 2011 performance produced the highest single-season Air Yards per completion average since 2006 (8.9), while Jake Delhomme (2008) and Derek Anderson (2010) each have led the league in that metric, too. Air Yards per completed pass is a very useful way to describe a player’s style, but you can’t use it alone to determine a player’s quality.

One question I have: Are Air Yards more repeatable for a quarterback than the yards he gains via his receivers’ YAC? It’s important to keep that question separate from this one: Is a quarterback who has a high number of air yards and a low YAC better than a quarterback in the opposite situation? Today, I plan to focus on the first question, but let’s take a second to address the second one.

According to ESPN’s research, yards after the catch is more about what the receiver does than the quarterback. As a result, a completion that is in the air for 40 yards is better for a quarterback’s ESPN QBR than a pass that is in the air for 5 yards on which the receiver runs for 35 yards after the catch. That makes sense, I suppose, and I suspect that’s probably true more often than not. The easiest counterargument is to point to Joe Montana, and say that what made Montana great was his pinpoint accuracy that enabled players like Jerry Rice to rack up big YAC numbers.I’m going to put off any further analysis of how much of YAC should be attributed to the quarterback and how much to the receiver, because it’s pretty complicated. One thing that is a bit easier to analyze is how “sticky” Air Yards are from year to year.
[continue reading…]

{ 25 comments }

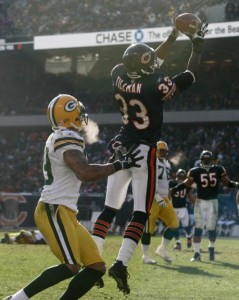
Throwing deep against Charles Tillman can be hazardous to your passer rating

Throwing deep against Charles Tillman can be hazardous to your passer rating.

Last off-season, I produced an exhaustive analysis of fumble recovery rates. With 13 years of play-by-play data at my disposal, I thought it would be worthwhile to take a closer look at interceptions. You can skip to the results section if you like, but let me start with a few disclaimers.

Interceptions are tricky to analyze. Interception rates are very inconsistent from year to year, so much so that completion percentage alone may be a better predictor of future interception rate than actual interception rate. But putting aside randomness, there are two other big factors that determine interception rates: the score in the game and the length of the throw.

Just about every quarterback will throw more interceptions when his team is trailing in the fourth quarter. Situation plays a huge role in football, and that’s true when it comes to interception rates, too. Similarly, quarterbacks are much more likely to be intercepted on deep passes than short ones. One thing I wanted to look at was how much league-wide interception rates varied over a wide range of circumstances.

Unfortunately, there still is a bit of bias in the data. The best quarterbacks are most likely to be winning and the worst quarterbacks are most likely to be losing. That means to the extent that trailing teams throw more interceptions than leading teams, the results are probably slightly overstated. Still, I think getting a sense of the league baseline over hundreds of thousands of throw — even if not evenly distributed — can be a useful exercise.

The Results

From 2000 to 2012, there were 6,689 interceptions thrown. Here’s the breakdown with respect to the points differential (i.e., points scored minus points allowed) for the offensive team immediately before the interception. For example, teams trailing by more than four touchdowns have thrown 110 interceptions over the last 13 regular seasons. That accounts for 1.6% of all interceptions thrown over that time period:
[continue reading…]

{ 15 comments }

Twenty quarterbacks started all sixteen games last season:

Mark Sanchez started 15 games for the Jets, but was benched for the week 16 game against the Chargers.  Carson Palmer (ribs/chest) and Brandon Weeden (shoulder) were each injured in week 16, causing them to sit out week 17 (although Weeden probably could have played if the game meant anything.) In addition, Jay Cutler (concussion) and Robert Griffin III (knee) each missed one — but only one — game due to injury. [1]Griffin was on the injury report twice for head injuries but did not miss a start due to concussions.  As for the other seven teams:
[continue reading…]

References

References
1 Griffin was on the injury report twice for head injuries but did not miss a start due to concussions.
{ 2 comments }

Tim Tebow's prayers are answered: He's #1

Tim Tebow's prayers are answered: He's #1

With the Jets releasing Tim Tebow, it appears that his NFL career may be over. If that’s the case, it’s time to reflect on a great career that never ceased to captivate the nation. While there are many ways to grade a quarterback, probably the best and simplest measure would be “production in last home start.” After all, the NFL is a ‘what have you done for me lately’ league.

The table below lists the final home start for over 400 retired (or close to retired) quarterbacks (the default is to show just 25 quarterbacks, but the table is fully sortable and searchable, and you can change the number of players displayed by using the drop-down box on the left). For each quarterback, I have provided a link to the boxscore from that game, the result of the game, and the quarterback’s passing and rushing statistics. If Tebow is in fact retired, he will have finished with the highest Adjusted Yards per Attempt (minimum 10 attempts) of any player in his last home start:
[continue reading…]

{ 15 comments }

A poor man's Matt Stafford?

Tyler Bray is this year's youngest quarterback prospect.

For the most part, age is rarely discussed when talking about college quarterbacks. Outside of the Brandon Weedens and Chris Weinkes of the world, you generally don’t hear much from the draft community about the age of a prospect. But we do know that age matters, and that all other things being equal, being younger is better (or a sign that the player has a higher ceiling).

In this year’s draft, Tyler Bray is the neophyte, as he’ll be 21 years and 8 months old at the start of the season. He’s just weeks older than Matt Stafford and Josh Freeman were this time four years ago. It also means he’s 10 months younger than Geno Smith, the second youngest of the top prospects. On the other hand, Tyler Wilson will be 24 when the season starters, Landry Jones just turned 24, and Jordan “did you know Aaron is my brother” Rodgers will be 25 on August 30th. Do NFL teams generally ignore age — i.e., fail to measure younger quarterbacks against a lower bar? Or perhaps do they overemphasize age, thinking a young player has such high upside and can be taught anything that they ignore red flags? That’s what this post seeks to answer.
[continue reading…]

{ 7 comments }

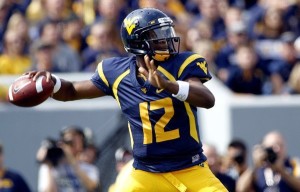
Quarterbacks wearing #12 have won 14 Super Bowls

Quarterbacks wearing #12 have won 14 Super Bowls.

What does it mean that Geno Smith comes from a long line of Mike Leach/Dana Holgorsen star quarterbacks? I don’t know. At a minimum, it means he’s part of a very interesting and distinguished set of college quarterbacks. Because few players have dominated college football over the last 15 years like quarterbacks under Mike Leach and Dana Holgorsen.

Leach is one of the most fascinating characters in recent college football history, and he’s been one of the most influential coaches in the modern passing game. That’s what tends to happen when your quarterbacks produce video game numbers practically every season. Leach was the offensive coordinator under Hal Mumme at Kentucky in 1997 and 1998, which is when the Air Raid offense arrived on the national radar. At the time, there hadn’t been any Wildcats drafted in the first round since running back George Adams in 1985. Twenty-six months after Leach and Mumme arrived in Lexington, Tim Couch was the first pick in the NFL draft.

Leach then spent a year as the offensive coordinator for the Oklahoma Sooners with Josh Heupel at quarterback. Heupel led the conference with 3,460 passing yards and 30 touchdowns, and also sported the highest completion percentage (62.0%) in the conference. Those were big numbers in a conference where only four players threw for even 1900 yards, and was enough to land Leach the head coaching job at Texas Tech after only a season in Norman. When Leach moved to Lubbock, Texas in 2000, the quarterback cupboard appeared bare. He took unheralded sophomore quarterback Kliff Kingsbury and shaped him into the player that led the NCAA in pass attempts in 2000, 2001, and 2002. Klingsbury led the Big 12 in passing yards in both 2000 and 2001, and then as a senior, became just the third player in college football history to pass for 5,000 yards in a season (after Ty Detmer and David Klingler). Klingsbury went on to have an unremarkable career in the NFL before excelling as an assistant coach with the Houston Cougars. He followed then-head coach Mike Sumlin to Texas A&M after the 2011 season, and after turning Johnny Manziel into a Heisman Trophy winner, Kingsbury is now the new head coach at his alma mater.
[continue reading…]

{ 4 comments }

Wait, how many USC quarterbacks are starting?

Wait, how many USC quarterbacks are starting?

There was a streak in jeopardy in week 17 of the 2012 season. With former Trojan Carson Palmer injured, the Raiders skipped over his former USC teammate, Matt Leinart, and started ex-Ohio State Buckeye Terrelle Pryor at quarterback for the season finale. Since the Chiefs had previously benched Matt Cassel for Brady Quinn, if it wasn’t for Greg McElroy missing the Jets last game against the Bills — which reinserted Mark Sanchez into the starting lineup for New York — USC’s streak of consecutive weeks with a starting quarterback in the NFL would have ended. Instead, the streak is now up to 81 weeks with at least one of Sanchez, Palmer, Cassel and/or Leinart starting.

As impressive as that might sound, it’s not even halfway to the record. You can take a second to think about which school had the longest run with at least one of its former players starting at quarterback, but first, another bit of trivia: I noticed that in week 12 of the 2009 season, Matt Leinart, Matt Cassel, Mark Sanchez, and Carson Palmer all started. But believe it or not, that’s not a record, either.

In week 13 of the 2000 season, five quarterbacks from the University of WashingtonWarren Moon, Mark Brunell, Damon Huard, Chris Chandler, and Brock Huard — were starting in the NFL. Add in Washington State’s Drew Bledsoe and Ryan Leaf, and seven quarterbacks that played college in the Evergreen State were starting in the NFL that weekend.
[continue reading…]

{ 7 comments }

Quarterback Age Curves

The master and the puppet?

The master and the puppet?

Last summer, I looked at the age curves for running backs in an attempt to find out if there is a magical cliff at age 30 (there isn’t). But when I wrote about Josh Freeman last week, I started thinking about quarterback age curves.

The first step in trying to measure the aging patterns of quarterbacks is to figure out a sample to analyze. I decided to look at all quarterbacks who entered the league since 1970 and have since retired. I further limited my sample to quarterbacks who had at least three seasons of above-average play based on this system. That brought us to a group of 77 quarterbacks, from quarterbacks like Jon Kitna, Jay Fiedler, and Dan Pastorini to Hall of Famers like Joe Montana, Brett Favre, and Dan Marino.

While before I graded quarterbacks based on how much value over average they provided, that baseline is too high for this type of post. Instead, I gave quarterbacks credit for their value over replacement, defined as 75% of the league average. I then calculated the best three seasons of value over replacement (VOR) for each quarterback’s career to get a sense of their peak level of play. The last step was to divided their VOR in each season of their career by their peak value. Do this for each of the 77 quarterbacks, and we can get a sense of quarterback aging patterns.

There is another thing to consider when coming up with an age curve: The intuitive way is to sum up each quarterback’s value (relative to his peak) in each season and divide that total by the number of quarterbacks active at that age. Another way is to divide that total by 77, the number of quarterbacks in the study. The former method will make really young and really old ages look closer to average than they really are, but I have decided to include both methods in the picture below. The blue line represents the average performance based on the number of quarterbacks actually playing in the NFL that season; the red line shows the aging patterns when you divide by the total number of passers in the group.
[continue reading…]

{ 11 comments }

There have been 35 quarterbacks in NFL history to throw for at least 30,000 yards. Given enough time, you could probably guess that Drew Bledsoe, Jim Kelly, and Steve McNair are three of them. All three have something else in common: they were all born on February 14th.

If we drop the cut-off to 16,000 yards, we jump to 125 quarterbacks but get to include David Garrard, another Valentine’s Day baby. With 366 possible birthdays, it’s pretty incredible that four out of a random group of 125 people would have the same birthday. Consider that no one born on any the following seven days — January 30th, March 4th and 30th, April 9th and 13th, and June 12th and 21st — has ever gained a single passing yard in NFL history. [1]Even February 29th has a couple of representatives, led by Dick Wood and his 7,153 passing yards.

But wait, there’s more: If we drop the threshold to 3,500 passing yards, we get to include Patrick Ramsey and Anthony Wright. Those guys may not impress you, but consider that only 310 players have thrown for 3,500 yards. That means dozens of days have zero quarterbacks with 3,500 yards, so slotting in Ramsey and Wright as QB5 and QB6 on your birthday dream team is pretty damn good. February 13th, for example, has Jim Youel as its top passer, and he only collected 849 yards. Yesterday’s number two slot goes to the greatest receiver of all-time to ever play with Aaron Brooks (106 yards), outpacing Drew Henson and his 98 career yards. Clearly, passing yardage is for lovers. [2]Long-time readers will recognize that this post is a blatant ripoff of Doug’s classic Passing Yardage is for Lovers, published five years ago to the day.
[continue reading…]

References

References
1 Even February 29th has a couple of representatives, led by Dick Wood and his 7,153 passing yards.
2 Long-time readers will recognize that this post is a blatant ripoff of Doug’s classic Passing Yardage is for Lovers, published five years ago to the day.
{ 17 comments }

The History of Black Quarterbacks in the NFL

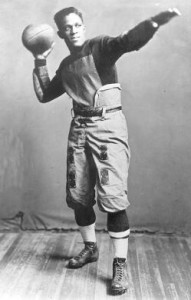
Fritz Pollard, the first African American coach and quarterback in the NFL.

Fritz Pollard, the first African American coach and quarterback in the NFL.

Five years ago, I wrote a four part series detailing the history of the black quarterback. With February being Black History Month and Super Bowl XLVII marking the 25th anniversary of Doug Williams becoming the first black quarterback to win a Super Bowl, I figured it was worth another trip down memory lane.

The history of black quarterbacks in professional football is complicated. As recently as 2007, the New York Giants had never had a black quarterback throw even a single pass. On the other hand, as far back as 1921, Frederick Douglass “Fritz” Pollard not only quarterbacked the Akron Pros, but was also the first black head coach in NFL history.  A year earlier, Pollard and Bobby Marshall were the first two black players in professional football history and helped the Pros win the championship in the NFL’s inaugural season. [1]At the time, the NFL went by the name the American Professional Football Association. It was not known as the NFL until 1922. The Pros ran the single-wing, and Pollard was the player lined up behind the center who received the snaps. At the time the forward pass was practically outlawed, so Pollard barely resembles the modern quarterback outside of the fact that he threw a few touchdown passes during his career. [2]In addition to his NFL exploits, Pollard also achieved a great deal of fame for leading Brown to back-to-back road wins over the powerhouse schools of the time, Yale and Harvard, in 1916. He would … Continue reading

According to the great Sean Lahman, at least one African American played in the NFL in every year from 1920 to 1933, although Pollard was the only quarterback. [3]It wasn’t just African Americans that had full access during this era: Jim Thorpe coached and starred in a team composed entirely of Native Americans called the Oorang Indians in 1922 and 1923. Beginning in 1934, that there was an informal ban on black athletes largely championed by Washington Redskins owner George Marshall.   It wasn’t until 1946 that black players were re-admitted to the world of professional football, when UCLA’s Kenny Washington [4]Who occupied the same backfield with the Bruins as Jackie Robinson. and Woody Strode were signed by the Los Angeles Rams; in the AAFC, Bill Willis and Marion Motley were signed by Paul Brown’s Cleveland Browns that same season.
[continue reading…]

References

References
1 At the time, the NFL went by the name the American Professional Football Association. It was not known as the NFL until 1922.
2 In addition to his NFL exploits, Pollard also achieved a great deal of fame for leading Brown to back-to-back road wins over the powerhouse schools of the time, Yale and Harvard, in 1916. He would become the first African American to be named an All-American and the prior season, he lead Brown to the Rose Bowl.
3 It wasn’t just African Americans that had full access during this era: Jim Thorpe coached and starred in a team composed entirely of Native Americans called the Oorang Indians in 1922 and 1923.
4 Who occupied the same backfield with the Bruins as Jackie Robinson.
{ 38 comments }

Now that we live in a world where Joe Flacco and Eli Manning have quarterbacked 3 of the last 6 Super Bowl-winning teams, you might be tempted to think that winning a Super Bowl as a QB doesn’t mean what it used to. After all, the playoffs are getting more random — as Aaron Schatz pointed out last night, four of the last six Super Bowl champs have finished the regular season with 10 or fewer wins. So it stands to reason that, as the championship teams themselves post less-remarkable seasons, so too would their quarterbacks not be the cream of the crop. And for all of his postseason brilliance, Flacco was just the league’s 17th-best quarterback during the regular season. Does his ascendancy, coming on the heels of Manning’s, signal a new trend?

To answer that question, I turned to a methodology I’ve used many times before. The basic premise is that, to put modern and historical quarterbacks on an even playing field (no pun intended), you must translate their stats into a common environment. To do this, you take the quarterback’s stats from a given season, pro-rate to 16 scheduled games, and multiply by the ratio of the league’s per-game average during the season in question to that of a common reference season. For instance, if I’m adjusting Terry Bradshaw’s 1977 passing yards to the 1991-2012 period, I would multiply his actual total of 2,523 by (16/14) to account for the shorter season that year, then multiply that by (225.1/162.2) to account for the change in the league’s passing environment, giving an adjusted total of 4,001 yards.

After doing that for every QB season since the merger, I then plugged the translated stats into a regression formula that predicts Football Outsiders’ Yards Above Replacement based on the QB’s box score stats (including the standard cmp/att/yds/td/int, plus sacks, fumbles, and rushing stats). This gives us Estimated Yards Above Replacement (eYAR) a measure of total value for each QB season, adjusted for schedule length and league passing conditions, which is perfect for historical analysis.

To get an idea of what we’re talking about, here are Flacco’s career translated stats and eYAR numbers:
[continue reading…]

{ 6 comments }

Flaccoing?

Flaccoing?

In September, I started a post by asking you to make this assumption:

Assume that it is within a quarterback’s control as to whether or not he throws a completed pass on any given pass attempt. However, if he throws an incomplete pass, then he has no control over whether or not that pass is intercepted.

If that assumption is true, that would mean all incomplete pass attempts could be labeled as “passes in play” for the defense to intercept. Therefore, a quarterback’s average number of “Picks On Passes In Play” (or POPIP) — that is, the number of interceptions per incomplete pass he throws — is out of his control.

After doing the legwork to test that assumption, I reached two conclusions. One, interception rate is just really random, and predicting it is a fool’s errand. Two, using a normalized INT rate — essentially replacing a quarterback’s number of interceptions per incomplete pass with the league average number of interceptions per incomplete pass — was a slightly better predictor of future INT rate than actual INT rate. It’s not a slam dunk, but there is some merit to using POPIP, because completion percentage, on average, is a better predictor of future INT rate than current INT rate.

So, why am I bringing this up today, at the start of Super Bowl week? Take a look at where Sunday’s starting quarterbacks ranked this year in POPIP (playoff statistics included, minimum 250 pass attempts):
[continue reading…]

{ 14 comments }

In October 2009, Neil Paine wrote that Eli Manning had seemingly turned the corner, starting with the five-game stretch from week 17 of the 2007 season that ended in the Super Bowl. And since that post, Manning has been even better, with his 2011 season standing out as the best year of his career. I thought it would be fun to chart Eli’s career game-by-game according to ANY/A. Actually, since that chart would be incredibly volatile, I’m going to do it in five- and ten-game increments.

The chart below shows the average of Manning’s ANY/A in each of his last five games (playoffs included) beginning with the fifth game of his career in 2004. Of note: the black line represents the league average ANY/A (which, if we’re talking about the last 2 games of Year N and the first 3 games of Year N+1, is 40% of the Year N league average and 60% of the Year N+1 league average), and the two big purple dots show the two Super Bowl victories (or, more accurately, the Super Bowl win, the prior three playoff wins, and the week 17 game).

weekly ELI
[continue reading…]

{ 1 comment }

Those are some clutch shirts

Those are some clutch shirts.

Eight years ago — almost to the day — our old PFR colleague Doug Drinen wrote a Sabernomics post about “The Manning Index”, a metric designed to roughly gauge the clutchness (or chokeitude) of a given quarterback by looking at how he did relative to expectations (he revived this concept in version two, six years ago). In a nutshell, Doug used the location of the game and the win differential of the two teams involved to establish an expected winning percentage for each quarterback in a given matchup. He then added those up across all of a quarterback’s playoff starts, and compared to the number of wins he actually had. Therefore, quarterbacks who frequently exceeded expectations in playoff games could be considered “clutch” while those who often fell short (like the Index’s namesake, Peyton Manning) might just be inveterate chokers.

Doug ran that study in the midst of the 2004-05 playoffs, so it shouldn’t be surprising that Tom Brady (who was at the time 8-0 as a playoff starter and would run it to 10-0 before ever suffering a loss) came out on top, winning 3.5 more games than you’d expect from the particulars of the games he started. Fast-forward eight years, though, and you get this list of quarterbacks who debuted after 1977:
[continue reading…]

{ 31 comments }

In 2011, San Francisco made it to the NFC Championship Game with Alex Smith at quarterback; today, the 49ers will face the Falcons with Colin Kaepernick as their starter. This makes them the 9th team since 1970 to make the conference championship game in consecutive years but to start different quarterbacks in that game. Can you name the last team?

Trivia hint 1 Show


Trivia hint 2 Show


Trivia hint 3 Show


Click 'Show' for the Answer Show

{ 1 comment }

Matt Ryan is about to throw a touchdown or an interception, depending upon the month

Matt Ryan is about to throw a touchdown or an interception, depending upon the month.

For the second time in three years, the Atlanta Falcons are the NFC’s number one seed. Just like in 2010, the Falcons started this season 13-2 but ended the year with only 11 Pythagorean wins. In 2010, Atlanta lost its first game to the #6 seed Packers, who sported the highest SRS of any NFC team in 2010. This year, Atlanta hosts the #6 seed Seahawks, who finished 2012 with highest SRS of any NFC team. History suggests that this is a difficult challenge for Atlanta, regardless of the Falcons’ lofty record.

One of the obvious topics the mainstream media has hit on this week has been Matt Ryan’s inability to win in the playoffs. As everyone knows, Atlanta is 0-3 in the playoffs in the Mike Smith/Matt Ryan era. As Ryan prepares for his fourth playoff start on Sunday, history offers some comfort: four other quarterbacks (since 1950) have been in exactly the same situation, entering their fourth playoff start with an 0-3 record. Those quarterbacks went 3-1 in their fourth game. Let’s stroll down memory lane.

  • At age 37, Y.A. Tittle and the New York Giants went to Soldier Field to battle the famed 1963 Bears. Tittle had gone 0-3 in his previous three NFL playoff games, and had lost his lone playoff game in the AAFC, too. In 1957, Tittle was on the wrong side of the most famous comeback in playoff history prior to Bills/Oilers. In that game, Tittle threw three touchdowns against the Lions as San Francisco opened up what looked to be an insurmountable 27-7 lead. But Tittle finished the day with three interceptions, and the Lions came back and won, 31-27. In 1961, Tittle was with the Giants, and was part of an embarassing 37-0 shutout on the quite literal frozen tundra of Lambeau Field. Tittle was a miserable 6/20 for 65 yards with 4 interceptions. The next year, the Giants and Packers met again, this time at a frozen and windy Yankee Stadium, with the Packers again topping the Giants. [1]This was the first game Ed Sabol filmed for the NFL, under the label Blair Motion Pictures. So you can imagine that when Tittle and the Giants had to travel to Soldier Field in 1963 — the Giants third straight year in the title game — Tittle probably carried the choker label. With a wind chill of -11 degrees, the weather was again miserable, and the result was more of the same for Tittle and New York. The Giants lost 14-10, and Tittle threw 1 touchdown against 5 interceptions.
  • Jack Kemp took the Chargers to the AFL title game in the league’s first two seasons. On New Year’s Day 1961, Kemp was outplayed by Houston’s George Blanda, and Billy Cannon put the final nail in the coffin as the Oilers won, 24-16. The Oilers and Chargers met again in the title game the following year — this time in San Diego — but Kemp had a miserable game, throwing 4 interceptions as the Chargers lost, 10-3. By 1963, Kemp was with the Bills, and Buffalo had finished the year tied with the Patriots, setting up a one-game playoff for the division title at War Memorial Stadium. But Kemp struggled and was benched for Daryle Lamonica at halftime, as the Bills lost 26-8. In 1964, the Bills went 12-2, and entered the AFL title game against Kemp’s old team, San Diego. At this time, Kemp had an 0-3 post-season record, and surely Chargers fans taunted the citizens of Buffalo by calling Kemp the Mayor of Chokesville. While Kemp did not produce stellar numbers, the Bills managed to defeat the Chargers and capture their first AFL championship. The hero of the game may have been Mike Stratton, who produced the “hit heard round the world” early in the game, knocking out San Diego’s Keith Lincoln. In any event, the Mayor of Chokesville was able to abdicate his throne.
  • [continue reading…]

References

References
1 This was the first game Ed Sabol filmed for the NFL, under the label Blair Motion Pictures.
{ 5 comments }
Next Posts Previous Posts