≡ Menu

WARNING: unbalanced footnote start tag short code found.

If this warning is irrelevant, please disable the syntax validation feature in the dashboard under General settings > Footnote start and end short codes > Check for balanced shortcodes.

Unbalanced start tag short code found before:

“From 1970-present, I used the Associated Press All-Pro Team. I counted First-Team selections as 3 points and Second-Team selections as 1 point. A First-Team selection by one or more other major organizations, for a player not named First-Team by AP, counts as +1, and an MVP selection by any major o…”

Brad Oremland is a longtime commenter and a fellow football historian. Brad is also a senior NFL writer at Sports Central. There are few who have given as much thought to the history of quarterbacks and quarterback ranking systems as Brad has over the years. What follows is Brad’s latest work on quarterback statistical production.


This is the penultimate article in a seven-part series. It is a supplement to my series on the greatest quarterbacks of all time, last year’s article on the top-ranked QBs in Total Statistical Production, and last month’s post about QB-TSP in the 2017 season and another way of using TSP. Over the last five weeks, I’ve written about the top 100 quarterbacks of the Modern Era, as ranked by TSP:

81-100
61-80
41-60
21-40
1-20

This article presents a different way of evaluating quarterbacks. It is data-heavy, so if you’re just here for my prose, I’m sorry to disappoint. The chart below shows those same 100 QBs, along with each player’s: Adjusted TSP, Career Value, Seasons among the top 10 in QB-TSP, Top-10-Points, Year-Points, 500-TSP seasons, 1,000-TSP seasons, 1,500-TSP seasons, 2,000-TSP seasons, 2,250-TSP seasons, 2,500-TSP seasons, Pro Bowls, All-Pro honors ((From 1970-present, I used the Associated Press All-Pro Team. I counted First-Team selections as 3 points and Second-Team selections as 1 point. A First-Team selection by one or more other major organizations, for a player not named First-Team by AP, counts as +1, and an MVP selection by any major organization was worth +1.

For instance, in 2016, Tom Brady was named Second-Team All-Pro by AP (1 pt), but First-Team by the Sporting News, so he scored 2 pts that season. The score of AP First-Team All-Pro Matt Ryan was unaffected, remaining 4 points (including his MVP selection). In 1993, the AP All-Pros were Steve Young and John Elway, but the Sporting News chose Troy Aikman. Young scored 3, and Aikman and Elway 1 each. In 1990, Joe Montana scored 4 points, with Randall Cunningham and Warren Moon earning 2 each. [continue reading…]

{ 1 comment }

Brad Oremland is a longtime commenter and a fellow football historian. Brad is also a senior NFL writer at Sports Central. There are few who have given as much thought to the history of quarterbacks and quarterback ranking systems as Brad has over the years. What follows is Brad’s latest work on quarterback statistical production.


Brees threw a lot in garbage time

What I thought was an off-hand musing about Drew Brees’ production in low-leverage situations (for my ongoing series about the greatest statistical QBs in history) sparked a surprisingly contentious debate about whether Brees had padded his stats in garbage time.

I tried to align this with a very conservative definition of “garbage time” … all data are from 2004-17 — 2004 was Brees’ first good season — and none of the game/score situations below produced any wins by any team during those years. “P/B/R” indicates the combined total of Peyton Manning, Tom Brady, and Aaron Rodgers.

Please pardon the informal prose and formatting; this was originally composed as a comment, not an article. [continue reading…]

{ 1 comment }

Top 100 QBs: 20-1, By Brad Oremland

Brad Oremland is a longtime commenter and a fellow football historian. Brad is also a senior NFL writer at Sports Central. There are few who have given as much thought to the history of quarterbacks and quarterback ranking systems as Brad has over the years. What follows is Brad’s latest work on quarterback statistical production.


This is part five of a seven-part series. It is a supplement to my 2015 series on the greatest quarterbacks of all time, last year’s article on the top-ranked QBs in Total Statistical Production, and a recent post about QB-TSP in the 2017 season and another way of using TSP. I strongly encourage you to read those pieces if you haven’t done so already. You may also be interested in the previous entries of this series.

Best Statistical QBs: 81-100
Best Statistical QBs: 61-80
Best Statistical QBs: 41-60
Best Statistical QBs: 21-40

In this series, I present the top 100 pro football quarterbacks as ranked by QB-TSP. This is a purely statistical ranking, with all the drawbacks that entails, and in many places it is not reflective of my subjective evaluations. This week, we examine the top 20 quarterbacks of the Modern Era.

Questions and comments are encouraged, but please understand that this series is a product of extensive research and analysis, not whim or guess or hot take, and it was produced with no agenda except to inform and explain. Thanks for reading. [continue reading…]

{ 0 comments }

Top 100 QBs: 21-40, By Brad Oremland

Brad Oremland is a longtime commenter and a fellow football historian. Brad is also a senior NFL writer at Sports Central. There are few who have given as much thought to the history of quarterbacks and quarterback ranking systems as Brad has over the years. What follows is Brad’s latest work on quarterback statistical production.


This is part four of a five-part series. It is a supplement to my 2015 series on the greatest quarterbacks of all time, last year’s article on the top-ranked QBs in Total Statistical Production, and last month’s post about QB-TSP in the 2017 season and another way of using TSP. I strongly encourage you to read those pieces if you haven’t done so already. You may also be interested in parts one, two, and three of this series.

In this series, I present the top 100 pro football quarterbacks as ranked by QB-TSP. This is a purely statistical ranking, with all the drawbacks that entails, and in many places it is not reflective of my subjective evaluations. Each week, we’ll examine 20 players, continuing this week with ranks 21-40. [continue reading…]

{ 0 comments }

Yesterday, I looked at the 34 quarterbacks to throw 1,000 passes from 2011 to 2017. In that group, there were four quarterbacks who stood out with low interception rates and high sack rates. All four are black, which is pretty unlikely to happen by random chance given that there were just six black quarterbacks in the study.

But that was a small sample. Today, we expand the group to look at all quarterbacks with at least 1,000 career pass attempts who were active in 2002 or later. For each quarterback, I looked at their INT% and sack% in each season, and measured those rates relative to league average. I have plotted the career grades on the graph below.

On the X-Axis is interception rate relative to league average; it spans from -1.5% (which means 1.5% worse than league average: i.e., really bad) to +1.5% (really good). Tom Brady and Aaron Rodgers are the two at just over +1.0%, while Tommy Maddox is at the far left at -1.26% (he has the worst era-adjusted interception rate since the merger). On the Y-Axis is sack rate relative to league average: at the very bottom, of course, is David Carr, at -4.7%; at the very top are Peyton Manning (+3.3%) and … old Bears QB Jim Miller (+3.0%). [1]Miller played from ’95 to ’02, so he just makes it into the study. To be clear, if a player was active in ’02, his entire career was included, which is just another reason why we … Continue reading

So for purposes of this chart, you want to be up and to the right, which indicates better than average sack rates and better than average interception rates. There are 22 black quarterbacks who threw 1,000 passes. I have plotted them in red, while all other data points are in blue. Take a look: [continue reading…]

References

References
1 Miller played from ’95 to ’02, so he just makes it into the study. To be clear, if a player was active in ’02, his entire career was included, which is just another reason why we need to era-adjust the data. Also, yeah, Miller was really good at avoiding sacks.
{ 0 comments }

In December 2010, Jason Lisk wrote an interesting piece about whether race still matters when it comes to quarterback play in the NFL. That article has stuck with me over the years — I referenced it last year in a piece questioning whether Colin Kaepernick’s political stance impacted his style of play in 2016 — and the key excerpt is below:

Still, one of the things I have observed is that black quarterbacks, as a group, have tended to be better at avoiding interceptions than their white counterparts. …

Interceptions are highly random, subject to game situation, dependent on deflections, tips, the receiver running the correct route, the defender making a good play and not dropping the ball. They can also be somewhat controlled by the quarterback’s behavior. If you try to fit the ball into tight windows, your chances for both a good play and a bad one increase. There is also no other quarterback action that gets criticized as “stupid” or “dumb” like an interception thrown. I can see how black quarterbacks feel they need to be more cautious when it comes to interceptions, to avoid that criticism. I suspect that the difference in interception numbers is a real effect driven by this external pressure.

So, I think that race matters, because the numbers – as well as direct statements from McNabb and Doug Williams as quoted in Hill’s piece – tell me it matters in affecting how the black quarterbacks play the game as far as avoiding interceptions.

[continue reading…]

{ 1 comment }

You probably don’t think too much about Vince Young these days. The former Texas Longhorn star and Tennessee Titans disappointment last played in an NFL game back in 2011. But when I ran some queries recently, Young shocked me in a couple of stats. Let’s start with one you probably didn’t expect.

Young had a really good sack rate, particularly in 2009. But what makes Young’s sack rate really impressive is his sack rate relative to his rushing ability. In 2009, Young rushed 55 times and was sacked just 9 times. Among players with at least 200 pass attempts in a season, Young 2009 is the only instance where a player had at least 6 times as many rushing attempts as sacks; even if you drop the ratio to 5 times, only two other seasons are included.

And because Young had an insanely low average sack yards that year — he averaged just four yards lost per sack — he set another “record” that year. Young rushed 55 times and lost 36 yards on sacks; no other player has ever had more rushing attempts than sack yards lost, much less than 1.5:1 ratio that Young had that would hold up until you drop the pass attempt minimum below 120.

For his career, the numbers are similar, though obviously less extreme. Young had 282 career rushing attempts and just 83 sacks; that ratio of 3.40 rush attempts per sack is the highest among all players since 1970 (among the top 200 leaders in pass attempts). If you look at rushing yards compared to sacks, Young was at 17.58-to-1, second only to Michael Vick, who was helped by a remarkable 7.0 yards per carry average that nobody can match.

The table below shows this data for the 200 quarterbacks with the most attempts since 1970. When it comes to being a rushing quarterback and avoiding sacks, nobody can beat Vince Young: [continue reading…]

{ 0 comments }

Top 100 QBs: 41-60, By Brad Oremland

Brad Oremland is a longtime commenter and a fellow football historian. Brad is also a senior NFL writer at Sports Central. There are few who have given as much thought to the history of quarterbacks and quarterback ranking systems as Brad has over the years. What follows is Brad’s latest work on quarterback statistical production.


This is part three of a seven-part series. It is a supplement to my 2015 series on the greatest quarterbacks of all time, last year’s article on the top-ranked QBs in Total Statistical Production, and last month’s post about QB-TSP in the 2017 season and another way of using TSP. I strongly encourage you to read those pieces if you haven’t done so already. You may also be interested in parts one and two of this series.

In this series, I present the top 100 pro football quarterbacks as ranked by QB-TSP. This is a purely statistical ranking, with all the drawbacks that entails, and in many places it is not reflective of my subjective evaluations. Each week, we’ll examine 20 players, continuing this week with ranks 41-60. [continue reading…]

{ 0 comments }

Surplus Yards And QB Seasons, By Adam Steele

Adam Steele is back for another guest post. You can view all of Adam’s posts here. As always, we thank him for contributing.


Earlier this month, I introduced a new stat called Surplus Yards and applied it to the 2017 season. If you haven’t read that post, consider that required background reading.

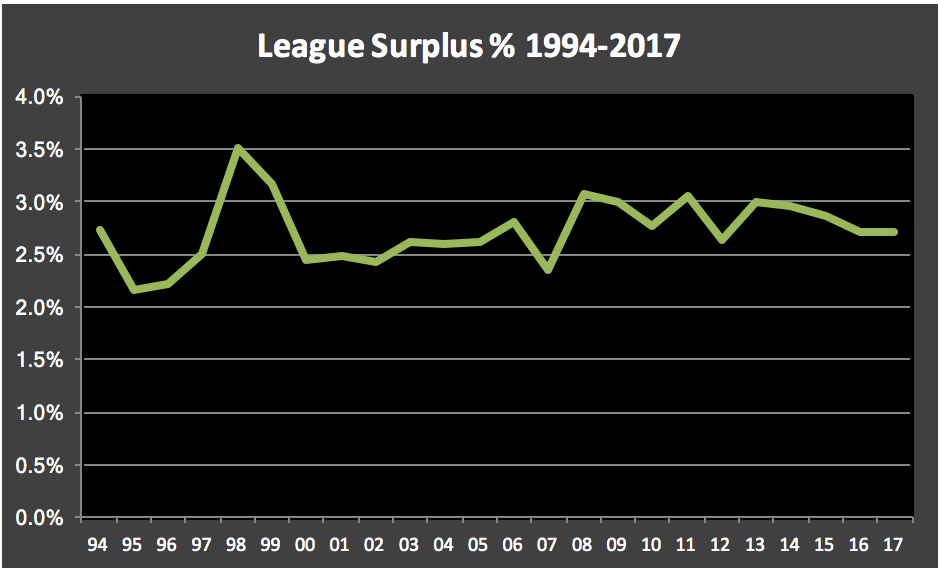
Since then, I calculated and archived every 40+ yard completion since 1994. The chart below shows the league average Surplus % for each of the last 24 seasons:

[continue reading…]

{ 0 comments }

Nobody questions how valuable Rob Gronkowski has been to the Patriots and to Tom Brady. The future Hall of Fame tight end is a dominant force when healthy, and Brady’s numbers with and without Gronk reflect that. With the PFR game play finder, we can easily look at Brady’s career numbers in the regular season on passes to Gronkowski and to everyone else.

[Note: I still am not a fan of using per-target statistics to judge wide receivers, but I find them an interesting — but certainly not definitive — part of the puzzle when looking at quarterback production. Also note: all statistics in this post are from the PFR game play finder, so they may differ slightly from official numbers.]

Here are a few stats to consider:

  • Gronk has seen 8.2% of Brady’s career targets, but is responsible for 10.7% of his career passing yards (+2.6%).
  • On passes to Gronk, Brady has averaged 9.95 yards per attempt; on passes to all other Patriots, Brady has averaged 7.36 yards per attempt, a whopping 2.59 yards/attempt lower.
  • Thought of another way, Gronkowski has elevated Brady’s yards per attempt by 0.21, as Brady has a career yards / attempt average of 7.57.

So yes, Gronk has been great.  [1]And note that using yards is not even the best way to show how valuable Gronk has been.  He’s responsible for 15.3% (!) of Brady’s career touchdowns.; But so has Jordy Nelson, who has been a critical part of the success that Aaron Rodgers has had in Green Bay.  Let’s look at those same numbers:

  • Nelson has seen 14.6% of Rodgers’ career passes, but he is responsible for 18.0% (+3.3%) of his career passing yards.
  • On passes to Nelson, Rodgers has averaged 9.81 yards per attempt; on passes to all other Packers, Rodgers has averaged 7.67 yards per attempt, 2.14 yards/attempt lower.
  • Nelson has elevated Rodgers’ career yards per attempt average by 0.31, as Rodgers has a career Y/A average of 7.98.

Gronkowski being +2.59 Y/A better than all other Patriots is a remarkable figure, and Nelson being at “just” +2.14 doesn’t quite compare.  But due to volume, Nelson has actually raised his quarterback’s career average by a much larger degree.

I used the PFR game play finder to look at the passing breakdown of Brady, Rodgers, and also Drew Brees and Peyton Manning. Some nuggets:

  • Marvin Harrison was responsible for 16.6% of Manning’s targets, the highest in the bunch. Brady is the only quarterback of the bunch who didn’t throw even 9% of his targets to one player; Rodgers, meanwhile, has seen four different receivers (Nelson, Randall Cobb, Greg Jennings, and James Jones) on the receiving end of at least 9% of his passes. This is in part because Rodgers has had a shorter career, and also the general lack of roster turnover in Green Bay.
  • More than any other quarterback, Brees has made a living off of secondary weapons. Kenny Stills (11.82 yards/target, 133 targets), Robert Meachem (10.74, 251), and Devery Henderson (10.27, 384) were the only three players to average over 10 yards per target on at least 100 targets.
  • Brees throws a ton to running backs, and they also kill his average. Among players for these four quarterbacks who were responsible for at least 2.5% of their quarterback’s targets, Brees has the three players with the lowest average gains: LaDainian Tomlinson, Reggie Bush, and Mark Ingram.
  • Nothing stands out immediately to me about Manning: as you would suspect, Reggie Wayne, Harrison, and Demaryius Thomas are the three who have helped him the most, but not to a particularly noteworthy degree. Harrison had the most targets, Wayne bumped his average up the most (+0.16), and Thomas had the best average gain (9.32).

[continue reading…]

References

References
1 And note that using yards is not even the best way to show how valuable Gronk has been.  He’s responsible for 15.3% (!) of Brady’s career touchdowns.
{ 1 comment }

Top 100 QBs: 61-80, By Brad Oremland

Brad Oremland is a longtime commenter and a fellow football historian. Brad is also a senior NFL writer at Sports Central. There are few who have given as much thought to the history of quarterbacks and quarterback ranking systems as Brad has over the years. What follows is Brad’s latest work on quarterback statistical production.


Top 100 QBs: 61-80

This is part two of a seven-part series. It is a supplement to my series on the greatest quarterbacks of all time, last year’s article on the top-ranked QBs in Total Statistical Production, and last month’s post about QB-TSP in the 2017 season and another way of using TSP. I strongly encourage you to read those pieces if you haven’t done so already. You might also be interested in part one of this series, published last week.

In this series, I’ll present the top 100 pro football quarterbacks as ranked by QB-TSP. This is a purely statistical ranking, with all the drawbacks that entails, and in many places it is not reflective of my subjective evaluations. Each week, we’ll examine 20 players, continuing this week with ranks 61-80. As a quick refresher/update, here are rough explanations of single-season TSP: [continue reading…]

{ 0 comments }

What a spicy hot take of a headline, I know.  Continuing on yesterday’s theme, let’s talk more about at Joe Flacco’s career with the Ravens. He has a career Adjusted Net Yards per Attempt average of 5.64, which is not very good. In fact, it’s pretty bad: the average ANY/A over the last 10 years was 5.94, when you weight the average in each season by the percentage of Flacco’s career attempts that came in that season.  Flacco, therefore, has a career Relative ANY/A of -0.29 (difference due to rounding), which you can see below:

Here’s the other interesting thing about this: Flacco has 5,608 pass attempts/sacks with the Ravens, the 12th-most dropbacks of any quarterback with one team since 1970. And as you can probably guess, Flacco is the only one with a negative RANY/A. You have to go to Drew Bledsoe with the Patriots (4780 dropbacks, -0.02 RANY/A) to find the next quarterback with a negative RANY/A with one team and a lot of playing time. And after Bledsoe — who barely qualifies — you have to go down to Randall Cunningham with the Eagles, who had 3784 dropbacks and a -0.37 RANY/A. [continue reading…]

{ 0 comments }

Joe Flacco’s Career, A Revised Graphic Novel

My favorite measure of quarterback play is Adjusted Net Yards per Attempt. For new readers, ANY/A is simply yards per attempt, but it includes sacks (both in the denominator and with those yards lost deducted from the numerator) and adjustments for touchdowns (20-yard bonus) and interceptions (45-yard penalty).

Midway through the 2016 season, I looked at Joe Flacco’s ANY/A average in every game of his career.  I want to update that post today.  The graph below shows Flacco’s trailing ten game ANY/A over each ten-game block of his career (excluding the postseason).  His best stretch was from games 4 through 13 of the 2013 season, where his average ANY/A over those ten games (taking an average of the averages) was 7.92.   His worst T10G ANY/A was 3.74, covering the final three games of 2016 and the first seven games of 2017.

Perhaps most importantly, I included a black line representing the league average for each of these trailing ten games.  The black line represents the NFL average ANY/A for that season, but it combines averages when crossing seasons (so the T10G ANY/A at week 5 of 2017 is 50% of the NFL 2017 ANY/A average and 50% of the NFL 2016 ANY/A average).

Okay, that’s a lot of fine print.  In short: the purple line is how good Flacco’s been over a stretch of ten games; the black line is average.  He’s below-average a lot lately: [continue reading…]

{ 0 comments }

Top 100 QBs: 81-100, By Brad Oremland

Brad Oremland is a longtime commenter and a fellow football historian. Brad is also a senior NFL writer at Sports Central. There are few who have given as much thought to the history of quarterbacks and quarterback ranking systems as Brad has over the years. What follows is Brad’s latest work on quarterback statistical production.


This is part one of a seven-part series. It is a supplement to my 2015 series on the greatest quarterbacks of all time, last year’s article on the top-ranked QBs in Total Statistical Production, and last week’s post about QB-TSP in the 2017 season and another way of using TSP. I strongly encourage you to read those pieces if you haven’t done so previously.

In this series, I’ll present the top 100 pro football quarterbacks as ranked by QB-TSP. This is a purely statistical ranking, with all the drawbacks that entails, and in many places it is not reflective of my subjective evaluations. For each of the next five Wednesdays, we’ll examine 20 players, starting this week with ranks 81-100. For each player, you’ll find data presented in this form:

[rank]. Player Name — Adjusted TSP — Career Value — Top 10s – Top 10 Points – Year-Points

These statistical categories are explained in the links above; again, if you haven’t read them recently, I’d encourage you to do so. TSP and Career Value are calculated the same way as I indicated last year, except that I have indeed switched to a ^1.85 modifier, which reduces the impact of exceptional seasons and blunts the ranking of one-year wonders. As a quick refresher/update, here are rough explanations of single-season TSP: [continue reading…]

{ 0 comments }

Brad Oremland is a longtime commenter and a fellow football historian. Brad is also a senior NFL writer at Sports Central. There are few who have given as much thought to the history of quarterbacks and quarterback ranking systems as Brad has over the years. What follows is Brad’s latest work on quarterback statistical production.


Best Statistical QBs of 2017

This is the third time in the last four years that I’ve written about my preferred stat for evaluating NFL quarterbacks, QB-TSP. In this post, you’ll find scores from the 2017 season, plus another way of using TSP.

If you’re not already familiar with the stat, I’d encourage you to read about how it works, but if you’re in a hurry, it is a purely statistical ranking, not my opinion. TSP measures production above replacement level, with “replacement level” defined as the level of play you’d expect from an available free agent (not your top backup). A good example last season was Jay Cutler, lured from retirement to play for Miami after Ryan Tannehill got hurt. Robert Griffin and Johnny Manziel didn’t play last season, but either one would have been a replacement player, as would an undrafted college senior. Anyone who you’re not sure whether or not they were still on a roster, like Kellen Clemens or Kellen Moore, is probably right around replacement level.

Here are rough explanations of single-season TSP and how it translates to Career Value:

* Zero TSP (0 CV) indicates replacement-level performance, on the fringe of being playable. 2017 example: Trevor Siemian.

* 500 TSP (0.3 CV) is an inconsequential season, an ineffective starter or a good part-time player. 2017 examples: Jacoby Brissett, Aaron Rodgers.

* 1000 TSP (1 CV) is an average season. The player had some value to his team, but he wasn’t a Pro Bowl-quality performer. 2017 examples: Blake Bortles, Dak Prescott.

* 1500 TSP (2 CV) is a good season, a top-10 season, a borderline Pro Bowl season. This is a positive contribution to any player’s résumé. 2017 examples: Ben Roethlisberger, Matthew Stafford.

* 2000 TSP (3.5 CV) is a great season. It’s a top-5 performance, the player almost always makes the Pro Bowl, and he’ll usually generate some all-pro support. 2017 examples: Alex Smith, Tom Brady.

* 2500 TSP (5.5 CV) is an exceptional season. These only occur about twice every three years. Most of them were first-team All-Pro, and about half were named league MVP. 2017 example: none. Matt Ryan in 2016 scored at this level, though.

* 3000 TSP (7.5 CV) is a legendary season, and the player always wins MVP. There have only been seven, the most recent being Peyton Manning in 2013 and Tom Brady in 2007.

I’ll begin with raw data: QB-TSP for the top 40 in passing yards from the 2017 NFL season. The era-adjusted score, in the final column, is the one that aligns to the categories above. [continue reading…]

{ 1 comment }

Jared Goff Is The Exception

Whether it’s Mitchell Trubisky or Deshone Kizer or well, any rookie quarterback in the foreseeable future that underwhelms, the new theory for optimism is “Well look at how lost Jared Goff was as a rookie!” There is no doubt that Goff was terrible as a rookie and it’s equally true that he was excellent as a sophomore. Goff pulled off a remarkable worst-to-first campaign, ranking last in ANY/A in 2016 and then first in ANY/A in 2017. He increased his ANY/A average by 4.90, the greatest year-over-year increase in NFL history. That is why he is the exception.

I looked at all quarterbacks who (1) were 24 or younger during their rookie season, (2) threw at least 150 passes as a rookie, (3) threw at least 150 passes in their second year, and (4) entered the league in 1969 (when we first have sack data) or later. This naturally biases results in favor of second-year passers who improve, as quarterbacks who struggle as a rookie and then struggle in year two may not hit the 150-pass attempt threshold. Regardless, Goff’s improvement was truly remarkable. He finished 3.39 below league average in ANY/A in 2016 and then 1.82 above ANY/A in 2017. The graph below shows all passers who met the four criteria above. On the X-Axis, their Relative ANY/A as a rookies; on the Y-Axis, their Relative ANY/A as second-year players. A quarterback who is bad as a rookie and good as a sophomore would therefore be on the upper left quadrant of the chart, which is precisely where Goff (shaded in red) sits: [continue reading…]

{ 1 comment }

As we expected, five quarterbacks were selected in the first round of the 2018 Draft.

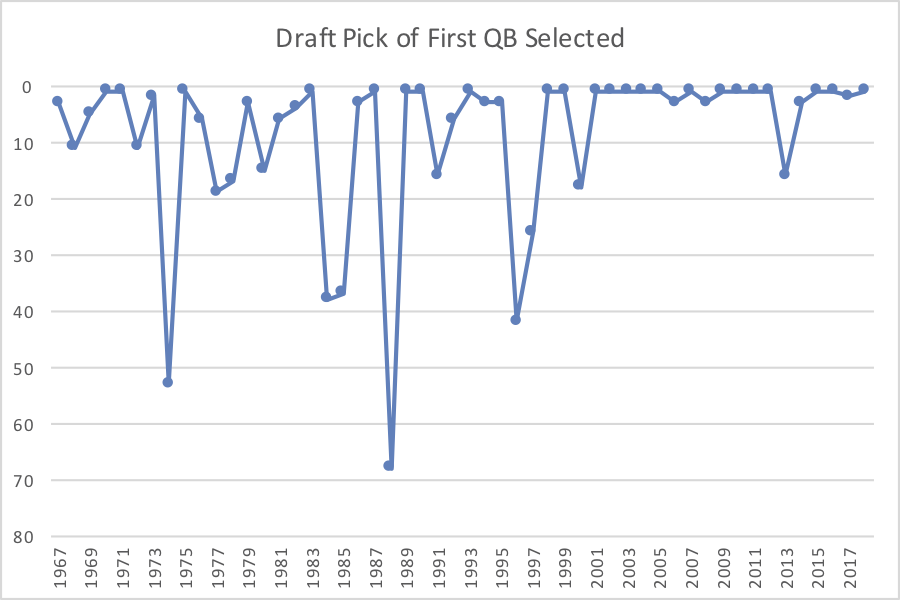
Where does the first QB go in the average draft? What about the fifth? Let’s investigate, by looking at all drafts since the first modern draft in 1967.

The first quarterback, on average, was selected with the 9th overall pick from 1967 to 2017.  But that’s heavily skewed: the median selection from ’67 to ’17 was the 3rd overall pick, and the modal selection was the first overall pick (22 times, and now 23).

The graph below shows where the first quarterback was drafted in each draft since 1967:

[continue reading…]

{ 0 comments }

In December 2008, I wrote about the wonderful rookie seasons that Matt Ryan and, to a lesser extent, Joe Flacco, were having. I concluded that Ryan might very well finish with the greatest rookie season of all time. The only two rookie seasons (excluding “rookie” seasons that did not come immediately following the player’s final collegiate season) that came close since the merger were Dan Marino in 1984 and Ben Roethlisberger in 2004, and Ryan had them both beat on quantity (Marino started just 9 games, while Roethlisberger played for the most run-heavy team in the league).

Then, 2012 happened, when Russell Wilson, Andrew Luck, and RG3 all had great rookie seasons. Luck took a team from 2-14 to 11-5, set a rookie record for passing yards that still stands, and led the NFL with seven game-winning drives. He also was arguably the least-impressive of the trio. Griffin led the NFL in yards per attempt and in yards per carry. Wait just re-read that sentence again and let it sink in how remarkable that is. And then there was Wilson, who posted a 100.0 passer rating, led Seattle to an 11-5 record, and set a still-standing rookie record with 30 touchdowns.

In 2016, Dak Prescott basically out-Ryan’ed Ryan. His team went 13-3, Prescott set a rookie record with a 104.9 passer rating and 7.86 ANY/A. He had a 23/4 TD/INT ratio while also ranking 4th in NY/A.

And then last season, Deshaun Watson took the league by storm over seven games. Yes, it was only 7 games, but he produced 21 touchdowns and averaged 8.3 yards per attempt and a 103.0 passer rating. He also averaged 7.5 yards per carry and was certainly gearing up to be in the discussion for greatest rookie seasons in quarterback history.

[continue reading…]

{ 1 comment }

Will The Giants Draft a QB?

If you squint, you can see it. New York lost Odell Beckham and Brandon Marshall for the season before the team even won its first game. Both players will be back, along with 24-year-old Sterling Shepard and not-yet-24-year-old Evan Engram. The Giants also signed Cody Latimer and added a quality left tackle in veteran Nate Solder. New York made the playoffs two years ago, and while Eli Manning had one of the worst seasons of his career in 2017, you can see a high-level functioning offense with new head coach Pat Shurmur, new OC Mike Shula, Manning, Beckham/Marshall/Shephard/Engram, and rookie RB Saquon Barkley.

But I’d be floored if the Giants took a RB with the second overall pick. In my opinion, New York is going to trade the second pick for a king’s ransom or draft a quarterback.  And it’s because the Giants have an aging, below-average quarterback as their QB1, and that’s true even though his name is Manning.

Even if you ignored 2017 due to all of the injuries the Giants offense experienced, it’s not like there would be a lot of reason for optimism about how well Manning would play into his late 30s.  Why’s that?

1) At age 35 in 2016, Manning was below-average, ranking 22nd out of 31 qualifying passers in ANY/A.

2) Manning was born on January 3rd, making him “old for his age” if you know what I mean. Had Manning been born four days earlier, he would have been considered 36 in 2016, 37 in 2017, and 38 this season.

3) Even if you give Manning the benefit of the doubt and ignore his 2017 performance and the fact that he’s old for his age, we wouldn’t expect a below-average QB at age 35 to be average at age 37, much less average at age 38 or 39. You would expect a QB to lose about 0.5 ANY/A from age 35 to age 37, and it’s not like Manning started from a very high porch.

Since Manning didn’t have much left to lose, the effects of age will likely hit him hard. The graph below shows Manning’s RANY/A — i.e., his Relative ANY/A, which is just ANY/A minus league average ANY/A — for each year of his career.  He had sustained regular season success for a five-year period from 2008 to 2012, and another mini-peak in 2014 and 2015, but the graph doesn’t pain the picture of a quarterback who will be a difference maker in 2018 or 2019 as his physical skills decline. [continue reading…]

{ 0 comments }

Jimmy Garoppolo just signed a 5 year, $137.5M contract with the 49ers, and $74M of that contract is guaranteed (with a total average annual salary of $27.5M).  Next month, Kirk Cousins is going to sign an even more massive contract. In addition to the 49ers and the team that signs Cousins, there are 12 teams that have quarterbacks with 2018 salary cap values in excess of $20M: [continue reading…]

{ 6 comments }

Guest Post: Adam Steele on Quarterback MVP Shares

Adam Steele is back for another guest post. You can view all of Adam’s posts here. As always, we thank him for contributing.


In this post, I will attempt to estimate how many MVP awards each QB has “deserved” over the course of his career. I wanted to accomplish this task using very basic statistics, so the only inputs are pass attempts, passing yards, and TD passes. I can’t stress enough that this is aimed at providing rough estimates and not definitive answers.

Methodology

The metric I will use for this study is my own creation, Positive Yards Per Attempt (PY/A). I chose this over ANY/A for several reasons:

  • It is available back to the early days of the NFL, whereas ANY/A only goes back to 1969; I prefer to employ a uniform measurement for players of every era.
  • Sacks (invalid) and interceptions (unstable and invalid) are poor measures of QB performance, while Y/A and TD% are both statistically valid. (Proof)
  • If I used ANY/A, a number of unworthy seasons would appear MVP caliber due to fluky INT rates (looking at you, Damon Huard).
  • MVP voters typically focus on yards, TD passes, and wins (shame on them), but largely ignore interceptions and sacks.

With my justifications out of the way, let’s get to the actual formula:

  1. PY/A = (Passing Yards + TD Passes *20) / Attempts.
  2. Each QB season is compared to league average, giving us Relative PY/A (RPY/A). At this juncture, all seasons below +1 RPY/A are discarded, as I consider that the minimum baseline for a great season.
  3. I don’t want anyone receiving MVP Shares for lighting it in limited action (Todd Collins in 2007, for example), so I added a minimum threshold for attempts in a season. From 1978-present, the minimum is 300 attempts, and from 1950-1977 the minimum is 200 attempts. I purposely did not prorate 1982 and 1987 because I don’t think MVP awards in shortened seasons should be worth as much as full seasons.
  4. I excluded the AFL and AAFC because those leagues had watered down competition, and also because I’m lazy. Seasons before 1950 are excluded for the same reasons.
  5. I want to emphasize QB’s who play all or most of a season, which is accomplished by subtracting the minimum baseline from each QB’s attempts in a season. For example, a modern QB who attempts 525 passes in a given year will have his attempts adjusted down to 225 (525-300). This ensures that a QB who plays excellently over 2/3 of a season doesn’t get too much credit, but still gets some (such as Kurt Warner in 2000).
  6. RPY/A is multiplied by adjusted pass attempts to calculate MVP Value.
  7. League MVP Value is summed in each season, and each quarterback’s MVP Value is divided by the league total. This is his MVP Share. The divisor is capped at 500 and floored at 200, which results in some seasons producing more or less than one MVP Share. This last modifier was necessary due to vast discrepancies in yearly MVP Value totals, as I don’t want historically great seasons penalized too much for occurring within a loaded field (such as 2011 or 1976). The 68 seasons from 1950-2017 produced a grand total of 60.2 MVP Shares, which feels quite reasonable (we can pretend the other 7.8 MVP awards went to non-quarterbacks).

Here are the top 100 MVP Share seasons since 1950:

QuarterbackYearTeamAttYardsTDPY/ALgPY/ARPY/AMVPValMVPShare
Steve Young1994SFO46139693510.137.542.59256.01.00
Dan Marino1984MIA56450844810.727.972.75462.00.92
Steve Young1993SFO4624023299.967.402.56252.70.90
Peyton Manning2004IND49745574911.147.943.20433.40.87
Matt Ryan2016ATL53449443810.688.012.67390.80.85
Aaron Rodgers2011GNB50246434511.048.052.99402.00.80
Kurt Warner2001STL54648303610.167.542.62398.50.80
Boomer Esiason1988CIN38835722810.657.702.95171.60.77
Lynn Dickey1983GNB48444583210.538.042.49274.20.76
Y.A. Tittle1963NYG36731453610.538.621.9161.00.31
Tom Brady2007NWE57848065010.047.692.35375.30.75
Earl Morrall1968BAL31729092610.828.032.7930.40.11
Joe Namath1972NYJ3242816199.867.692.1728.10.14
Kurt Warner1999STL49943534110.377.542.83364.20.73
Peyton Manning2013DEN6595477559.988.001.98351.80.70
Brett Favre1995GNB5704413389.087.561.52140.40.70
Johnny Unitas1964BAL30528241910.508.182.326.60.03
Fran Tarkenton1967NYG3773088299.737.911.8263.10.30
Sonny Jurgensen1961PHI41637233210.498.571.92106.70.35
Steve Young1992SFO4023465259.867.632.23125.50.63
Philip Rivers2008SDG4784009349.817.722.09194.00.59
Ken Anderson1975CIN3773169219.527.522.0077.00.25
Bert Jones1976BAL34331042410.457.443.0186.40.17
Craig Morton1969DAL30226192110.067.962.102.20.01
Norm Van Brocklin1954RAM26026371311.148.292.85-74.0-0.37
Dan Fouts1985SDG4303638279.727.861.86111.80.56
Daunte Culpepper2004MIN54847173910.037.942.09270.30.54
Carson Palmer2015ARI53746713510.008.171.83196.70.54
Roger Staubach1973DAL28624282310.107.422.68-23.5-0.09
Ken Stabler1976OAK29127372711.267.443.82-25.4-0.05
Tom Brady2011NWE6115235399.848.051.79245.70.49
Drew Brees2011NOR6575476469.748.051.69246.30.49
Jim Kelly1991BUF4743844339.507.611.89154.90.49
Philip Rivers2010SDG5414710309.827.871.95229.00.48
Joe Montana1989SFO38635212610.477.952.52130.70.48
Boomer Esiason1986CIN4693959249.467.781.68114.90.47
Aaron Rodgers2014GNB5204381389.898.101.79173.80.47
Mark Rypien1991WAS4213564289.807.612.19144.00.45
Drew Brees2009NOR5144388349.867.812.05224.70.45
Peyton Manning2005IND4533747289.517.561.95145.40.45
Warren Moon1990HOU5844689339.167.841.3290.90.45
Terry Bradshaw1977PIT3142523179.127.281.8411.80.05
Johnny Unitas1965BAL28225302310.608.532.07-19.3-0.10
Vinny Testaverde1996BAL5494177338.817.461.3587.20.44
John Brodie1970SFO3782941249.057.561.4938.20.19
Brett Favre1997GNB5133867358.907.461.4493.70.43
Norm Van Brocklin1960PHI28424712410.398.242.15-18.4-0.08
Daunte Culpepper2000MIN4743937339.707.522.18205.30.41
Philip Rivers2009SDG4864254289.917.812.10204.60.41
Randall Cunningham1998MIN42537043410.327.692.63203.80.41
Jim Everett1989RAM5184310299.447.951.49106.80.39
Ken Stabler1974OAK3102469269.647.242.4014.00.03
Peyton Manning2012DEN5834659379.267.921.3496.20.38
Trent Green2002KAN4703690268.967.511.4576.50.38
Peyton Manning2006IND5574397319.017.641.3795.10.36
Tony Romo2014DAL43537053410.088.101.98132.30.36
Otto Graham1953CLE25827221111.407.473.93-123.1-0.26
Tony Romo2007DAL5204211369.487.691.79173.80.35
Milt Plum1960CLE25022972110.878.242.63-81.5-0.35
Drew Brees2008NOR6355069349.057.721.33110.60.34
Don Meredith1966DAL3442805249.557.811.7432.60.10
Johnny Unitas1957BAL30125502410.078.401.670.70.00
Y.A. Tittle1962NYG37532243310.368.981.3828.50.14
Steve Young1998SFO5174170369.467.691.77167.10.33
Dan Marino1986MIA6234746449.037.781.2580.80.33
Steve McNair2003TEN4003215249.247.421.8282.00.32
Terry Bradshaw1978PIT3682915289.447.501.9463.90.32
Ben Roethlisberger2009PIT5064328269.587.811.77158.60.32
Ken Anderson1974CIN3282667189.237.241.9927.70.07
Len Dawson1971KAN3012504159.327.531.790.80.00
Johnny Unitas1959BAL3672899329.648.291.3523.50.12
Greg Landry1971DET2612237169.807.532.27-49.5-0.19
Craig Morton1981DEN3763195219.617.851.7657.80.29
Norm Snead1967PHI4343399299.177.911.2634.80.16
Steve Young1997SFO3563029199.587.462.1262.70.29
Frank Ryan1966CLE3822974299.307.811.4940.20.13
Russell Wilson2015SEA4834024349.748.171.57104.30.28
Aaron Rodgers2012GNB5524295399.197.921.2768.00.27
Terry Bradshaw1979PIT4723724268.997.681.3153.30.27
Vince Ferragamo1980RAM4043199309.407.881.5254.10.27
Drew Brees2006NOR5544418268.917.641.2768.60.26
Steve Beuerlein1999CAR5714436369.037.541.49132.80.27
Norm Van Brocklin1950RAM23320611810.397.792.60-107.2-0.54
Jared Goff2017RAM4773804289.157.851.3053.10.27
Steve Grogan1979NWE4233286289.097.681.4150.40.25
Dan Fouts1978SDG3812999249.137.501.6351.00.26
Otto Graham1951CLE2652205179.607.841.76-26.6-0.13
Boomer Esiason1985CIN4313443279.247.861.3849.80.25
Roger Staubach1978DAL4133190258.937.501.4348.60.24
Bob Griese1977MIA3072252228.777.281.493.40.02
Kurt Warner2000STL34734292111.097.523.57120.80.24
Aaron Rodgers2009GNB5414434309.307.811.49118.10.24
Joe Ferguson1975BUF3212426259.127.521.6012.60.04
Fran Tarkenton1964MIN3062506229.638.181.452.70.01
Billy Wade1958RAM3412875189.498.161.3313.50.07
John Hadl1973RAM2582008229.497.422.07-44.9-0.17
Roger Staubach1979DAL4613586278.957.681.2743.50.22
Norm Van Brocklin1953RAM2862393199.707.472.23-17.2-0.04
Bobby Thomason1953PHI3042462219.487.472.014.00.01
Donovan McNabb2004PHI4693875319.587.941.64108.20.22

And now the MVP Share career list (the Seasons column represents the number of different seasons each QB received more than zero MVP Shares):

QuarterbackMVPShareSeasons
Peyton Manning3.5711
Steve Young3.156
Johnny Unitas2.146
Aaron Rodgers2.005
Drew Brees1.968
Tom Brady1.927
Brett Favre1.808
Kurt Warner1.794
Philip Rivers1.684
Boomer Esiason1.504
Norm Van Brocklin1.506
Dan Fouts1.446
Y.A. Tittle1.354
Ken Stabler1.305
Dan Marino1.293
Daunte Culpepper1.163
Terry Bradshaw1.165
Roger Staubach1.135
Tony Romo1.126
Ken Anderson1.105
Fran Tarkenton1.084
Craig Morton1.024
Carson Palmer0.864
Joe Montana0.853
Matt Ryan0.851
Lynn Dickey0.812
Joe Namath0.782
Jim Kelly0.773
Sonny Jurgensen0.762
Earl Morrall0.742
Trent Green0.744
Otto Graham0.734
Bob Griese0.715
Ben Roethlisberger0.645
John Brodie0.592
Bert Jones0.571
Jim Everett0.562
Vinny Testaverde0.542
Russell Wilson0.523
Don Meredith0.502
Greg Landry0.463
Mark Rypien0.451
Warren Moon0.451
Billy Wade0.432
Randall Cunningham0.411
Steve McNair0.382
Frank Ryan0.362
Milt Plum0.351
Donovan McNabb0.333
Steve Grogan0.313
Len Dawson0.301
Norm Snead0.291
John Hadl0.282
Steve Beuerlein0.282
Chris Chandler0.274
Vince Ferragamo0.271
Jared Goff0.261
Eli Manning0.252
Jeff George0.252
Bart Starr0.242
Joe Ferguson0.241
Bobby Layne0.233
Matt Schaub0.232
Bill Nelson0.222
Bobby Thomason0.221
Chad Pennington0.201
Alex Smith0.181
George Ratterman0.171
Jake Delhomme0.171
Tommy Kramer0.171
Matt Hasselbeck0.162
Bob Berry0.142
Jay Schroeder0.141
Joe Theismann0.141
Neil Lomax0.141
Andy Dalton0.131
Ken O'Brien0.121
Rudy Bukich0.121
Jeff Garcia0.111
Ron Jaworski0.111
Carson Wentz0.101
Charley Johnson0.101
Danny White0.091
Robert Griffin0.091
Steve Bartkowski0.091
Troy Aikman0.091
Mark Brunell0.081
Wade Wilson0.071
Chris Miller0.061
Elvis Grbac0.061
Matthew Stafford0.061
Michael Vick0.061
Mike Livingston0.061
Nick Foles0.061
Billy Kilmer0.052
Brian Griese0.052
Jim Harbaugh0.051
John Elway0.051
Adrian Burk0.041
Bobby Hebert0.041
Brad Johnson0.041
Dave Krieg0.042
Marc Bulger0.041
Richard Todd0.041
Bernie Kosar0.031
Jim Hart0.031
Tommy Maddox0.031
Bob Lee0.021
David Garrard0.011
Doug Flutie0.011
Steve Spurrier0.011
Jeff Hostetler0.001

I’ll leave the commentary up to you guys!

{ 37 comments }

Something Is Wrong With Cam Newton

It doesn’t take an expert to realize that something is wrong with Cam Newton. Whether the cumulative effects of the various injuries he has suffered throughout his career have taken a toll on him, or there’s a specific injury causing a problem, it’s now clear that Newton is a shell of his former self.  In Newton’s last 16 games, he’s thrown just 16 touchdown passes… while throwing 16 interceptions.  In Newton’s MVP season of 2015, he averaged more than two passing touchdowns per game, and just over half an interception per game.  The Panthers scored just 9 points against the Bills last week, but the bottom fell out yesterday.

Facing what had been a historically bad Saints defense, Newton produced the single-worst game of his career:  He threw 26 passes but gained just 167 yards, while taking four sacks and losing 28 yards.  That’s an ugly 4.6 NY/A, but it gets much worse when you realize he had no touchdowns and three interceptions.  That translates to a 0.13 ANY/A average, the worst statistical performance of Newton’s career. Again: this came against the Saints.

This game also dropped Newton’s ANY/A over his last 16 games to below 5.00.  That’s right: over Newton’s last 16 games, he has the following stat line: 279/520 (54%), 3,528 yards (6.8 Y/A), 16 TDs, 16 INTs, 42 sacks for 337 yards, and 4.97 ANY/A. The graph below shows Newton’s single game ANY/A (in blue) and trailing 16 game ANY/A (in black) for each game of his career (playoffs excluded): [continue reading…]

{ 14 comments }

In 1998, Randall Cunningham may have been the best quarterback in football.  Cunningham was 35.4 years old as of September 1st of that season. If it wasn’t Cunningham, it was probably Vinny Testaverde (34.8 years old as of 9/1/98), or  Steve Young (36.9), or Chris Chandler (32.9), or John Elway (38.2).  Troy Aikman (31.8) and Doug Flutie (35.9) also had great seasons, three other quarterbacks — Dan Marino (37.0),  Steve Beuerlein (33.5), and Rich Gannon (32.7) — finished in the top 20 in passing yards.

That means 10 of the top 20 quarterbacks in passing yards in 1998 were 31.8 years old or older as of September 1st of that year.    Thirteen years later, things were very different, as 8 of the top 16 passers in 2011 by passing yards were under 28 years old as of September 1st, with four being under 25: Cam Newton (22.3), Matthew Stafford (23.6), Josh Freeman (23.6), Andy Dalton (23.8), Mark Sanchez (24.8), Matt Ryan (26.3), Joe Flacco (26.6), and Aaron Rodgers (27.7).

I calculated the average age of quarterbacks in the NFL for each season since 1950, using the methodology described here. The short version: calculate what percentage of league-wide passing yards was produced by each player, calculate that player’s age as of September 1st of that season, and that calculate the league-wide age of all passers, weighted by their percentage of league passing yards. The results below: [continue reading…]

{ 10 comments }

Stafford wins the prize for most mega contracts signed by a quarterback in his 20s

Four years ago, I wrote about Matthew Stafford and his poor record. At the time, his career mark stood at 17-28 and he had just received a big money extension. In that piece, I noted that his career record was not predictive of much. Well, four years later, and Stafford just received another big money extension. And over the last four years, Stafford has gone 34-30. That’s not great, but it’s not bad, either.

But what’s notable about the Lions offense over the last four years is how reliant on Stafford the team has been. Since 2013, no team has rushed for fewer yards than Detroit, and the Lions also rank 30th in yards per carry. The Detroit offense goes as Stafford goes, and while the former number one pick hasn’t been the best quarterback in the NFL, he’s been pretty valuable.

Stafford became the youngest player to join the 30,000 yard club, which is a function of (1) how young he was when he entered the league, (2) the era he plays in, (3) the pass-happy offenses he has led, and (4) his talent/ability. Stafford played with Knowshon Moreno at Georgia and both were drafted in the first round of 2009. Steve Young didn’t make his first Pro Bowl until his age 31 season. Warren Moon didn’t make his first Pro Bowl under age 32. [continue reading…]

{ 18 comments }

Passing TD Concentration Index (By Receiver)

Fran Tarkenton threw 342 touchdowns in his career, but you may be surprised to learn that he didn’t throw more than 25 touchdowns to a single player! He played with John Gilliam from ’72 to ’75, and Gilliam caught 25 touchdowns during those four seasons before signing with Atlanta in 1976.  Tarkenton played with receiver Sammy White during the final three seasons of Tarkenton’s career, from ’76 to ’78, and the duo connected for 24 touchdowns.  And Tarkenton threw 23 touchdowns to Hall of Very Good running back Chuck Foreman.  While with the Giants, Tarkenton also threw 20 touchdowns to Homer Jones; those were the only four players to catch 20 touchdowns from Tarkenton.

A couple of months ago, I discussed the concentration index as a way to measure how concentrated certain statistics are.  We can do that same thing to measure quarterbacks and receivers to see which players had the most varied passing games.  This will be skewed, of course, in favor of quarterbacks who played for multiple teams, but that’s arguably a feature and not a bug.

Below are the results for the quarterbacks with at least 100 touchdown passes: [continue reading…]

{ 13 comments }

Today’s guest post comes from hscer, a frequent commenter here at Football Perspective. Hscer is starting a project on his website, MVPQB.Blogspot.com, where he is working on his most valuable quarterback for each season since 1951. Here’s a sample chapter today: as always, we thank our guest posters for their contributions.


 “When .500 is a Miracle” – The Giants trade a number of picks for Fran Tarkenton and immediately go from a one-win team to a .500 club.

The Stats

Unitas (AP1): 255-436 (58.5%) 3428 yards (7.86 y/a) 20 TD 16 INT, 83.6 rating, 7.13 AY/A, 11-1-2 record in starts (4 4QC, 3 GWD). Rushing: 89 yards on 22 attempts (4.0 avg.), 0 TD, 4 fumbles.

Tarkenton (MVQB): 204-377 (54.1%) 3088 yards (8.19 y/a) 29 TD 19 INT, 85.9 rating, 7.46 AY/A, 7-7 record in starts (2 4QC, 2 GWD). Rushing: 306 yards on 44 attempts (7.0 avg.), 2 TD, 4 fumbles.

The Argument

For older selections, I’ve often deferred to the AP when they pass over a quarterback on a weaker team to give their All-Pro nod to an established star on a great squad. I won’t do that here.

The 1966 Giants went 1-12-1. Much of that was due to a putrid defense which allowed 501 points, many of them in an infamous 72-41 loss to the Redskins. But the offense could not be absolved from blame. Gary Wood, Earl Morrall, and Tom Kennedy split time at quarterback, and no rusher exceeded 327 yards. As a result, New York was 12th in the 15-team NFL with 263 points scored, and 8th in yards. Just two seasons later, Morrall would be putting up Unitas-like numbers on Unitas’ own team.

In ’66, New York’s top 5 pass receivers were Homer Jones, Joe Morrison, Aaron Thomas, Chuck Mercein, and Bobby Crespino. In ’67, they were Thomas, Jones, Morrison, Ernie Koy, and Tucker Frederickson, the last two of which were also on the ’66 squad. Four starting offensive linemen returned, and the only new one was 1966 eighth-round pick RT Charlie Harper. [continue reading…]

{ 9 comments }

Today’s guest post comes from hscer, a frequent commenter here at Football Perspective. Hscer is starting a project on his website, MVPQB.Blogspot.com, where he is working on his most valuable quarterback for each season since 1951. Here’s a sample chapter today: as always, we thank our guest posters for their contributions.


“Say What?” – Was Ken O’Brien really better than Dan Marino at any point in time? For one season, he at least had an argument.

The Stats

Marino (AP1): 336-567 (59.3%) 4137 yards (7.30 y/a) 30 TD 21 INT, 84.1 rating, sacked 18-157, 6.21 ANY/A, 12-4 record in starts (4 4QB, 6 GWD). Rushing: -24 yards on 26 attempts (-0.9 avg.), 0 TD, 9 fumbles.

O’Brien (MVQB): 297-488 (60.9%) 3888 yards (7.97 y/a) 25 TD 8 INT, 96.2 rating, sacked 62-399, 6.60 ANY/A, 11-5 record in starts (1 4QC, 1 GWD). Rushing: 58 yards on 25 attempts (2.3 avg., 0 TD, 14 fumbles.

The Argument

Yes, really. Even though Ken O’Brien took far too many sacks in ’85—62 to be exact, losing 399 yards—when he got the ball off, he was better than Marino. Even when he didn’t, his passing edge was large enough to secure a higher ANY/A than The Man in Miami. Dan Fouts was another reasonable selection despite missing four games by throwing for 3638 yards and 27 TD with a league-leading 7.02 ANY/A in the games he did play, but this year comes down to Marino and O’Brien.

Dan Marino was coming off of the greatest season an NFL quarterback has ever enjoyed in 1984, still the best ever in my opinion. This likely helped his cause. It didn’t help O’Brien’s cause that he had one of the ugliest season debuts you can imagine. In a 31-0 loss to the Raiders, he was 16-29 for 192 yards, 0 TD, 2 interceptions, and sacked a whopping 10 times for -61 yards, producing an adjusted net yards per attempt of 1.05. In the final 15 games, his ANY/A was 7.14, but the first game counts all the same. [continue reading…]

{ 17 comments }

Today’s guest post comes from hscer, a frequent commenter here at Football Perspective. Hscer is starting a project on his website, MVPQB.Blogspot.com, where he is working on his most valuable quarterback for each season since 1951. Here’s a sample chapter today: as always, we thank our guest posters for their contributions.


“When Fifth is First” – Maybe fifth is unkind to Gannon’s 2000 season, but he certainly wasn’t the best or even top three.

The Stats

Let’s begin with a look at the stats from six of the top quarterbacks from 2000: Rich Gannon, Peyton Manning, Daunte Culpepper, Kurt Warner, Jeff Garcia, and Brian Griese.

QuarterbackCmp-Att-(%)-YdY/ATDINTPassRtSk-SkYdANY/AW-L4Q/GWRshYd-Rsh-YPC-TDFumDYARDVOA
Gannon (AP1)284-473-(60.0%)-34307.25281192.428-1246.7312-43/4529-89-5.9-49105221.4
Manning (MVQB)357-571-(62.5%)-44137.73331594.720-1317.2210-62/3116-37-3.1-15188838.3
Culpepper297-474-(62.7%)-39378.3133169834-1817.2811-53/4470-89-5.3-711135230.1
Warner235-347-(67.7%)-34299.88211898.320-1157.978-31/217-18-0.9-0492328.0
Garcia355-561-(63.3%)-42787.63311097.624-1557.346-100/0414-72-5.8-47164231.8
Griese216-336-(64.3%)-26888194102.917-1397.797-30/1102-29-3.5-15106234.7

The Argument

Gannon’s win here is baffling when you look at the stats in this context: he ranks 5th in DYAR, and 6th in Y/A, ANY/A, Passer Rating, and DVOA. So why did the Associated Press, along with Pro Football Weekly / Pro Football Writers of America and The Sporting News select Gannon as their first-team All-Pro quarterback?

Well, four teams went 12-4 or better, including Gannon’s Raiders. The other three teams had Kerry Collins, Steve McNair, and the
Tony BanksTrent Dilfer combo at quarterback, and Gannon had the best numbers of that group. But even for media types, it usually takes a little more than wins to clinch these awards. McNair, with 2847 yards and 15 TD on the 13-3 defending AFC Champion Titans, was likely not considered by anyone. [continue reading…]

{ 30 comments }

Drew Brees didn’t get much of a headstart on his way to becoming the NFL’s all-time leader in passing yards. As you know, Peyton Manning is the current leader in that category, having retired with 71,940 passing yards.  Manning and Brees both entered the NFL at the age of 22, but Manning started 16 games as a rookie, while Brees played in just one game.  Young Manning was also a bit better than young Brees: that fact, combined with Manning’s 3,518-yard edge as rookies, and Brees missing 5 games at the age of 24 gave Manning a huge early lead.

Thru ages 26, 27, and 28, Manning had a lead of over 8,000 yards on Brees.  But beginning at age 29, Brees started to fight back.  Through age 34, Manning’s lead had dwindled to 3,747 passing yards, though they remain the only two players with over 50,000 passing yards through age 34.  Manning would miss all of his age 35 season with his neck injury, which allowed Brees to finally pass him and become the career leader in passing yards through age 35.

Since then? Well, Brees continues to match Manning, even putting up his own 5,000-yard season at age 37, which is what Brees was in 2016.  For Manning, age 37 was his last great season, age 38 was his last good season, and age 39 was his final year, where he threw for just 2,249 yards.  In other words, if Brees has made it this far, the tough stuff is done: exceeding Manning’s production through age 37 was the hard part.

The graph below shows each player’s career passing yards through X. It’s color-coded by team, showing Brees’ time with the Chargers and Saints, and Manning’s with the Colts and Broncos.  As you can see, Brees has had the edge on Manning over the last three seasons: [continue reading…]

{ 19 comments }

Kaepernick … tuning out the critics?

Yesterday, I wrote Colin Kaepernick was an extreme outlier in 2016 in terms of TD/INT ratio relative to his Net Yards per Attempt average.  Kaepernick ranked tied for 6th in TD/INT ratio, but was 2nd-to-last in NY/A.  At a high level, we have a good clue that the sparkling TD/INT ratio wasn’t as valuable as it seems: that’s because Kaepernick went 1-10 as a starter last year, and the one win came in a game where Kaepernick threw an interception! Now we all know that win-loss record isn’t a good way to judge quarterbacks, especially considering that Kaepernick played for a team that ranked last in points allowed and yards allowed. But the 49ers ranked 27th in points scored and 31st in yards gained, so it’s not as though the defense deserves all of the blame. Because while Kaepernick had a great TD/INT ratio, that disguises how ineffective the passing attack really was. [continue reading…]

{ 12 comments }
Next Posts Previous Posts