≡ Menu

Oakland is going to the playoffs, but the Raiders will do so without starting quarterback Derek Carr. The third-year quarterback had a breakout season, driven in large part by his ability to minimize bad plays: Carr leads the NFL with a 2.8% sack rate, and his 1.1% interception rate ranks 4th in the league. Oakland went 12-3 in games started by Carr, but after breaking his fibula in a win over the Colts, the Raiders are now turning to Matt McGloin to lead them in the postseason. [Update: With McGloin hurt, Connor Cook will now be making his first career NFL start in the playoffs, the first quarterback to do that since at least 1950.]

Oakland isn’t the only team switching quarterbacks as we enter January. Houston started massive bust Brock Osweiler for the first 14 games of the season, and were rewarded with the worst quarterback play in the NFL. The Texans turned to Tom Savage early in the Jaguars game last week; Savage led Houston to a come-from-behind victory to earn the starting job. He struggled against Cincinnati in his first start, but he’s going to be the guy in the playoffs despite starting just one or two games all year (Houston could, in theory, rest Savage this week, as the Texans are locked in to the 4 seed).

Finally, there are the Miami Dolphins. After years of “will he or won’t he?” play from Ryan Tannehill, the Dolphins are finally going to the playoffs…. but maybe without Tannehill. The perennially on-the-verge-of-breaking-out quarterback sprained his ACL and MCL against Arizona three weeks ago, leading his status for the playoffs in doubt. But backup Matt Moore led a game-winning drive against the Cardinals, excelled against the Jets, and was up-and-down in an overtime win against Buffalo on Sunday.

Assuming Moore starts in the playoffs, he’ll be the third quarterback this season to start a playoff game despite fewer than six regular season starts. Here’s every example in NFL history where that happened: [continue reading…]

{ 4 comments }

Joe Flacco’s Career, My Graphic Novel

My favorite measure of quarterback play is Adjusted Net Yards per Attempt. For new readers, ANY/A is simply yards per attempt, but it includes sacks (both in the denominator and with those yards lost deducted from the numerator) and adjustments for touchdowns (20-yard bonus) and interceptions (45-yard penalty).

I am going to use a modified version of that formula today, by basing my formula around yards per dropback rather than yards per attempt. The only difference? Spikes are discarded, scrambles (and yards gained on scrambles) are included, but those are both improvements to the formula.

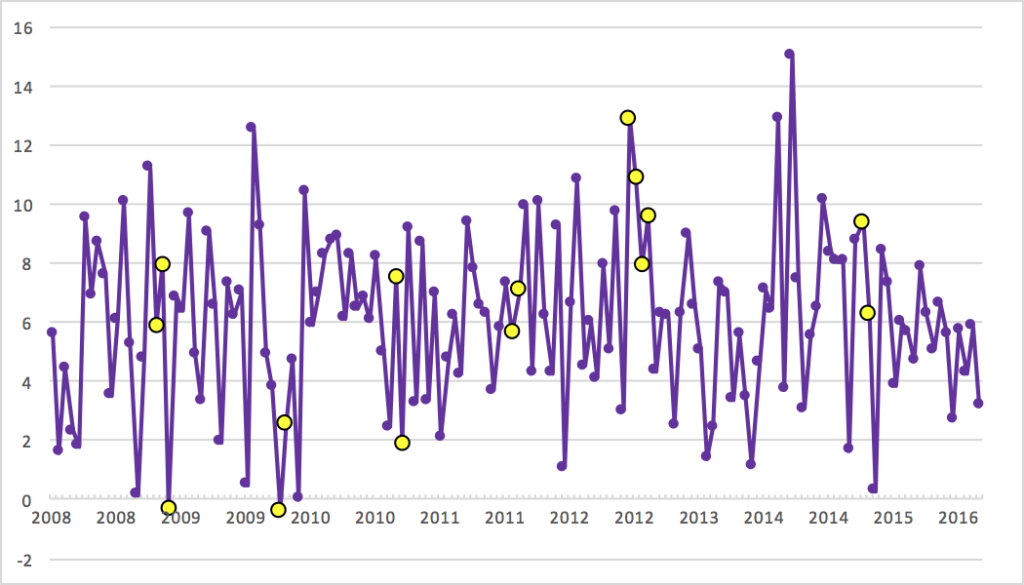
With that said, here is Joe Flacco‘s modified ANY/A average in every game of his career, plotted from his first game in week 1 of 2008 through week 7 of 2016.  I have made the data points that represent playoff games larger and in yellow.  The four dots next to each and relatively high on the graph represent, of course, his Super Bowl run in 2012.

flacco [continue reading…]

{ 9 comments }

Adam Steele is back for another guest post. You can view all of Adam’s posts here. As always, we thank him for contributing.


Previously, I introduced my new metric — Adjusted Points Per Drive — for measuring team offense. I thought it would be fun to apply the same methodology to quarterbacks, which I what I’m doing today. I highly encourage you to go back and read the previous post if you haven’t already, because I don’t want to clutter today’s post by repeating all of the calculation details.

Unfortunately, I don’t have drive stats for individual games, so there’s going to be some approximation here. To calculate a quarterback’s career Adjusted Points Per Drive (AjPPD), I simply take his team’s AjPPD from each of his playing seasons and weight those seasons by games started. This will give us a measure of a quarterback’s scoring efficiency, but it doesn’t account for volume or longevity. That’s where Adjusted Offensive Points (AjPts) comes in handy.

I assign each QB a portion of his teams’ Adjusted Points, then compare that to league average to calculate Points Over Average (POA). The formula for calculating a given season’s POA = (Tm AjPts – 315) * (GS / 16). The 315 figure is derived from multiplying my normalized baselines of 1.75 AjPPD by 180 drives per year, meaning the average team scores 315 Adjusted Points per season.

I’ll use Ben Roethlisberger’s 2015 season as an example: Pittsburgh scored 400 Adjusted Points and Ben started 11 games, so his 2015 campaign is worth (400 – 315) * (11 / 16) = 30 POA. Do this for every season and we have Career POA, which is the primary metric I’ll be using here. However, some people prefer to rank quarterbacks based on their peak years rather than their entire career, so I added the “Peak” column which is the sum of each quarterback’s three best POA seasons.

This study includes all QB’s who started their first game in 1997 or later, and made at least 40 starts between 1997 and 2015 (partial numbers from 2016 are not included). These criteria leaves us with 56 quarterbacks. Before we dig into the results, it’s worth noting that the correlation between Career POA and ANY/A+ is a healthy 0.92. We all know that the NFL is a passing league, but drive efficiency is even more dominated by the passing game than I thought. According to r2, 85% of the variance in Adjusted Points Per Drive is explained by a basic measure of passing efficiency. That doesn’t leave much room for the running game to have an impact. In fact, I’ll go as far to say that rushing efficiency has no appreciable impact on scoring for the majority of teams. That’s not to say running the ball is useless; offenses must run occasionally to keep the defense honest, and running comes in handy for converting short yardage and bleeding the clock. But, to quote Ron Jaworski, “Points come out of the passing game!”

Time for the rankings… [continue reading…]

{ 8 comments }

The 2010 Draft Class was not very good when it came to quarterbacks.  Take a look:

 
Rnd Pick Tm Player Pos Age To AP1 PB St CarAV DrAV G Cmp Att
Yds TD Int
1 1 STL Sam Bradford QB 22 2016 0 0 4 33 25 66 1444 2387 15509 82 52
3 85 CLE Colt McCoy QB 24 2015 0 0 2 12 10 34 508 842 5586 26 23
5 155 ARI John Skelton QB 22 2012 0 0 0 4 4 20 320 602 3707 15 25
2 48 CAR Jimmy Clausen QB 23 2015 0 0 1 3 0 22 255 472 2520 7 14
1 25 DEN Tim Tebow QB 23 2012 0 0 1 12 11 35 173 361 2422 17 9
6 176 TEN Rusty Smith QB 23 2012 0 0 0 1 1 3 23 45 234 0 4
4 122 PHI Mike Kafka QB 23 2011 0 0 0 0 0 4 11 16 107 0 2
6 204 CAR Tony Pike QB 24 2010 0 0 0 0 0 1 6 12 47 0 0
7 209 BUF Levi Brown QB 23 2010 0 0 0 0 0 1 2 3 24 0 1
5 168 SDG Jonathan Crompton QB 23 0 0 0
6 181 CHI Dan LeFevour QB 23 0 0 0
7 239 NOR Sean Canfield QB 24 0 0 0
7 250 NWE Zac Robinson QB 24 2012 0 0 0 0

So far this year, Bradford is the only quarterback from the 2010 Draft Class to throw a pass, tho McCoy is currently Washington’s backup.  The graph below shows the amount of passes so far this year in 2016 thrown by quarterbacks from each draft class: [continue reading…]

{ 13 comments }

538: What Is Wrong With Aaron Rodgers?

Today at 538: What is wrong with Aaron Rodgers?

From 2008 to 2014, Rodgers averaged 7.34 yards per dropback,1 according to ESPN’s Stats & Information Group. Rodgers’s rate was the second-best during that time period and just 0.01 yards per dropback behind Peyton Manning’s. That sort of dominant play earned Rodgers two MVP awards and helped the Packers win a Super Bowl.

Recently, things haven’t gone quite so well. Rodgers has averaged 5.79 yards per dropback since the start of 2015. Since November of last year, the Packers are just 5-7. And Rodgers is in the middle of a cold spell prolonged enough to prompt his coach to chip in with a vote of confidence — never a great sign. But what’s to blame for the decline — a change in scheme? Rodgers’s skills? The steady physical destruction of his most trusted receivers? That’s tough to untangle, but we can give it a try.

You can read the full article here.

{ 4 comments }

Sam Bradford, Career Passing By Game

On Sunday night, Sam Bradford had a great game in his first start with the Minnesota Vikings. He completed 22 of 31 passes for 286 yards, and while he was sacked 4 times (for -32 yards), he also threw for 11 first downs and 2 touchdowns with no interceptions. That translates to an 8.40 Adjusted Net Yards per Attempt average, giving 20 yards for every touchdown and deducting for sacks. If you also give him 9 yards for his other 9 first downs (remember, touchdowns are first downs), that means Bradford a 10.7 average.

Was that the best game of Bradford’s uneven career? I thought it might be up there, so I decided to run the numbers. Turns out, Bradford’s had more good games in his 65-game career than I had remembered.

  • In October 2013, Bradford had the most efficient game of his career: he went 12 of 16 for 117 yards with 3 TDs and 9 first downs, and no sacks or interceptions in a blowout over Houston. That gave him a career-high 13.8 ANY/A with the first down bonus included. (
  • As a rookie against the Broncos, Bradford might have had the best combination of quantity and quality in his career: He went 22 of 307 for 308 yards with 3 TDs with 16 first downs, and no interceptions or sack yards lost (he did take two sacks). That gave him a 12.4 ANY/A with the first down bonus, the second highest rate of his career.

The graph below shows all of Bradford’s games and how well he performed (using ANY/A with the first down bonus), in order, and color-coded to match the team he was playing for. I have also included a black line which represents league-average play that season. [continue reading…]

{ 8 comments }

Today at 538: Putting into context the fact that Dak Prescott, the 135th pick in the 2016 NFL Draft, is going to be the Cowboys starting quarterback in week 1. And that Trevor Siemian, a 7th round pick last year who has never seen meaningful action in an NFL game, is going to be the Broncos starter.

This is rarely charted territory in modern history: In the last 30 years, only three rookie quarterbacks drafted outside of the top 100 picks started their team’s season opener: Orton, Chris Weinke in 2001 and Steve Beuerlein in 1988.1 You have to go all the way back to 1977 to find a quarterback not selected in the first 130 picks of the NFL draft who then went on start his team’s season opener as a rookie.

You can view the full article https://fivethirtyeight.com/features/dak-prescott-is-not-your-average-week-1-starting-quarterback/.

{ 1 comment }

Carson Palmer has had a very good career. He first started with the Bengals at age 25, and was a very good quarterback from ages 26 to 28. Over the next 3 years, his play declined to more solid levels, before holding out in Cincinnati and eventually being traded to Oakland. With the Raiders, Palmer was productive at ages 32 and 33, before moving on to Arizona. There, he was productive again at ages 34 and 35, with the latter season being cut short after six games due to a torn ACL. Then, at age 36, he had a career year, with an MVP-caliber season.

Palmer averaged 8.41 Adjusted Net Yards per Attempt last year, which was even better before an ugly performance in a meaningless season finale. The league average was 6.26, and if you define replacement level as 80% of league average, then replacement was 5.01 ANY/A. Palmer had 562 dropbacks last year, and was 3.40 ANY/A above replacement; that translates to being 1908 Adjusted Net Yards above replacement. I used that methodology to chart every season of Palmer’s career; as you can see, 2015 was the best season of his career [continue reading…]

{ 4 comments }

For over two decades, the Green Bay Packers have been lucky to have a Hall of Fame quarterback. How good have things been? Well, last year was only the third time since 1994 that the Packers finished below league average in Adjusted Net Yards per Attempt. But in general, Aaron Rodgers is the best quarterback in the league, and the return of Jordy Nelson should ensure another stellar year for Rodgers.

When discussing Green Bay’s passing attack in the days since the merger, you get a pretty stark split between the pre-Favre/Rodgers eras and the post-Favre/Rodgers eras.  The graph below shows the Packers Relative ANY/A — i.e., the team’s Adjusted Net Yards per Attempt minus the league average ANY/A — in every year since 1970: [continue reading…]

{ 7 comments }

Today at 538, a look at how no passing attack in the NFL was as reliant on two targets the way the Jets passing attack was last year.

Thought of another way, Marshall and Decker saw 305 targets last year, with all other Jets players combining for nearly an equal number: 297. Yet Marshall/Decker combined for 2,529 receiving yards and 26 touchdowns, and all other Jets combined for 1,641 receiving yards and just seven receiving touchdowns. Marshall and Decker together averaged 8.3 yards per target; all other Jets averaged only 5.5 yards per target.

You can read the full article here.

{ 5 comments }

Guest Post: Adam Steele on True QB Talent

Adam Steele is back for another guest post. You can view all of Adam’s posts here. As always, we thank him for contributing.


Introduction: QB True Talent

One of the mandates for being a football analytics guy is to create a quarterback rating system, so today I’m going to throw my flag onto the field. However, I’m taking a different approach by asking a different question. I’m not trying to measure individual or team accomplishments, nor am I calculating value or attempting to predict the future. My goal is to answer a simple question: At a fundamental level, how good was he? As far as I’m aware, nobody has made a systematic attempt at answering this. Before we go any further, I need to add a vital disclaimer. My formula is statistically derived, and does not account for supporting cast, coaching, or anything else we can’t measure directly. So when I use the label “True Talent”, it really means “A rough estimate of true talent, based solely on statistics.”

I’ll save the gory micro details of True Talent’s calculation for another post, but today I want to outline how it works and ask for feedback on how to improve it. First, I’ve attempted to isolate what I believe are the four pillars of QB play: Passing Dominance, Passing Consistency, Ball Protection, and Rushing Ability. These categories are weighted by a) their importance within the framework of the overall QB skillet, and b) the level of control a QB has in converting the skill into results. The score for each category is era-adjusted, balanced by volume and efficiency, and scaled so zero is equal to replacement level. The overall True Talent score is simply the sum of the four category scores, minus five (the replacement level bar is higher for overall QB play compared to each of the pillars on their own). The overall score is expressed as percentage above or below replacement level. I’ve purposely rounded all figures to whole numbers to remind readers that these numbers are estimates, not precise measurements.

My plan is to eventually apply True Talent back to the 1940s, but for now we’re going to look at the last twenty seasons (1996-2015). I want to nail down the methodology before I go all the way back through history. Normally I wouldn’t subject readers to an arduously long table, but in this case I think it’s warranted. I want you to see how all levels of QB fare in my system, not just the best and worst. This table includes every QB season since 1996 with at least 100 dropbacks. I encourage you to sort by each category, by season, and by player to really get a feel for True Talent. [continue reading…]

{ 19 comments }

Tannehill escapes the numbers, if not the pass rush

Tannehill escapes the numbers, if not the pass rush

In each of his four seasons in the NFL, Miami quarterback Ryan Tannehill has been responsible for at least 96% of his team’s pass attempts. In fact, over the last three years, only 13 pass attempts for the Dolphins have come from someone other than Tannehill. He’s been the entrenched starter since week 1 of his rookie year.

There have been 88 quarterbacks since 1970 who have taken at least 90% of the same team’s pass attempts in every year in any four-year window. That includes eight such streaks that cover the last four years (Tannehill, Eli Manning, Matthew Stafford, Matt Ryan, Philip Rivers, Drew Brees, Tom Brady, and Russell Wilson).

Among non-proprietary measures, my preferred measure of quarterback play is Adjusted Net Yards per Attempt, which is yards per attempt with adjustments for touchdowns, interceptions, and sacks. The fine folks at Pro-Football-Reference.com have created a passing index for this (among other) stat, known as ANY/A+, where 100 represents league average, and 85 and 115 represent one standard deviation below/above average. Tannehill’s ANY/A+ was 92 his rookie year, 87 in 2013, 96 in 2014, and 95 last year. [continue reading…]

{ 10 comments }

Adam Steele is back for another guest post. You can view all of Adam’s posts here. As always, we thank him for contributing.


There have been countless attempts at deducing the clutchiness of NFL quarterbacks, most of which involve tallying playoff wins and Super Bowl rings. Today I’m going to take a stab at the clutch conundrum using a different approach: Pythagorean win projection. If a quarterback’s actual win/loss record diverges significantly from his Pythagorean estimated record, perhaps we can learn something from it. I began this study having no idea how it would turn out, so there were definitely some surprises once I saw the end results. This study evaluates the 219 quarterbacks who started at least 32 games since 1950, including playoffs but excluding the 1960-64 AFL (lack of competitive depth).

Here’s how to read the table, from left to right: points per game scored by the QB’s team in games he started, points per game allowed in his starts, total starts, total wins (counting ties as a half win), Pythagorean projected wins based on the points scored and allowed in his starts (using a 2.37 exponent), and the difference between his actual win total and Pythagorean win projection. [continue reading…]

{ 38 comments }

Today’s post is a follow-up to my recent article on adjusting quarterback stats for schedule length and passing environment. In the original piece, I provided you with single-season stats with various era adjustments made. While my main goal was to glean as much as I could from your opinions, I noticed that some readers also liked looking at the different results based on which adjustments I made. With that in mind, I figured it only made sense to submit the career list as well.

When measuring single seasons, I think value over average is the way to go. However, I believe a lower baseline is in order when looking at entire careers. It seems to me that average play is an overlooked aspect of quarterback evaluation, and guys like Brett Favre or John Elway are significantly underrated by statistical models that compare to league average instead of replacement level. I would say that using a higher threshold shows us who was the most dominant, while using a lower threshold shows us who contributed the most value over an extended period. [continue reading…]

{ 45 comments }

Today’s guest post/contest comes from Thomas McDermott, a licensed land surveyor in the State of California, a music theory instructor at Loyola Marymount University, and an NFL history enthusiast. As always, we thank him for his hard work.


One way we can tell if a quarterback is “clutch” – meaning, he plays well when he absolutely has to – is by looking at his 4th Quarter Comebacks (4QC) and Game Winning Drives (GWD). Below are definitions for both [1]As many of you already know, Scott Kacsmar did a ton of great work in this area; his “Quarterbacks and fourth quarter comebacks” article at the old PFR Blog provides all the information you’ll … Continue reading:

    4th Quarter Comeback: In the 4th quarter, the quarterback leads a scoring drive while being down one score or less that results in the game being tied or his team taking the lead. As long as the QB’s team wins the game, the QB gets credit for the 4QC, even if his scoring drive wasn’t the game-winning drive.

    Game-Winning Drive: In the 4th quarter or overtime, the quarterback leads a scoring drive that results in his team taking the lead (meaning, breaking a tie or overcoming a deficit) for the last time.

[continue reading…]

References

References
1 As many of you already know, Scott Kacsmar did a ton of great work in this area; his “Quarterbacks and fourth quarter comebacks” article at the old PFR Blog provides all the information you’ll ever need about 4QC/GWDs.
{ 17 comments }

Three years ago, I looked at the career leaders in 4th quarter (and overtime) game-winning touchdown passes. That post is ready for an update, and there’s been some interesting movement at the top of the charts.

As a reminder: tracking things like game-winning touchdowns is only interesting in a trivial sort way. I looked at all games, regular and postseason, in all leagues, from 1940 (and before 1940 for postseason games) to 2015, and counted all touchdowns scored that put the player’s team ahead for good (with one exception: I did not count touchdowns scored when down by 7 and the team successfully went for two afterwards). The table below shows all players with at least 4 such game-winning touchdown passes.

Incredibly, Johnny Unitas is still the record-holder in this category. In 23 games, Unitas threw a touchdown pass in the fourth quarter to win the game for the Colts. His first came against Washington in 1956, with his last coming 14 years later against the Bears. The table below provides a link to all 23 such fourth-quarter, game-winning touchdown throws by Unitas: [continue reading…]

{ 20 comments }

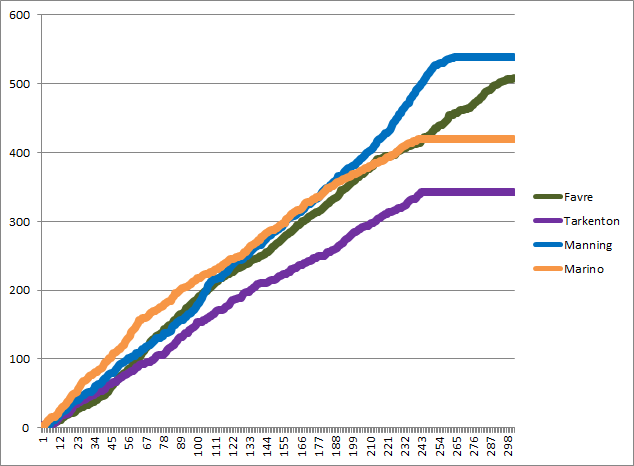
There have been four passing touchdown kings in the last 40 years: Fran Tarkenton, Dan Marino, Brett Favre, and Peyton Manning.  I thought it would be fun to plot the number of career touchdown passes each player had on the Y-Axis after each game of their career (shown on the X-Axis):

td pass leaders
[continue reading…]

{ 7 comments }

Tom Brady and Drew Brees ended the 2015 season in a pretty remarkable place: both have 428 touchdown passes, tied for the third most in NFL history.  Both threw their first touchdown pass in 2001, which makes it easy — and fun! — to compare the two players.  The graph below shows the number of career touchdown passes for each player over every week since 2001:

brady brees td

Brady took an early edge, both because he started earlier (he had 18 touchdowns in 2001; Brees had 1) and played better earlier (Brees had 28 touchdowns in ’02 and ’03 combined; Brady had that many just in ’03).  And, of course, Brady’s scorched-earth 2007 season helped see him take his biggest lead.  Consider that through 2007, Brees had thrown fewer than 30 touchdown passes in each of his first seven seasons. Since then? Brees has thrown more than 30 touchdowns in all eight seasons! [continue reading…]

{ 7 comments }

Over at TheGridFe, I just finished the single season portion of my series on the (statistically) greatest regular season quarterback performances in NFL history. I’ve discussed the stats, as they are, which always seem to paint modern quarterbacks in a much better light. I’ve prorated for season length, which can sometimes produce a few curious results. I’ve also applied both hard and soft inflation adjustments to account for the evolution of the position and increase in its usage rate. [1]I also presented TAY/P+ scores, but that’s not particularly relevant to this discussion. Check it out anyway, though. After talking with Adam Steele and agreeing that maybe even the most moderate approach still left seasons like Sid Luckman’s 1943 or Dan Fouts’s 1982 getting far more credit than they probably should. So I went ahead and made an even weaker era adjustment, which I will discuss briefly in this post, to try to mitigate the effects of the original modifications.

My main purpose for writing today isn’t to give you another list of great quarterback seasons, although I will do that as well. My goal is to solicit the opinions of the Football Perspective readers, whom I respect for their thoughtful and reasoned nature. I have two primary questions: [continue reading…]

References

References
1 I also presented TAY/P+ scores, but that’s not particularly relevant to this discussion. Check it out anyway, though.
{ 33 comments }

Recently, I posted a quick and dirty method to measure quarterback career value above average and above replacement. I used Adjusted Yards per Pass Attempt as the foundational stat because its inputs (yards, touchdowns, interceptions, and attempts) are on record back to 1932.

Today, I wanted to use the same model with Adjusted Net Yards per Dropback (ANY/A) as the base metric. I believe ANY/A is a more accurate reflection of quarterback production, but it does have the downside of only being recorded back to 1969 in Pro Football Reference’s database.

Thus, while the previous post covered every passer in the official stat era, this post will only cover value added since 1969. This means greats like Sammy Baugh and Sid Luckman are completely overlooked, while legends like Johnny Unitas and Joe Namath only have their worst years included (an unfortunate byproduct of this study’s limitations, to be sure).

In case you didn’t want to click back through the previous article to see the details of the formula, I’ll briefly cover the basics here: [continue reading…]

{ 41 comments }

Over the last week, I’ve looked at the biggest quarterback declines and quarterback turnarounds when it comes to career records. But there were some limitations in those studies, so today, I want to use a new method.

I assigned 20 games of .500 play — i.e., a 10-10 record — to each quarterback’s record after every start of his career. Then I checked to see which quarterbacks had the biggest declines/improvements in record/rest-of-career record using these metrics.

Let’s take Marc Bulger as an example. He started 95 games in his career. At one point, he was 28-11, which is a 0.718 winning percentage. For the rest of his career, he went 13-43, for a 0.232 winning percentage. If we add 20 games of .500 play to his first stint, that makes him 38-21, which translates to a 0.644 winning percentage. For his rest of career, his record would go down as 23-53, a 0.303 adjusted winning percentage. That’s an adjusted winning percentage decline of 0.341, the most of any quarterback in history. [continue reading…]

{ 10 comments }

Friend of the program Bryan Frye is back for another guest post. As regular readers know, Bryan operates his own fantastic site, http://www.thegridfe.com. You can view all of Bryan’s guest posts here, and follow him on twitter @LaverneusDingle.


Floating around the internet, there are copious metrics for measuring quarterback performance. Some are very basic (passing yards, completion rate), while others are quite complex (EPA, WPA). Some are open-source (passer rating, ANY/A), while others are proprietary (DVOA, Total QBR). It seems there is a stat to cover just about every aspect of QB play, so the last thing we need is another useless number.

Well, I didn’t get that memo.

Today, I’m going to look at a somewhat abstract measurement for career value, based on adjusted yards per attempt relative to league average. I prefer ANY/A and my own TAY/P (and the different iterations of both metrics), but gaps in the record books mean we can only go so far with either. [1]Pro-Football-Reference doesn’t have ANY/A prior to 1969. I don’t have TAY/P prior to 1991; even without including first down data, I can only go back to 1963 before I run out of complete sack … Continue reading With AY/A, we can go back to 1932, the very first season of the “official stat” era in the NFL.

The methodology is simple and straightforward. I took Pro Football Reference’s AY/A Index Scores for every quarterback with at least 1500 career pass attempts. If you are familiar with PFR’s advanced passing stats, you know they are based on three seasons’ worth of data (years n-1, n, and n+1), and a score of 100 represents league average output. [2]Except in 1932, when there is no year n-1, and the current year, when there is no n+1. To find the AY/A+ score itself, you simply multiply a player’s z-score by fifteen and add the product to 100. Using this knowledge, I reverse engineered the passing Index Scores in order to find the number of standard deviations above or below average each quarterback’s AY/A was. I then multiply that number by pass attempts to come up with an abstract career value metric. I also did this for replacement level, using one standard deviation below average as the baseline for replacement play.

The formulas:

Value over average = [(AY/A Index Score – 100)/15]*Attempts

Value over replacement = [(AY/A Index Score – 85)/15]*Attempts

Like I said, this isn’t forking any lightning in the realm of quarterback analysis. It’s just a quick and dirty way to approximate career productivity based on a well-known metric.

The Results

The table below shows the abstract career value of the 182 quarterbacks who met the 1000 attempt threshold. Read it thus: Peyton Manning played 266 career games and had 9380 pass attempts. His career AY/A+ score was 116. This gives him a total value of 10005 above average and 19385 above replacement (this is the metric by which the table is sorted). Note that the table below does list all 182 quarterbacks, but for ease of scrolling, only the top 25 are displayed by default. You can change that using the dropdown arrow on the left, or you can search for your favorite passer.

RkQuarterbackGAttAY/A+ValRepl
1Peyton Manning26693801161000519385
2Tom Brady2257792115779215584
3Dan Marino2428358112668615044
4Drew Brees2178085112646814553
5Brett Favre30210169106406814237
6Joe Montana1925391118646911860
7Steve Young1694149125691511064
8Fran Tarkenton2466467110431110778
9Aaron Rodgers1264047124647510522
10Ben Roethlisberger1715423114506110484
11Dan Fouts1815604113485710461
12John Elway2347250106290010150
13Warren Moon2086823107318410007
14Philip Rivers164533911346279966
15Johnny Unitas211518611138038989
16Tony Romo155433111646208951
17Kurt Warner124407011643418411
18Ken Anderson192447511338788353
19Jim Kelly160477911031867965
20Donovan McNabb167537410725087882
21Len Dawson211374111639907731
22Otto Graham126262612950777703
23Boomer Esiason187520510724297634
24Sonny Jurgensen218426211131257387
25Roger Staubach131295812243387296
26Carson Palmer160544310518147257
27Dave Krieg213531110517707081
28Y.A. Tittle204439510926377032
29Phil Simms164464710721696816
30Mark Brunell193464010721656805
31Trent Green120374011229926732
32Sammy Baugh165299511835946589
33Roman Gabriel183449810617996297
34Eli Manning185622710006227
35Rich Gannon157420610719636169
36Steve McNair161454410515156059
37Craig Morton207378610922726058
38Randall Cunningham161428910617166005
39Troy Aikman165471510412575972
40Bob Griese161342911125155944
41John Hadl224468710412505937
42Jim Everett15849231039855908
43Jeff Garcia125367610922065882
44Drew Bledsoe194671798-8965821
45Vinny Testaverde233670198-8935808
46Matt Ryan126453010412085738
47Terry Bradshaw168390110718205721
48Bart Starr196314911225195668
49Norm Van Brocklin140289511427025597
50Jim Hart20150761013385414
51Daunte Culpepper105319911021335332
52Matt Hasselbeck209533010005330
53Neil Lomax108315311021025255
54Joe Theismann167360210614415043
55Jeff George131396710410585025
56Ron Jaworski18841171038234940
57Chris Chandler18040051038014806
58Ken O'Brien129360210512014803
59Matt Schaub141327110715264797
60John Brodie20144911012994790
61Joe Namath140376210410034765
62Bobby Layne17537001049874687
63Steve Beuerlein147332810613314659
64Jay Cutler13443541012904644
65Brad Johnson17743261012884614
66Steve Bartkowski129345610511524608
67Steve Grogan14935931049584551
68Neil O'Donnell125322910612924521
69Bernie Kosar126336510511224487
70Brian Sipe12534391049174356
71Steve DeBerg206502498-6704354
72Daryle Lamonica151260111017344335
73Danny White166295010713774327
74Earl Morrall255268910916134302
75Ken Stabler18437931025064299
76Bert Jones102255111017014252
77Marc Bulger96317110510574228
78Kerry Collins198626195-20874174
79Russell Wilson64173512124294164
80Sid Luckman128174412023254069
81Billy Kilmer17029841059953979
82Chad Pennington89247110914833954
83Jim Harbaugh177391810003918
84Charley Johnson16533921024523844
85Charlie Conerly16128331059443777
86Jim Plunkett157370110003701
87Michael Vick14332171024293646
88Joe Ferguson186451997-9043615
89Cam Newton78241910711293548
90Joe Flacco122407098-5433527
91Mark Rypien10426131058713484
92Norm Snead178435397-8713482
93George Blanda340400798-5343473
94Jeff Blake11932411012163457
95Matthew Stafford93369199-2463445
96Don Meredith104230810710773385
97Jay Schroeder11828081035623370
98Aaron Brooks9329631023953358
99Lynn Dickey15231251012083333
100Jake Delhomme10329321023913323
101Jeff Hostetler15223381069353273
102Frank Ryan126213310811383271
103Bill Kenney10624301058103240
104Greg Landry14623001069203220
105Tommy Kramer129365198-4873164
106Archie Manning151364298-4863156
107Alex Smith126361998-4833136
108Jim McMahon11925731035153088
109Brian Griese9327961011862982
110Jim Zorn140314999-2102939
111Bobby Hebert118312199-2082913
112Jake Plummer143435095-14502900
113Gus Frerotte147310699-2072899
114David Garrard8622811046082889
115Babe Parilli189333098-4442886
116Jack Kemp122307399-2052868
117Billy Wade12825231023362859
118Gary Danielson10119321067732705
119Doug Williams8825071011672674
120Bill Nelsen9019051067622667
121Jon Kitna141444294-17772665
122Andy Dalton7724971011662663
123Elvis Grbac10524451011632608
124Stan Humphries88251610002516
125Chris Miller98289298-3862506
126Wade Wilson125242810002428
127Milt Plum129241910002419
128Tom Flores10617151066862401
129Tobin Rote149290797-5812326
130Doug Flutie9221511011432294
131Bob Waterfield9116171066472264
132Frankie Albert9015641066262190
133Scott Mitchell99234699-1562190
134Erik Kramer83229999-1532146
135Ed Brown15419871011322119
136Bill Munson10719821011322114
137Tony Eason9015641055212085
138Jason Campbell90251897-5042014
139Kyle Orton87271296-7231989
140Richard Todd119296795-9891978
141Andrew Luck55210699-1401966
142Rodney Peete104234697-4691877
143Eddie LeBaron134179610001796
144Tony Banks96235696-6281728
145Ryan Tannehill64224896-5991649
146Cotton Davidson111175299-1171635
147Ryan Fitzpatrick113347392-18521621
148Charlie Batch81160410001604
149Jay Fiedler76171799-1141603
150Mike Livingston91175197-3501401
151Bubby Brister99221294-8851327
152Byron Leftwich60160597-3211284
153Don Majkowski90190595-6351270
154Steve Bono88170196-4541247
155Mike Tomczak185233793-10911246
156Matt Cassel100257492-13731201
157Marc Wilson126208193-9711110
158Sam Bradford63229292-12221070
159Josh McCown77195693-9131043
160Eric Hipple102154695-5151031
161Dan Pastorini140305590-20371018
162Vince Ferragamo75161594-646969
163Josh Freeman62204892-1092956
164Kordell Stewart125235891-1415943
165Trent Dilfer130317289-2326846
166Tim Couch62171492-914800
167David Carr94226790-1511756
168Mark Sanchez75226789-1662605
169Derek Anderson68154390-1029514
170Billy Joe Tolliver79170789-1252455
171Rex Grossman54156289-1145417
172Chad Henne64195488-1563391
173Frank Tripucka75174588-1396349
174Dave Brown73163488-1307327
175Mike Pagel132150986-1408101
176Kyle Boller67151983-1722-203
177Jack Trudeau67164483-1863-219
178Mike Phipps119179983-2039-240
179Mark Malone73164882-1978-330
180Joey Harrington81253882-3046-508
181Rick Mirer80204381-2588-545

I normally like to point out a few curiosities I notice in the data, but I’d rather just present the numbers and leave the comments to the readers. What sticks out to you? Oh, and one note: back in 2006, Chase did some back-of-the-envelope calculations that had Rick Mirer as the worst quarterback of all time. 10 years later, not much has changed.

References

References
1 Pro-Football-Reference doesn’t have ANY/A prior to 1969. I don’t have TAY/P prior to 1991; even without including first down data, I can only go back to 1963 before I run out of complete sack data.
2 Except in 1932, when there is no year n-1, and the current year, when there is no n+1.
{ 8 comments }

The Dallas Cowboys are rumored to be drafting a replacement for Tony Romo with the fourth pick in the first round. In general, teams with bad offenses are the ones that draft quarterbacks, and technically, the Cowboys would fit that mold given the team’s struggles last year. But, of course, the Cowboys expect to have a good offense in 2016 with a healthy Romo, so I was curious how unusual it would be for a good team to spend a first round pick on a quarterback.

The table below shows the offensive SRS grade and the number of wins [1]Pro-rated to 16 games for non-16 game seasons. for each team that has drafted a quarterback since 1971 in the year preceding such draft. For example, the 2014 Bucs and Titans had very bad offenses and went 2-14 before drafting quarterbacks with the first two picks. That’s how things typically go, but not always. [continue reading…]

References

References
1 Pro-rated to 16 games for non-16 game seasons.
{ 5 comments }

The under-appreciated Jim Hart

The under-appreciated Jim Hart

Yesterday, I noted that Cleveland Browns quarterback Bernie Kosar had a 39-23-1 career record after the 1989 season, but actually finished his career with a losing record. That sounded pretty wild to me, so I wanted to investigate further.

Kosar’s Browns defeated the Steelers in the 1990 season opener, which brought his career record to 40-23-1, or 17 games over .500. But Kosar went just 13-31 over his final 44 games; after a 0.633 winning percentage in his first 64 games, he posted a 0.295 winning percentage for the remainder of his career.

So I wondered, among quarterbacks who finished their career with a .500 record or worse, does Kosar hold the record for most games above .500 at any one point? As it turns out, that honor goes to Jim Hart. Younger fans likely know very little about Hart, but he’s one of the better quarterbacks not in the Hall of Fame. He spent 18 years with the Cardinals, and made the Pro Bowl in four straight seasons from ’74 to ’77. By 1981, he ranked third all time in career passing yards and ninth in passing touchdowns. He made it into the top 50 on Brad Oremland’s list, and snuck into the top 30 on my list.

But if you look at the raw numbers, you’re likely to be unimpressed. That’s because the bulk of his career took place during the ’70s, but also because he retired with an 87-88-5 record. But as of November 20th, 1977, Hart had a 69-47-5 record, a 0.591 winning percentage. Of course, it was all downhill from there for Hart, who went just 18-41 (0.305) for the rest of his career. [continue reading…]

{ 10 comments }

Here is Colin Kaepernick’s ANY/A average in each of the last four years:

kaep decline

Kaepernick won't listen to comments about his declining ANY/A

Kaepernick won’t listen to comments about his declining ANY/A

That is not a very promising graph. Last year, I wrote about how Kaepernick, Cam Newton, and RG3 were a unique trio of young quarterbacks who had declined in two consecutive years. Well, 2015 was where those quarterbacks diverged: Newton won the MVP, Griffin did not take a single snap, and Kaepernick continued his decline.

Kaepernick’s 2012-2015 represents just the 44th instance where a quarterback saw his ANY/A decline in three straight seasons (minimum 100 pass attempts each year). But he’s even an outlier in this group. He was one of just six quarterbacks who was younger than 25 at the start of the first season, joined by Pat Haden, Jeff Blake, Bernie Kosar, Rick Mirer, and Ken O’Brien. And he and Aaron Brooks are the only two players to have a dropoff of at least 0.5 ANY/A in each season.

Here’s how to read the table below, using Philip Rivers as an example. His four-year stretch began at the age of 28 in 2009, when he had an ANY/A average of 8.3. Over the next three years, that dropped to 7.77, 6.64, and then 5.45. His lowest decline in any of those seasons was 0.53 ANY/A, and this is the column by which the table is sorted. His total decline from Year 1 to Year 4 was 2.85 ANY/A. Finally, in the next season — what would be 2016 for Kaepernick — Rivers rebounded with a 7.79 ANY/A average. For players who did not have 100 pass attempts (and for Kaepernick) in season N+4, that cell is blank. [continue reading…]

{ 11 comments }

The Eagles have resigned Sam Bradford, in a move that’s pretty hard to justify. In five different seasons, Bradford has thrown at least 250 pass attempts (he missed all of 2014 with a torn ACL). In those years, he has never ranked as a league-average quarterback as measured by Net Yards per Attempt. Based on PFR’s Advanced Passing Index ratings, Bradford had an 84 NY/A+ as a rookie, a 73 in year two, a 94 in 2012, an 89 in 2013, and a 98 last year.

In these ratings, 100 represents league average, 85 is one standard deviation below league average, and 70 is two standard deviations below league average. That’s five seasons of below-average — and often really below average — quarterbacking. And it now appears as though he’ll be given a sixth year, and you can imagine the smart money is on him once again falling short of league average.

I’m using NY/A instead of ANY/A because NY/A is a better predictive stat and less sensitive to outlier plays, and that arguably hurts Bradford in this analysis. He did post a 102 in ANY/A+ in 2013 because of an excellent interception rate, but the biggest criticism of Bradford is that he doesn’t take enough risks, as he generally throws very short passes. His average pass traveled just 7.04 yards downfield in 2015, which ranked 31st out of 34 qualifying quarterbacks. He ranked 34th out of 37 passers in this metric in 2013, 22nd out of 32 in 2012, 10th out of 33 in 2011, and 30th out of 31 in 2010. As a result, yes, Bradford does throw fewer interceptions, but I don’t think that’s a sign of anything other than conservative quarterback play.

I looked at all quarterbacks who had at least five seasons since 1970 [1]I have included quarterbacks who entered the league before 1970, but only counted their post-1969 seasons. with 250 pass attempts. Every season with a NY/A+ index of less than 100 was graded as “Bad” and every season with a NY/A+ index of 100 or better was “Good.” Bradford therefore goes down as 0/5, giving him a grade of -5. That’s pretty bad, although not the worst score in the group: [continue reading…]

References

References
1 I have included quarterbacks who entered the league before 1970, but only counted their post-1969 seasons.
{ 37 comments }

Guest Post: QB Playoff Support: Part II

Adam Steele is back, this time with some playoff support stats for eight more quarterbacks. You can view all of Adam’s posts here.


Two weeks ago, I published a study detailing the playoff supporting casts of Tom Brady and Peyton Manning. Today I’m going to look at eight more notable quarterbacks under the same microscope. Below are the career tables for each QB, in no particular order. [continue reading…]

{ 57 comments }

This pass probably wasn't completed.

This pass probably wasn’t completed.

In the NFC Championship Game, Carson Palmer was really bad.  He completed 23 of 40 passes for 235 yards, with three sacks that lost 8 yards.  That by itself is not very good — it translates to a 5.3 net yards per attempt average — but the real damage came when it comes to turnovers.  Palmer threw one touchdown againt four interceptions, giving him an Adjusted Net Yards per Attempt average of just 1.56.  And even that inflates things a bit, as Palmer also fumbled twice, with both fumbles being recovered by Carolina. On the season, Carolina allowed 4.46 ANY/A to opposing passers, the best in the NFL, so that does mitigate things a bit.  As a result, Palmer’s game is considered -125 ANY below expectation, because he was 2.9 ANY/A below expectation over 43 dropbacks.

That’s bad, but nowhere near as bad as the worst performance from even this year’s playoffs (Brian Hoyer) or the last Cardinals playoff loss (thank you, Ryan Lindley).  But the reason Palmer’s performance appeared so bad was precisely because it came from someone like Carson Palmer, and not a Hoyer or a Lindley.  Palmer, after all, was arguably the best passer in the NFL this season.  He led the NFL in Adjusted Net Yards per Attempt, at 8.11, which was 2.14 ANY/A better than league average. [continue reading…]

{ 33 comments }

In 1974, Terry Bradshaw was not very good. He threw for just 785 yards on 148 pass attempts, while throwing only 7 touchdowns against 8 interceptions. That translates to a 2.92 Adjusted Net Yards per Attempt average, which is terrible even for 1974. He ranked 25th in ANY/A among the 32 quarterbacks with at least 120 pass attempts. Given the league average of 3.91, that means Bradshaw finished the year with a Relative ANY/A of -0.99.

That’s the worst of any quarterback who wound up winning the Super Bowl. But that doesn’t mean Bradshaw wasn’t a big part of why Pittsburgh won its first title. He was excellent in the team’s three playoff games, particularly in Pittsburgh’s first win. [continue reading…]

{ 11 comments }

Teddy Bridgewater and Quarterback Help

No offense has had it easier this year than the Denver Broncos. What do I mean by that? Denver ranks 4th in points allowed, at 276, but that’s a little misleading. The Broncos have thrown three pick sixes, all from Peyton Manning, and those have put 20 points on the scoreboard (one pick six was followed by a failed two-point attempt). In addition, Denver’s defense/special teams has scored six touchdowns. Those obviously go in the “Points Scored” column for Denver, but in terms of the offense, they didn’t earn those points. So instead, let’s subtract all non-offensive touchdowns scored by the Broncos by the points allowed by Denver. Do that, and the Broncos defense has allowed 214 net points, after excluding pick sixes and crediting the defense for non-offensive touchdowns.

That’s the fewest in the NFL. Last offseason, I wrote an article about Andrew Luck and quarterback help.  It was pretty basic, but I found it interesting enough to recreate today.  Here is the methodology: [continue reading…]

{ 13 comments }
Next Posts Previous Posts