≡ Menu

Checkdowns: Carson Palmer and MVP Voting

Since twitter limits me to 140 characters, and I’m having fun debating with guys like Bryan Frye (@LaverneusDingle) and Adam Hartstad (@AdamHarstad), I thought I’d crunch some numbers here.

Is Carson Palmer the best choice for MVP this year? Let’s put aside the Cam Newton argument and just focus on Palmer’s place in post-merger history.   As Adam pointed out, 2015 Carson Palmer is currently 7th on the list of Adjusted Net Yards per Attempt leaders, and the six players in front of him all won the AP MVP (that would be Peyton Manning 2004, Aaron Rodgers 2011, Dan Marino 1984, Tom Brady 2007, Manning 2013, and Rodgers 2014).

Of course, ANY/A is biased in favor of modern players, so let’s look at ANY/A+. Here, he doesn’t drop as far as you might think: Carson is still tied for the 11th best season since 1970, and a few non-AP MVPs sneak in there ahead of him (Mark Rypien 1991, Randall Cunningham 1998, and a quarterback who lost to another quarterback a having historic season: Montana ’84 and Ken Anderson 1981). [continue reading…]

{ 32 comments }

Cam waits for the 4th quarter to arrive

Cam waits for the 4th quarter to arrive

In the 4th quarter and in overtime this year, Carolina quarterback Cam Newton has been really, really good.  Newton has completed 54 of 83 passes for 733 yards with 6 touchdown throws and just one interception, along with five sacks for -35 yards.  Newton is therefore averaging an impressive 8.78 Adjusted Net Yards per Attempt after 45 minutes have gone by in each game; among quarterbacks with at least 40 pass attempts this year, that’s the second best average in the league, a hair behind Tom Brady (8.81) and just ahead of Carson Palmer (8.59). (Although I will note that noted clutch quarterback Tony Romo is averaging 9.77 ANY/A on 21 4th quarter/overtime pass attempts this year.)

Below are the passing stats from every quarterback this year in the 4th quarter and overtime so far in 2015: [continue reading…]

{ 7 comments }

In my Washington Post article this week, I noted that Ryan Fitzpatrick was doing well as Jets quarterback in part because he was often playing with the lead. Fitzpatrick threw a whopping 58 times against the Eagles, and all but two of those plays came with the Jets trailing. In his other four games, Fitzpatrick threw just 18 passes while trailing. And, this year, Fitzpatrick has a 6.5 ANY/A average while throwing passes with the lead, and 4.8 ANY/A while throwing passes while trailing. [1]Frankly, even that understates the split. Fitzpatrick was terrible in the Eagles game, which, admittedly, may have more to do with the Eagles defense than the Game Script. But Fitzpatrick averaged … Continue reading

But I thought it would be fun to see how every quarterback has fared this year while leading and then while trailing, with a minimum of 30 pass attempts in each situation. That’s what graphed below, and the two guys who really stand out are Cam Newton and Andy Dalton.  The Bengals quarterback has been outstanding this year in both situations, while the Panthers quarterback has been significantly more impressive this year while trailing.  In the graph below, the X-Axis shows ANY/A while leading; for Newton, that’s a pedestrian 5.5 ANY/A.  The Y-Axis shows ANY/A while trailing, which is an incredible 9.2. [continue reading…]

References

References
1 Frankly, even that understates the split. Fitzpatrick was terrible in the Eagles game, which, admittedly, may have more to do with the Eagles defense than the Game Script. But Fitzpatrick averaged 2.98 ANY/A that day. In 13 passes against the Browns — all of which came in the 2nd quarter with the Jets trailing by 3 or 7 points — he averaged 7.1 ANY/A. And in 5 passes against Washington, Fitzpatrick averaged 20.2 ANY/A, which was largely the result of yards after the catch gained by his receivers.
{ 11 comments }

Friend of the program Bryan Frye is back for another guest post. As regular readers know, Bryan operates his own fantastic site, http://www.thegridfe.com. You can view all of Bryan’s guest posts here, and follow him on twitter @LaverneusDingle.


Five weeks of regular season football have come and gone. Those five weeks have seen quarterbacks attempt 5,470 passes and take 5,817 dropbacks. Throw in rushes, and quarterbacks have been involved in 6,184 action plays thus far. [1]Keep in mind this was written before the Thursday night game featuring Matt Ryan and Drew Brees. That seems like a large number, but it is only a fraction of the average 20,764 action plays quarterbacks have been involved in over the last two seasons. [2]Quarterbacks are currently on pace for just over 21,000 plays, which would be the highest total in history by a small margin. There are still 358 games left in the regular season (69.9% of the schedule), and we cannot know with epistemic certainty what is going to happen between now and January 3.

However, it is still fun to take the plays we have seen (and the stats those plays have produced) and use them to assess the quarterback landscape of this young season. The following tables present raw, rate, and adjusted stats for the 35 quarterbacks who have attempted at least 70 passes this season. [3]The NFL official requirement for rate stat qualification. I’ll provide some brief commentary, but I’d like to let Chase’s educated audience come up with their own points. Without further ado, here are the raw stats… [continue reading…]

References

References
1 Keep in mind this was written before the Thursday night game featuring Matt Ryan and Drew Brees.
2 Quarterbacks are currently on pace for just over 21,000 plays, which would be the highest total in history by a small margin.
3 The NFL official requirement for rate stat qualification.
{ 9 comments }

For most NFL fans, the book on Andy Dalton has been written in permanent ink.  But this week at the Washington Post, I write why 2015 may in fact be his breakout season.

So, through three weeks, it’s easy to dismiss the great numbers that Dalton has produced as the product of a small sample size. On 94 passing drop backs, he’s thrown for 866 yards and 8 touchdowns with just two sacks and one interception. That translates to a 10.32 Adjusted Net Yards per Attempt average, the best in football through three weeks. But is there any reason that Dalton, who has had hot streaks before, can maintain this level of play?

You can read the full article here.

{ 5 comments }

Guest Post: Quarterback Tiers Based On Age and Talent

Today we have a guest post from James Deyerle, a longtime reader of this blog and the PFR blog, and who lives in Richmond, VA. As always, we thank our guests for contributing to the site.


If there’s one thing NFL fans can’t resist, it’s ranking quarterbacks, but while those conversations are often framed with stats, playoff success, awards, and more, it misses a big part of how fans and front offices treat quarterbacks. For example, despite similar stat lines in 2014 Vikings fans are justified in feeling very differently about Teddy Bridgewater than Bears fans feel about Jay Cutler.

One of the biggest reasons is age: Cutler was 31 and in his 9th season last year, while Bridgewater was only a 22 year old rookie, making him one of the youngest rookies in the past 15 years to see significant playing time. A collection of studies on quarterback aging from Chase, Neil Paine, and Brian Burke show that as a group, quarterbacks rapidly improve into their late 20s, peak for a few years, and then begin an accelerating decline throughout their 30s. This expected improvement lends promise to Bridgewater’s young career while the projected decline condemns Cutler’s, which informs our opinions and feelings on these quarterbacks. As such, I decided to create a system that more accurately reflects a team’s quarterback situation. [continue reading…]

{ 26 comments }

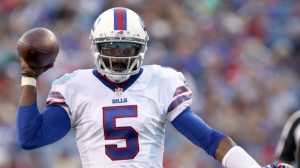
TTaylorTyrod Taylor was a sixth round pick of the Baltimore Ravens in 2011. Since then, he’s thrown just 35 passes over four years, before signing with the Bills as a free agent in the 2015 offseason. Now, after beating out Matt Cassel and EJ Manuel in training camp, Taylor will be the Buffalo Bills opening day starter in 2015.

How rare is this? Taylor was in the NFL for at least four seasons and never started a game in his NFL career; now he’s his team’s opening day starter. Since 1970, there are just four other quarterbacks who meet that profile. In reverse order… [continue reading…]

{ 14 comments }

Data Dump: Quarterback/Coach Pairs

Reading 538’s NFC East preview got me thinking about head coach and quarterback pairs. The Giants are currently enjoying a very long stretch of quarterback/coach consistency, but New York’s franchise history is filled with that sort of commitment. Washington, meanwhile, has not had one quarterback/coach combination reach five years together in 30 seasons!

So today, a quick data dump. Below are all instances where one coach and one quarterback were together for at least five seasons for each franchise. A quarterback gets credit for a season if he led his team in passing yards that year. For each team, I’ve listed the number of years the coach/quarterback were together in parentheses. [continue reading…]

{ 2 comments }

On Monday, I looked at the SOS-adjusted Adjusted Net Yards per Attempt ratings of every quarterback and defense in the NFL in 2014. And just like last year, I want to follow that post by looking at the best and worst games of the year, from the perspectives of both the quarterbacks and the defenses.

Let’s start with the top 100 passing games from 2014. The top spot belongs to Ben Roethlisberger, for his scorched-earth performance against Indianapolis. The Steelers star threw for 522 yards and 6 touchdowns on just 49 pass attempts with no sacks or interceptions. For the game, that means Roethlisberger averaged 13.10 ANY/A. The league-average last season was 6.13 ANY/A, which means Roethlisberger was 6.97 ANY/A above average. Now since the game came against a Colts team that was 0.28 ANY/A worse than average last year, we have to reduce that by the same number. That puts Roethlisberger at 6.70 ANY/A above expectation; multiply that by his 49 dropbacks, and he produced 328 adjusted net yards of value above average after adjusting for strength of schedule. That was easily the top game of 2014. [continue reading…]

{ 2 comments }

Bryan Frye, owner and operator of the great site http://www.thegridfe.com, is back for another guest post. You can also view all of Bryan’s guest posts at Football Perspective at this link, and follow him on twitter @LaverneusDingle.


On Monday, I looked at which quarterbacks since 1960 helped or hurt their teams the most by taking or avoiding sacks. On Tuesday, I looked at the quarterbacks who gained the most or fewest yards through the air per attempt or dropback, and on Wednesday, we looked at completions relative to league average. Yesterday, the metric of the day was touchdown pass rate.

As promised, this article, “Dr. Safelove or: How I Learned to Start Worrying and Fear the Bomb,” centers on interceptions. The methodology here is no different from before: Figure out each player’s rate stats relative to the average of the rest of the league minus that player (LMP) that year and multiply it by his attempts to find the marginal total.

The caveat for this article is a big one: it is mathematically impossible for modern players to rank highly on a per play basis. In 1945, Sammy Baugh threw interceptions at a rate 7.4% lower than his peers. Because the league average today is so low (about 2.5%), a current quarterback would have to throw negative interceptions to match a -7.4% relative pick rate. Even if a quarterback threw 700 passes without an interception, the best he could possibly do is about -2.5%. [continue reading…]

{ 25 comments }

Bryan Frye, owner and operator of the great site http://www.thegridfe.com, is back for another guest post. You can also view all of Bryan’s guest posts at Football Perspective at this link, and follow him on twitter @LaverneusDingle.


On Monday, I looked at which quarterbacks since 1960 helped or hurt their teams the most by taking or avoiding sacks. On Tuesday, I looked at the quarterbacks who gained the most or fewest yards through the air per attempt or dropback. And yesterday, we looked at completions relative to league average.

Today’s article, “Mile High Club or: Scoring through the Air,” is an examination of how often quarterbacks threw touchdowns. [1]Note that I didn’t say “how well quarterbacks threw touchdowns.” A screen with 80 YAC, a bomb to a wide open speedster, and a missile into tight coverage all count for six on the stat sheets.

I have used the same methodology as before (similar to Chase’s model for Relative Adjusted Net Yards), and I have maintained the same minimum attempt cutoffs. That means we’ll only look at seasons with 224 or more attempts and careers with 1,000 or more attempts. Like before, I didn’t prorate for shorter seasons. [2]Feel free to copy the table and make your own spreadsheet if you’d like. Or don’t. I’m not going to tell you how to live your life. [continue reading…]

References

References
1 Note that I didn’t say “how well quarterbacks threw touchdowns.” A screen with 80 YAC, a bomb to a wide open speedster, and a missile into tight coverage all count for six on the stat sheets.
2 Feel free to copy the table and make your own spreadsheet if you’d like. Or don’t. I’m not going to tell you how to live your life.
{ 14 comments }

Bryan Frye, owner and operator of the great site http://www.thegridfe.com, is back for another guest post. You can also view all of Bryan’s guest posts at Football Perspective at this link, and follow him on twitter @LaverneusDingle.


On Monday, I looked at which quarterbacks since 1960 helped or hurt their teams the most by taking or avoiding sacks. Yesterday, I looked at the quarterbacks who gained the most or fewest yards through the air per attempt or dropback. As you may have guessed, I’m keeping the theme going today. This article, “Sharpshooters or: Quarterbacks who were Good at Completing Passes,” is an examination of how passers stacked up statistically against their peers in the not-super-important category of completion rate. [continue reading…]

{ 20 comments }

Bryan Frye, owner and operator of the great site http://www.thegridfe.com, is back for another guest post. You can also view all of Bryan’s guest posts at Football Perspective at this link, and follow him on twitter @LaverneusDingle.


Yesterday, I looked at which quarterbacks since 1960 helped or hurt their teams the most by taking or avoiding sacks. In this post, “Frequent Flyers or: Quarterbacks who Gained Yards through the Air,” I’ll do something similar but with passing yards instead of sacks.

Because we have the necessary passing stats dating back to 1932, I can take this study back nearly three decades further than the previous one. However, I will use Chase’s estimated sack statistics to examine net yards for all post-1960 quarterbacks.

The math is simple: for each player, subtract his individual raw totals from those of every other quarterback in the league to find the league minus player (LMP) Y/A or NY/A. Next, subtract the LMP rates from the individual player rates to find each player’s marginal rate stats. Last, multiply each quarterback’s marginal Y/A by his attempts (or marginal NY/A by his dropbacks) to find marginal yards (or marginal net yards). [1]It took as much time to explain as it did to set up in Excel.

Enough explanation – Let’s look at some stats. The first table displays the 1,563 qualifying QB seasons, sorted by marginal yards. Read it thus: In 2001, Kurt Warner threw 546 passes for 4,830 yards, giving him 8.85 Y/A. The average of the rest of the league was 6.69, so Warner had a marginal Y/A of 2.15. This means his 2001 season is worth 1,176 yards above expectation. [continue reading…]

References

References
1 It took as much time to explain as it did to set up in Excel.
{ 55 comments }

Bryan Frye, owner and operator of the great site http://www.thegridfe.com, is back for another guest post. You can also view all of Bryan’s guest posts at Football Perspective at this link, and follow him on twitter @LaverneusDingle.


Last Wednesday, Chase unveiled his estimated sack numbers for 1960-1968. [1]I can neither confirm nor deny that he did this, at least in part, to give Joe Namath some love. I already had this post planned, but I wanted to wait for the estimated stats before running the numbers, as doing so would allow me to go back to 1960 instead of 1969.

This article, “Upright Citizens (Quarterbacks who Avoided Sacks)” is a brief examination of those quarterbacks who saved their teams valuable field position by avoiding sacks. By extension, it is also an examination of those quarterbacks who did the opposite. When Chase presented his 1960-1968 data, he included everyone who threw a pass during that timeframe. Because I am only concerned with quarterbacks, I have removed all non-quarterback plays and recalculated the metrics. [continue reading…]

References

References
1 I can neither confirm nor deny that he did this, at least in part, to give Joe Namath some love.
{ 21 comments }

You remember the November 20th game between the Bears and Lions in 1960, right? If you look at the boxscore on PFR, you will see that Detroit quarterback Jim Ninowski was 10 for 26 for 121 yards with 0 touchdown passes and 2 interceptions. You’ll also see that the Lions as a team went 10 for 26 for 121 yards with 0 touchdown passes, 2 interceptions, and 12 sacks for 107 yards. But the PFR boxscore does not indicate how many sacks Ninowski took that game, because the individual game log data wasn’t kept on that metric.

But, you know, I’m a pretty smart guy. I have a feeling that Ninowski was probably sacked 12 times in that game for 107 yards. I could be wrong, of course — maybe a backup came in and took two dropbacks, and was sacked on both of them — but it seems like making a good faith effort here is better than ignoring it completely. [continue reading…]

{ 10 comments }

Through 48 starts, Russell Wilson has been pretty darn good. Since Wilson entered the league, he ranks 5th in ANY/A and tied for 2nd in wins. The idea of measuring quarterback by wins is a curious one, especially in the case of Wilson, who has benefited from a historically dominant defense. No, Wilson is not a great quarterback because his team has won 36 games over the last three years.

On the other hand, analysts can go too far in the other direction. For example, among the 31 quarterbacks to play in 24 games and throw 500 passes since 2012, Wilson ranks just 24th in passing yards per game. Some could use that statistic, or another variation, to argue that Wilson hasn’t been responsible for much of his team’s success. But that ignores that Wilson leads all quarterbacks in rushing yards since 2012, and ranks 3rd among those 31 quarterbacks in rushing yards per game. It also ignores the fact that Seattle has run the 5th fewest plays of any team over the last three years.

So how about this stat: over the last three years, Wilson has been responsible for two-thirds of all Seahawks yards. How does that compare to other quarterbacks through 48 starts? And how many wins did those quarterbacks have? [continue reading…]

{ 70 comments }

Passing By Uniform Number

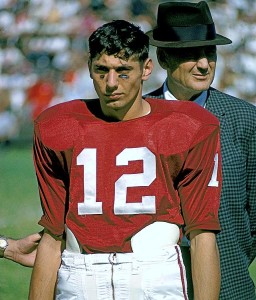
Namath BearMost people know about quarterbacks and the number 12. Even if you didn’t know where it started — Al Dorow of the New York Titans made the Pro Bowl in ’61 wearing number 12, while Charley Johnson of the St. Louis Cardinals was the first #12 to throw for 3,000 yards, doing so in 1963 and 1964 — you can probably recite most of the history from there. John Brodie, who entered the NFL in 1957, was the first great #12, while Joe Namath took the number to iconic status in the late ’60s. It was popularized by Roger Staubach (who also wore 12 at Navy in the early ’60s), Bob Griese, Terry Bradshaw, and Ken Stabler in the ’70s. [1]And, sadly, not popularized by Greg Cook. That means the Super Bowl winning quarterback wore #12 for nine straight years, beginning with Super Bowl VI. Doug Williams even wore it in Tampa Bay, although punter Steve Cox forced Williams to don #17 when in Washington.

Lynn Dickey wore it for the Packers in the early ’80s, while Randall Cunningham and Jim Kelly repped #12 later in the decade. Stan Humphries made it to the Super Bowl wearing #12 with the Chargers, while Erik Kramer set the still-standing franchise records for passing yards and passing touchdowns in a season while wearing #12 for the Bears in 1995. The only time a Ravens quarterback threw for 4,000 yards or 30 touchdowns was when Vinny Testaverde wore #12 in 1996. Chris Chandler took the Falcons to the Super Bowl in 1998 wearing #12, while Rich Gannon became the second great Raiders quarterback to wear twelve a year later.

And since then, three guys you might have heard of have worn #12: Tom Brady, Aaron Rodgers, and Andrew Luck.

Since 1950, players wearing #12 have thrown for 675,044 yards. No other number has yet to hit the 500,000-yard mark. But that brings us to today’s trivia: Which number has produced the second most passing yards since 1950? [continue reading…]

References

References
1 And, sadly, not popularized by Greg Cook.
{ 11 comments }

In 2012 and 2013, I looked at which passers were most effective on third and fourth downs; today, we examine those numbers for 2014. Throughout this article, when I refer to “third downs” or “third down performance”, note that such language is just shorthand for third and fourth downs.

To grade third down performance, I included sacks but discarded rushing data (in the interest of time, not because I thought that to be the better approach). The first step in evaluating third down performance is to calculate the league average conversion rate on third downs for each distance. Here were the conversion rates in 2014, along with the smoothed (linear) best-fit rates: [continue reading…]

{ 36 comments }

There are 23 quarterbacks who have won both a championship (as a starter) and a Most Valuable Player award in professional football history. Can you name them? First, let’s get to the fine print:

  • To determine championships, I began in 1936. I awarded half a ring to each of the championship quarterbacks in the AAFC and NFL from 1946 to 1949, and half a ring to the two championship quarterbacks in the AFL and NFL from 1960 to 1965. For purposes of this post, I am including all quarterbacks with “half a ring”, but when I list career totals, keep the half-ring idea in mind.
  • Based on sharing of quarterback duties, I awarded half-rings to the quarterbacks on the NFL champions in 1939, 1951, 1972, and 1990. For the NFL champion in 1970, I also awarded half a ring to that team’s top two quarterbacks, since the starter left while trailing in the Super Bowl. If you disagree with my awarding of half rings in this manner, don’t worry about.  I’ve spelled out the relevant information in the post below, so feel free to manipulate the system as you desire.  If so inclined, you can dismiss the early AFL years or give full credit to both MVPs in a particular season, for example.
  • For MVPs, I used the Joseph F. Carr award from ’38 to ’46. Then I used the UPI for the next ten years, or the Washington D.C. Touchdown Club award when the UPI didn’t name an MVP. Those years were 1947 (which, as it turns out, was one of the easiest seasons to identify), 1949, 1950, and 1952. Then I used the AP for every year since for simplicity’s sake (i.e., just using what is listed on PFR, not out of a misguided notion that the AP is the end-all, be-all source for MVP voting). I gave the AFL and NFL MVP half an award in each year from 1960 to 1969, and I also assigned only half credit to the shared MVPs in ’97 and ’03 (the award was also split in ’49).

[continue reading…]

{ 29 comments }

Brad Oremland is a longtime commenter and a fellow football historian. Brad is also a senior NFL writer at Sports Central. There are few who have given as much thought to the history of quarterbacks and quarterback ranking systems as Brad has over the years. What follows are Brad’s thoughts on a stat-based quarterback ranking system.


I recently concluded an eight-part series on the greatest quarterbacks in the history of professional football. Those rankings were subjective, based on everything I know about the players: stats, awards and honors, coaching and teammates, team success and postseason performance, reputation, the eye test, and so forth.

But I also have a method for classifying quarterbacks statistically. I actually published the results of this formula three months ago, but without revealing the process that produced those results. A number of readers were curious about my methodology, and in this post, I’ll finally explain how the sausage gets made. The math is not complicated — you don’t need a stats background to understand this — but there’s a lot of it: you could calculate most of this with a pencil and paper, but by the end, you’re going to want a spreadsheet. [continue reading…]

{ 34 comments }

What was the most dominant fantasy season of all time? You might think Peyton Manning 2013, but let me throw out another candidate: Steve Young, 1998.

I am using the following scoring system throughout this series: 1 point per 20 yards passing, 1 point per 10 yards rushing/receiving, 4 points per passing TD, 6 points per rushing/receiving TD, 0.5 points per reception.

In 2013, Manning threw for 5,477 yards and 55 TDs with just 10 interceptions, while rushing for -31 yards but with one TD. That comes out to 486.75 fantasy points. In 1998, Young threw for 4,170 yards with 36 TDs and 12 INTs, but also ran for 454 yards and 6 TDs. That is equal to 421.90 fantasy points. So, advantage Manning.

But we measure fantasy dominance “not by the number of points he scores[, but] by how much he outscores his peers at his particular position.” Those are the words of Joe Bryant in his famous VBD article, and I’ll make an appendix to that for historical purposes: the key is how much a player outscores his peers at his particular position in that particular year.

When calculating VBD scores, the standard is to use the 12th-ranked quarterback. In 2013, the 12th=-ranked QB scored 309.2 fantasy points, which means Manning outscored him by 177.55 fantasy points (or we could say that Manning produced 178 points of VBD). In 1998, the 12th-ranked quarterback scored just 235.6 fantasy points, which means Young finished with 186.3 points of VBD. So, advantage, Young.

But there’s another piece of the puzzle that tips the scales even more towards the 49ers quarterback. In 1998, Young missed one game. For fantasy purposes, it’s more valuable to have a quarterback produced X points in 15 games than it is for him to produce X points in 16 games, because you can play someone else during that 16th game. [continue reading…]

{ 29 comments }

On Sunday, I calculated the average number of pass attempts (including sacks) per game for each season since 1950, and then looked at which were the highest era-adjusted passing games in football history. On Monday, I looked at the single seasons that were the most and least pass-happy, from the perspective of each quarterback and after adjusting for era. Today, career grades.

How much do you know about Frank Tripucka? Probably not that much. If you’re a younger fan, you might know him because Denver “unretired” his #18 when Peyton Manning came to town, or because his son Kelly played in the NBA.

If you’re a Football Perspective regular, you may recall that he was the first quarterback in pro football history to throw for 3,000 yards in a season. [1]And by first, I mean that in the most literal sense: in 1960, Tripucka, playing in the AFL and a 14-game season, crossed the 3,000 yard mark in the final game of the season. For Denver, that … Continue reading Well, after today, you’re never going to forget about Tripucka.

I looked at all quarterbacks who started at least 48 regular season games since 1950. [2]For quarterbacks who played prior to 1950, like Tripucka, they are included, but only their post-1950 stats are counted. As a reminder about the methodology, I then calculated the league average dropbacks per game (i.e., pass attempts + sacks) in each season. Then, I determined the number of dropbacks by each quarterback’s team in each game started by that quarterback.

Then, I compared that number to league average to determine the ratio. Do this for every game of a quarterback’s career, and viola, career ratings! Here’s how to read the table below. Tripucka started 50 games in his career since 1950. In those games, his teams averaged 38.5 dropbacks per game, while the league average was 31 dropbacks. As a result, Tripucka’s teams in games he started finished with 124% as many pass attempts as the average team, or 7.5 more attempts per game. That makes him the most pass-happy quarterback ever. The final column shows whether the quarterback is in, or very likely to wind up in, the Hall of Fame. [3]Note that I have included Peyton Manning, Tom Brady, Drew Brees, Brett Favre, Kurt Warner, and Aaron Rodgers as HOF quarterbacks for these purposes. This is not based on my subjective opinion … Continue reading [continue reading…]

References

References
1 And by first, I mean that in the most literal sense: in 1960, Tripucka, playing in the AFL and a 14-game season, crossed the 3,000 yard mark in the final game of the season. For Denver, that happened to be a Saturday. The next day, another AFL quarterback, Jack Kemp, crossed the 3,000-yard threshold with the Chargers. The AFL opened with a 14-game schedule to get a jump on the NFL, which was still playing a 12-game schedule in 1960. The NFL’s regular season ended at the same time, and Johnny Unitas became the first NFL passer to hit 3,000 yards on the same day as Kemp.
2 For quarterbacks who played prior to 1950, like Tripucka, they are included, but only their post-1950 stats are counted.
3 Note that I have included Peyton Manning, Tom Brady, Drew Brees, Brett Favre, Kurt Warner, and Aaron Rodgers as HOF quarterbacks for these purposes. This is not based on my subjective opinion of those players, but based on my subjective opinion of their likelihoods of enshrinement. If one was to sort by the HOF category, I thought it would be more useful to have them as a “Yes” than as a “No.” Your mileage may vary.
{ 25 comments }

Yesterday, we looked at which teams had the most pass attempts (including sacks) in individual games relative to league average. Today, we will analyze things on the season level.

Let’s use Tobin Rote as an example. As Brad Oremland noted, Rote was stuck playing for terrible Packers teams in the ’50s that were weak on defense and light at running back. In 1951, Green Bay ranked 12th in the 12-team NFL in rushing attempts, rushing yards, and rushing touchdowns, and 11th in points allowed and yards allowed. The Packers often went with just one running back in the backfield — a rarity in those days — which is a sign that the emphasis on the passing game wasn’t just a result of the team’s losing record. Green Bay also went with a quarterback-by-committee approach: Rote started 11 of 12 games, but he finished the year with 256 pass attempts, while backup Bobby Thomason had 221. Individually, neither had great numbers, but together, they helped Green Bay finish with 50 more pass attempts than any other team in football.

The method I used yesterday, and will be using throughout this series, is to give the starting quarterback credit for all team pass attempts in that game. The reason? If a quarterback gets injured and finishes a game with just 5 attempts, that will kill his average in a misleading way. That would do more harm, I think, than giving him credit for all attempts in the game. But that decision has its drawbacks, and in particular, it seems ill-suited for teams in the early ’50s that employed a QBBC approach. This is particularly relevant here, because “Rote’s” 1951 season checks in as the most pass-happy on our list.

So the Rote line for ’51 should really be thought of as Rote and Thomason. Rote’s 1956 season also makes the top ten, and there’s no fine print necessary there. Rote started 11 of 12 games and threw 308 passes, while Bart Starr started the remaining game and had just 44 attempts that season. The ’56 Packers were not very good, ranking last in both points and yards allowed, and last in rushing attempts, too.

The table below shows the top 300 seasons (minimum 7 games started) in terms of pass attempts relative to league average. You can use the search function to see that Rote’s season in 1954 with Green Bay also makes the cut. To explain what’s in the table below, let’s use season #15 on the list, Shane Matthews in 1999, as an example. That year, Matthews started 7 games, but in those games, the Bears averaged an incredible 47.1 dropbacks per game, the second highest rate ever. Matthews shared some snaps with rookie Cade McNown that year, so you wouldn’t know it just by looking at Matthews’ raw numbers, but the ’99 Bears were insanely pass-happy under Gary Crowton. The league average was 36.3 dropbacks per game, so the Bears in “Matthews games” were 10.8 attempts above average, and 129.8% above league average. [continue reading…]

{ 6 comments }

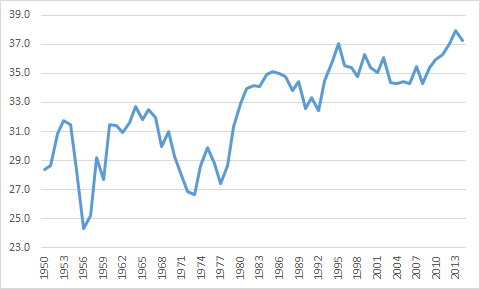
Let’s take a look at the league average dropbacks (pass attempts + sacks) per game for each year from 1950 to 2014.

dropback per game [continue reading…]

{ 22 comments }

Brad Oremland is a longtime commenter and a fellow football historian. Brad is also a senior NFL writer at Sports Central. There are few who have given as much thought to the history of quarterbacks and quarterback ranking systems as Brad has over the years. What follows is Brad’s latest work on the greatest quarterbacks of all time.

Part I: Pre-Modern Era
Part II: 49-101
Part III: 40-48
Part IV: 31-39
Part V: 21-30
Part VI: 11-20
Part VII: 6-10
Part VIII: 1-5


I’ve been studying NFL history my whole life, but until this year, I never published my list of the greatest quarterbacks in NFL history. This is the final installment in an eight-part series, so let’s review the list thus far.

The best pre-Modern Era quarterbacks: Sammy Baugh, Dutch Clark, Ed Danowski, Paddy Driscoll, Benny Friedman, Arnie Herber, Cecil Isbell, Sid Luckman, Bernie Masterson, Ace Parker, and Bob Waterfield. [continue reading…]

{ 488 comments }

A couple of years ago on the July 4th holiday, I looked at each team’s franchise nemesis in a number of statistics. Let’s revisit that, beginning today with passing yards and passing touchdowns.

You won’t be surprised to know that John Elway has thrown for more yards against the Chiefs, Chargers, Raiders, and Seahawks — his four division rivals — than any other player has gained against those four teams. Similarly, Dan Marino has thrown for more yards against the Bills, Jets, Patriots, and Colts than any other quarterback. Brett Favre threw for more yards than anyone else against the Lions, Bears, and Vikings (but not the Bucs), and Peyton Manning is the top nemesis for the Oilers/Titans franchise, the Jaguars, and the Texans.

Drew Brees is the big enemy of the Bucs, Panthers, and Falcons, while Ben Roethlisberger is the top passer against the Ravens, Bengals, and Browns. Perhaps more surprising is that Eli Manning has already thrown for more yards against Philadelphia, Washington, and Dallas than any other quarterback: that’s particularly surprising since he wasn’t #1 against any of those teams two years ago.

One that always kind of surprises me is seeing Johnny Unitas as number 1 against the 49ers, but it does make some sense. My guess is you could win quite a few bar bets with that one. Here’s the full list, which includes all passing yards thrown by each quarterback against each of the 32 teams (and includes playoff games): [continue reading…]

{ 6 comments }

Brad Oremland is a longtime commenter and a fellow football historian. Brad is also a senior NFL writer at Sports Central. There are few who have given as much thought to the history of quarterbacks and quarterback ranking systems as Brad has over the years. What follows is Brad’s latest work on the greatest quarterbacks of all time.

Part I: Pre-Modern Era
Part II: 49-101
Part III: 40-48
Part IV: 31-39
Part V: 21-30
Part VI: 11-20
Part VII: 6-10
Part VIII: 1-5


This week, I’m profiling the players who rank 6-10 on my list, counting down toward number one. Please note: at this point, we’re talking about the best of the best QBs. When I mention a player’s weaknesses, I’m not trying to insult him, just explaining why he doesn’t rate even higher.

10. Roger Staubach
Dallas Cowboys, 1969-79
22,700 yards, 153 TD, 109 INT, 83.4 rating

Roger Staubach was the best quarterback of the 1970s. He led all passers in rating and in TD/INT differential (+45), the latter nearly doubling a second-place tie between Fran Tarkenton and Kenny Anderson (+24). Despite playing only eight full seasons, Staubach also ranked among the top three QBs of the ’70s in both passing yards and rushing yards. He was the first-team QB on the NFL’s All-1970s Team.

Staubach’s statistics are exceptional. He led the league in passer rating four times, and retired with the highest rating in NFL history. Staubach was distinguished by his combination of short-range and downfield accuracy. Throwing underneath, he hit the receiver in stride, but he was also a great downfield passer. A dangerous dual-threat, Staubach was also known for his running, an ability that earned him the nickname “Roger the Dodger.” Staubach rushed for 2,204 yards and 19 TDs, ranking among the top 10 rushing QBs every full season of his career. [continue reading…]

{ 186 comments }

Brad Oremland is a longtime commenter and a fellow football historian. Brad is also a senior NFL writer at Sports Central. There are few who have given as much thought to the history of quarterbacks and quarterback ranking systems as Brad has over the years. What follows is Brad’s latest work on the greatest quarterbacks of all time.

Part I: Pre-Modern Era
Part II: 49-101
Part III: 40-48
Part IV: 31-39
Part V: 21-30
Part VI: 11-20
Part VII: 6-10
Part VIII: 1-5


This week, I’m profiling the players who rank 11-20 on my list, counting down toward number one. Please note: at this point, we’re talking about the best of the best QBs. When I mention a player’s weaknesses, I’m not trying to insult him, just explaining why he doesn’t rate even higher.

20. Y.A. Tittle
Baltimore Colts, 1948-50; San Francisco 49ers, 1951-60; New York Giants, 1961-64
33,070 yards, 242 TD, 248 INT, 74.3 rating

Y.A. Tittle retired as the all-time leader in passing yards and passing TDs. Those are holy marks, passed from Tittle to Johnny Unitas, then to Fran Tarkenton and Dan Marino, on to Brett Favre and now on their way to Peyton Manning. Tittle led the NFL in passing touchdowns three times — including 36 in 1963, a record that lasted more than 20 years. [continue reading…]

{ 76 comments }

Three years ago on Father’s Day, I posted a trivia question about the first quarterback to get to 100 losses. I won’t spoil that for new readers, and older readers have bad memories so you can try your hand at that trivia question again.

Today, a different trivia question: Who was the first quarterback to get to 100 wins?

Trivia hint 1 Show


Trivia hint 2 Show


Trivia hint 3 Show


Click 'Show' for the Answer Show

Unitas was the career record holder for about nine years. Then, on October 1st, 1978, Fran Tarkenton and the Vikings beat the Buccaneers in Tampa Bay. That marked the 119th victory of Tarkenton’s career, breaking the tie with Unitas set one week earlier. Tarkenton would win five more games in ’78, his final season in the NFL.

Tarkenton was the NFL’s winningest quarterback for 18 years. On December 1st, 1996, John Elway and the Broncos crushed the Seahawks, 34-7. In the process, Elway picked up his 125th career victory. When he set the record, Elway held only a narrow lead in the wins department over Dan Marino. But the ’97 and ’98 seasons were good to him, and Elway retired with 148 career wins. Marino played for one more year, but retired one shy, with 147 career wins.

Elway held the record for just over ten years. That was until Brett Favre, in a 35-13 win over the Giants, won his 149th career game.

Favre retired with 186 wins. And right now, Peyton Manning enters the 2015 season with 178 wins. It would be a surprise if Manning doesn’t edge out Favre this season, which would make Favre — at 8 years — the man who held the title of ‘winningest quarterback’ for the shortest amount of time. How long will Manning hold the record? That will depend on Tom Brady, who has 160 wins. Will Brady play long enough to eclipse Manning? Whichever of the two winds up on top will hold the record for the foreseeable future, especially if they extend it out to 200 wins.

{ 3 comments }

Brad Oremland is a longtime commenter and a fellow football historian. Brad is also a senior NFL writer at Sports Central. He’s contributed today’s guest post, and we thank him for that. This one is certainly thought-provoking.


I recently ranked Doug Flutie 31st among the greatest quarterbacks of all time, ahead of accomplished players like Kurt Warner, Boomer Esiason, and Ben Roethlisberger. Perhaps predictably, the unconventional ranking for Flutie generated questions, comments, and plain disagreement. I hope this follow-up will clear some of the confusion and help readers understand my reasoning.

I was attempting to rank the greatest quarterbacks ever — not just the best NFL quarterbacks — and this was not a stat-based evaluation. Statistics play a large role in the assessment of players, but they do not form an exclusive basis for it. When I rated Flutie ahead of Warner and company, I wasn’t suggesting that he had a better NFL career than those players, just that he was a better quarterback.

Here’s a breakdown of Flutie’s career:

* New Jersey Generals, 1985 (USFL)
* Chicago Bears, 1986-87
* New England Patriots, 1987-89
* BC Lions, 1990-91 (CFL)
* Calgary Stampeders, 1992-95 (CFL)
* Toronto Argonauts, 1996-97 (CFL)
* Buffalo Bills, 1998-2000
* San Diego Chargers, 2001-04
* New England Patriots, 2005 [continue reading…]

{ 38 comments }
Next Posts Previous Posts