≡ Menu

Brad Oremland is a longtime commenter and a fellow football historian. Brad is also a senior NFL writer at Sports Central. He’s contributed today’s guest post, and we thank him for that. This one is certainly thought-provoking.


I recently ranked Doug Flutie 31st among the greatest quarterbacks of all time, ahead of accomplished players like Kurt Warner, Boomer Esiason, and Ben Roethlisberger. Perhaps predictably, the unconventional ranking for Flutie generated questions, comments, and plain disagreement. I hope this follow-up will clear some of the confusion and help readers understand my reasoning.

I was attempting to rank the greatest quarterbacks ever — not just the best NFL quarterbacks — and this was not a stat-based evaluation. Statistics play a large role in the assessment of players, but they do not form an exclusive basis for it. When I rated Flutie ahead of Warner and company, I wasn’t suggesting that he had a better NFL career than those players, just that he was a better quarterback.

Here’s a breakdown of Flutie’s career:

* New Jersey Generals, 1985 (USFL)
* Chicago Bears, 1986-87
* New England Patriots, 1987-89
* BC Lions, 1990-91 (CFL)
* Calgary Stampeders, 1992-95 (CFL)
* Toronto Argonauts, 1996-97 (CFL)
* Buffalo Bills, 1998-2000
* San Diego Chargers, 2001-04
* New England Patriots, 2005 [continue reading…]

{ 38 comments }

Brad Oremland is a longtime commenter and a fellow football historian. Brad is also a senior NFL writer at Sports Central. There are few who have given as much thought to the history of quarterbacks and quarterback ranking systems as Brad has over the years. What follows is Brad’s latest work on the greatest quarterbacks of all time.

Part I: Pre-Modern Era
Part II: 49-101
Part III: 40-48
Part IV: 31-39
Part V: 21-30
Part VI: 11-20
Part VII: 6-10
Part VIII: 1-5


This week, I’m profiling the players who rank 21-30 on my list. The players are ranked in order, but please don’t read too much into that: I consider this a group of quarterbacks, all roughly the same level. If you’re outraged that #26 is higher than #29, you have my blessing to flip them.

30. John Brodie
San Francisco 49ers, 1957-73
31,548 yards, 214 TD, 224 INT, 72.3 rating
[continue reading…]

{ 110 comments }

There were 220 touchdown passes thrown during the 1950 season. Let’s break down who threw those scores into three categories:

  • 22 were thrown by players who were not playing professional football in 1949, including rookies like Tobin Rote and Adrian Burk.

Now, for some perspective, note that in 1949, there were 10 NFL teams and 7 AAFC teams. [1]Historians might recall that the AAFC was an 8-team league. That’s generally true, but the Brooklyn Dodgers merged with the New York Yankees prior to the ’49 season. And yes, both of … Continue reading All else being equal, with just one merged league in 1950, you might expect the splits to be along the lines of 59% NFL, 41% AAFC. The above data looks as though this would support the widely-held notion that the NFL was the superior league. [2]Although, frankly, I’m not even sure if this would support the case nearly as much as many would suggest, since discarding the AAFC entirely is acceptable to some observers. But if you dive a little bit deeper into the analysis, you get a slightly different picture: [continue reading…]

References

References
1 Historians might recall that the AAFC was an 8-team league. That’s generally true, but the Brooklyn Dodgers merged with the New York Yankees prior to the ’49 season. And yes, both of those teams were AAFC teams, not MLB teams.
2 Although, frankly, I’m not even sure if this would support the case nearly as much as many would suggest, since discarding the AAFC entirely is acceptable to some observers.
{ 7 comments }

Brad Oremland is a longtime commenter and a fellow football historian. Brad is also a senior NFL writer at Sports Central. There are few who have given as much thought to the history of quarterbacks and quarterback ranking systems as Brad has over the years. What follows is Brad’s latest work on the greatest quarterbacks of all time.

Part I: Pre-Modern Era
Part II: 49-101
Part III: 40-48
Part IV: 31-39
Part V: 21-30
Part VI: 11-20
Part VII: 6-10
Part VIII: 1-5


This week, I’m profiling the players who rank about 30-40 on my list. The players are ranked in order, but please don’t read too much into that: I consider this a group of quarterbacks, all roughly the same level. If you’re furious that #34 is higher than #37, you have my blessing to flip them.

39. Steve McNair
Houston/Tennessee Oilers/Titans, 1995-2005; Baltimore Ravens, 2006-07
31,304 yards, 174 TD, 119 INT, 82.8 rating

Mark Brunell, Rich Gannon, Jeff Garcia, and Steve McNair all played in the late ’90s and early ’00s, with low INT rates and excellent running. They’re easy to compare. The stats below include sacks:

McNair has the lowest passer rating, but the most net yards (33,327) and the most total touchdowns (211). He and Brunell had the most good seasons, he and Gannon were named NFL MVP, and McNair stands alone as a playmaking scrambler. Only five players in NFL history have 30,000 passing yards and 3,000 rushing yards: John Elway, Donovan McNabb, Fran Tarkenton, Steve Young, and Steve McNair. As a dual-threat QB, McNair was one of the finest ever to play. His 64 rushing yards in Super Bowl XXXIV is the record for quarterbacks. [continue reading…]

{ 98 comments }

Brad Oremland is a longtime commenter and a fellow football historian. Brad is also a senior NFL writer at Sports Central. There are few who have given as much thought to the history of quarterbacks and quarterback ranking systems as Brad has over the years. What follows is Brad’s latest work on the greatest quarterbacks of all time.

Part I: Pre-Modern Era
Part II: 49-101
Part III: 40-48
Part IV: 31-39
Part V: 21-30
Part VI: 11-20
Part VII: 6-10
Part VIII: 1-5


This week, I’m profiling the players who rank about 40-48 on my list, in alphabetical order:

Charlie Conerly
New York Giants, 1948-61
19,488 yards, 173 TD, 167 INT, 68.2 rating

The hype was always there for Chuck Conerly. He was a star at Ole Miss, and he was the Giants’ quarterback when they were the only team in New York. Playing for a coaching staff that included Tom Landry and Vince Lombardi, alongside Hall of Fame players like Rosey Brown, Frank Gifford, Sam Huff, Andy Robustelli, and Emlen Tunnell, Conerly was set up for success. The Giants were competitive every season, and they won an NFL championship in 1956. [continue reading…]

{ 11 comments }

Quarterback Rushing Data Since 1950

The 2007 season was the ultimate fantasy of the immobile quarterback lover. No quarterback rushed for 400 yards, after at least one quarterback did so in each of the ten prior seasons. Just as importantly, the top quarterbacks were all pocket passers: Tom Brady, Drew Brees, Tony Romo (only 129 rushing yards that season), Brett Favre, Jon Kitna, Peyton Manning, Matt Hasselbeck, Derek Anderson, Jay Cutler, Kurt Warner, and Eli Manning were the top 12 leaders in passing yards. As a group, those dozen quarterbacks rushed for just 67 yards, led by Cutler’s staggering 205 rushing yards.

But it was only seven years earlier that the mobile quarterback wave was taking the NFL by storm. Six quarterbacks hit the 400-yard rushing mark: Donovan McNabb (629), Rich Gannon (529), Daunte Culpepper (470), Kordell Stewart (436), Jeff Garcia (414), and Steve McNair (403). Of the top ten leaders in passing yards, only Vinny Testaverde and Kerry Collins failed to rush for at least 100 yards, and the top 12 leaders in passing yards rushed for an average of 236 yards.

Since 2012, the mobile quarterback has re-emerged. So how do we test how much each quarterback has run since 1950? Here’s what I did. [continue reading…]

{ 5 comments }

Brad Oremland is a longtime commenter and a fellow football historian. Brad is also a senior NFL writer at Sports Central. There are few who have given as much thought to the history of quarterbacks and quarterback ranking systems as Brad has over the years. What follows is Brad’s latest work on the greatest quarterbacks of all time.

Part I: Pre-Modern Era
Part II: 49-101
Part III: 40-48
Part IV: 31-39
Part V: 21-30
Part VI: 11-20
Part VII: 6-10
Part VIII: 1-5


I’ve been studying NFL history throughout my life. It’s a journey that began the first time I watched my dad’s copy of NFL’s Greatest Hits on VHS, accelerating when I read Total Football II, and continuing when I began sportswriting over a decade ago.

Something I’ve never done is publish my list of the greatest quarterbacks in NFL history. I’m finally stepping into the ring. But because I’ve done so much research over the years, this is not a simple list. Instead, I’ll present my choices as a series of articles, highlighting about 10 players per list, and counting down to number one. We began last week, with quarterbacks who preceded the Modern Era, like Sammy Baugh and Sid Luckman. [continue reading…]

{ 43 comments }

You remember 2012, don’t you? Among quarterbacks with 200 pass attempts, Colin Kaepernick ranked 2nd in Adjusted Net Yards per Attempt, RG3 ranked 4th, and Cam Newton ranked a respectable 11th. The young quarterbacks — Kaepernick and Griffin were in their first years as starters, while Newton was just 23 — seemed poised to take over the NFL. If they were this good in 2012, how good would they be in 2014?

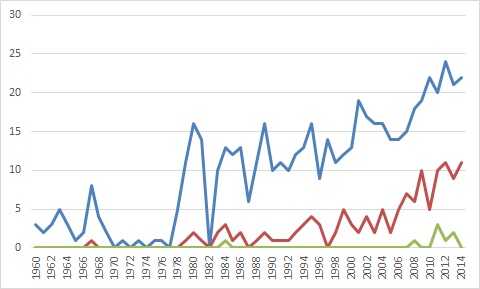
As it turns out, not all young quarterbacks improve gradually with age. Some even take a step back. Or, in the case of these three, two steps back. Take a look at their respective ANY/A ratings in each of the past three seasons:

In terms of Relative ANY/A — that is, ANY/A minus league average — Kaepernick has fallen from +1.6 to +0.8 to -0.6. Newton has had a similar decline but just from a lower starting point, dropping from +0.7 to -0.2 to finally -0.7. Griffin, of course, has seen the most dramatic change, going from +1.5 to -0.4 to -1.0 last year.

Each player has his own story. RG3 was lights out as a rookie, then struggled in 2013 seemingly as a result of tearing his ACL in the 2012 playoffs, a breakdown in his relationship with the Shanaclan, and [insert your other favorite reason here]. His descent continued in 2014, and he frankly looked like a lost quarterback, with this play being perhaps the most damning example.

For Newton, the issue seems to be entirely about a decline in his supporting cast, along with injury issues in 2014. I’m not particularly worried about Newton, who almost seems to make the cut (you’ll see what I mean below) on a technicality. I have little doubt that a healthy Newton with an improved supporting cast — you know, if we ever see that [1]Carolina’s projected 2015 offensive line, from left to right: Michael Oher, who may be the worst starting left tackle in the NFL; Andrew Norwell, an undrafted free agent who was a rookie last … Continue reading — would be a very productive quarterback. Kaepernick, to me, is the real wild card.

Kaepernick’s RANY/A dropped by 0.84 from 2012 to 2013, and then by 1.34 from 2013 to 2014. [2]The NFL ANY/A decreased slightly from 2012 to 2013, but then jumped by 0.26 last year, which is why you might not have noticed the true impact of the declines of Newton and Kaepernick based on just … Continue reading Which made me wonder: how often does a quarterback who is still in his 20s see a decline in RANY/A of at least 0.5 in consecutive years?

Since 1970, it has happened just 19 times, with Kaepernick, Newton, and Griffin being the most recent three. Newton and Griffin are also two of the three youngest, while Kaepernick is more in the middle of things (he was a sneaky old 27 in 2014). [3]Note that Jon Kitna is the only one of the players on the list to switch teams, moving from the Seahawks to the Bengals. So what happened to the first 16?

Six of them did not retain their jobs, and you can read about them in this footnote. [4]Aaron Brooks declined with New Orleans from 2003 to 2005, and then joined the Raiders. He was an even bigger disaster there: he failed to reach 200 pass attempts, but produced career-low numbers and … Continue reading What about the other 10?

There are some promising stories in here. Daunte Culpepper was great at age 23, decliend at age 24, was even worse at age 25, and then was great at age 26 and had a career year at age 27.

Dave Krieg had great efficiency numbers at age 25, pretty good (but worse) ones at age 26, and then struggled at age 27. But at age 28 he had a great season, and he had a great 9-game year at age 30.

Neil O’Donnell was a Pro Bowler in his first full year as a starter at age 26, but took steps backwards at ages 27 and 28. Then, at age 29, he had a career year and made it to the Super Bowl.

Neil Lomax was outstanding at age 25, then had RG3-like slides at ages 26 and 27. Then, at age 28, he had another great season, and followed it up with a great performance at age 29, too.

Jim Everett also took an RG3-like slide: he was unreal at age 26, but below average by age 28. He rebounded at age 29 and was above average during his age 31 and 32 seasons, too.

Ken O’Brien was lights out at age 25, worse at age 26, and then average at age 27. The age 25 year (1985) looks like the outlier, though: he stayed as a roughly league average quarterback from ages 28 through 31.

Jon Kitna looked completely washed up at age 29, but he rebounded with two solid statistical years at ages 30 and 31.

Boomer Esiason was the NFL MVP at age 27, still very good at age 28, and then just average at age 29. He had one more average year, then struggled at age 31 in his final year in Cincinnati, before a mini-resurrection with the Jets.

Trent Dilfer showed steadily decline from ages 25 to 27 during his final three years in Tampa Bay before… not really improving during his first year in Baltimore, despite you know, winning a Super Bowl. He did put up some impressive efficiency numbers over the next couple of seasons in part-time duty, however.

Mark Malone is an example of things not getting much better, but even he still rebounded at age 30 after declining at ages 28 and 29.

So What Does This Post Mean?

Well, let’s start with the obvious: it’s not common for a young quarterback to take consecutive steps backwards, and we have three of them that have done so since 2012. Kaepernick, at least to me, is the most intriguing of the bunch, as it’s harder (at least for me) to really understand what’s going on there. I have a pretty good idea of where Newton’s career is headed, and Griffin seems destined for failure in Washington (and perhaps beyond), while Kaepernick truly appears to be at a crossroads.

The table above presents overwhelmingly positive news if you are a 49ers fan. Could Kaepernick have a revival the way Culpepper did in 2003 and 2004? Could he turn into an above-average quarterback like Lomax or Everett? Eight of the ten quarterbacks who had declines like Kaepernick bounced back the following year. That’s promising.

Of course, it doesn’t mean all that much, either. Kaepernick is an individual, not an amalgamation of historical figures. And his struggles in San Francisco last year were very real, and didn’t appear to be a product of a poor supporting cast. And it’s not as though most of the news for the 49ers has been very positive this offseason, either.

But I guess if there’s one takeaway from this post, it’s this: even if a young quarterback struggles for a couple of years, the odds are in his favor that he’ll bounce back. For Newton, that seems like a safe bet. For Griffin, his ANY/A was so poor that an improvement seems very likely, too. For Kaepernick, the 2015 season looks like a real tipping point in his career, and one I can’t quite get a read on just yet.

References

References
1 Carolina’s projected 2015 offensive line, from left to right: Michael Oher, who may be the worst starting left tackle in the NFL; Andrew Norwell, an undrafted free agent who was a rookie last year; Ryan Kalil, a Pro Bowl center; Trai Turner, a third round pick in 2014; and Mike Remmers, an undrafted free agent in 2012 who has been on six teams so far. At wide receiver, the Panthers have Kelvin Benjamin, who was tied for 2nd in the NFL in drops last year; Jerricho Cotchery, whom the Jets released in 2010 because he looked washed up; Ted Ginn, Jr., who had 14 catches last year; and second round rookie Devin Funchess.
2 The NFL ANY/A decreased slightly from 2012 to 2013, but then jumped by 0.26 last year, which is why you might not have noticed the true impact of the declines of Newton and Kaepernick based on just their raw numbers.
3 Note that Jon Kitna is the only one of the players on the list to switch teams, moving from the Seahawks to the Bengals.
4 Aaron Brooks declined with New Orleans from 2003 to 2005, and then joined the Raiders. He was an even bigger disaster there: he failed to reach 200 pass attempts, but produced career-low numbers and never played again in the NFL after 2006. Don Majkowski and his numbers dropped off with the Packers from ’89 to ’90 and then from ’90 to ’91; he entered ’92 as the starter, but was hurt early in the third game. That allowed Brett Favre to take the job and never look back. The Packers quarterback before the Majik Man also made the cut: Randy Wright saw his RANY/A drop off from ’86 to ’87 and then ’87 to ’88; he never played again in the NFL.

Steve Grogan saw relatively modest drop offs in his RANY/A from ’79 to ’81; due to the strike and missing three games, he did not hit the 200 attempt cut-off in ’82, but he posted career-high efficiency numbers in ’82 and ’83. He’s our first success story. Pat Haden was excellent in 1977, declined in ’78, and then struggled at quarterback with the Rams in 1979; he lost the job to Vince Ferragamo, but after the ’80 season, Ferragamo went north to Canada. Haden played again in ’81, but posted career-low numbers. Haden started at least half his team’s games in five seasons, and incredibly, his ANY/A decreased in each year. And finally, Archie Manning saw his RANY/A drop from -0.1 in ’73 to -1.6 in ’74 and bottom out to -2.7 in ’75. He then missed all of ’76 due to shoulder surgery, but would turn in the best seasons of his career beginning in the late ’70s. He’s another promising sign, perhaps for Newton in particular, since both have been plagued with weak supporting casts.

5 Was on Baltimore in Year N+1.
6 Was on San Diego in Year N+1.
{ 6 comments }

Brad Oremland is a longtime commenter and a fellow football historian. Brad is also a senior NFL writer at Sports Central. There are few who have given as much thought to the history of quarterbacks and quarterback ranking systems as Brad has over the years. You may recall that in April, he gave us a sneak peak at some quarterback rankings. Today, we begin seeing the words behind those numbers, starting with the pre-modern era quarterbacks.

Part I: Pre-Modern Era
Part II: 49-101
Part III: 40-48
Part IV: 31-39
Part V: 21-30
Part VI: 11-20
Part VII: 6-10
Part VIII: 1-5


I’ve been studying NFL history throughout my adult life. It’s a journey that began the first time I watched my dad’s copy of NFL’s Greatest Hits on VHS, accelerating when I read Total Football II, and continuing when I began sportswriting over a decade ago.

Something I’ve never done is to publish my list of the greatest quarterbacks in NFL history. Sparked by Adam Steele’s crowd-sourcing project here at Football Perspective, I’m finally stepping into the ring. But because I’ve done so much research over the years, this is not a simple list. Instead, I’ll present my choices as a series of articles, highlighting about 10 players per list, and counting down to number one. [continue reading…]

{ 10 comments }

Quarterback Heat Maps

Since my running back heat maps post was so popular, I thought it made sense to perform the same analysis for quarterbacks. So here’s what I did. And as a reminder, BLUE means GOOD or above-average, while RED means BAD, or below-average.

I looked at all quarterbacks with at least 100 dropbacks (i.e., pass attempts + sacks) in 2014, and then measured on what percent of their dropbacks did each quarterback gain at least 0 yards [1]This is essentially a proxy for percentage of times the quarterback wasn’t sacked., at least 1 yard [2]This is a decent proxy for completion percentage, or, frankly, an improvement on completion percentage., at least 2 yards, etc., up to 10 yards. I also calculated the percentage of runs that went for at least 15+, 20+, 25+, and 30+ yards. [continue reading…]

References

References
1 This is essentially a proxy for percentage of times the quarterback wasn’t sacked.
2 This is a decent proxy for completion percentage, or, frankly, an improvement on completion percentage.
{ 6 comments }

Previously on “take away his X [best/worst]” plays:

In April, I noted that you would need to take away Peyton Manning’s best 19 passes in order to bring his stellar Net Yards per Attempt average to below league average. Today, we look at the reverse question: How many of Derek Carr’s worst dropbacks would we need to erase to bring his NY/A above league average? I’ll give you a moment to think about the answer. [continue reading…]

{ 8 comments }

In 2002, Rich Gannon, a former 4th round pick, led the NFL in passing yards. That year, Tom Brady (6th round), Trent Green (8th round), Aaron Brooks (4th round), and Jeff Garcia (undrafted) were in the top 11 in passing yards, while Jon Kitna (undrafted), Matt Hasselbeck (6th), and Brad Johnson (9th) all gained at least 3,000 passing yards, too.  You can find all that information here.  So in a year where only 17 quarterbacks threw for 3,000 yards, nearly half of them were drafted in the 4th round or later.

Ten years later, the quarterback landscape was very different. Other than Tony Romo, Brady, and Matt Schaub, all of the top 17 leaders in passing yards were drafted inside the top 35. Last year, Brady, Romo, and Russell Wilson were the only quarterbacks in the top 20 in passing yards not taken inside the first 36 picks (#36 was the draft slot for both Bay area quarterbacks, Colin Kaepernick and Derek Carr).

But those are just three isolated years.  How does the trend look over time? Here’s what I did.

1) Convert each player’s draft pick selection to its draft value.

2) For each player with passing yards in a season since 1970, calculate their percentage of league-wide total passing yards.

3) Multiply that number by each player’s draft value. Then sum those values to get a weighted-average of the draft value for each quarterback.

Here are the results: the number on the Y-Axis may not mean much to you in the abstract (it’s the weighted average draft value), but it’s the shape of the curve that’s important.

draft val QBs

As a general rule, the modern passing attack barely resembles what was going on in the early ’70s, but there is at least one exception: an emphasis on quarterbacks that were highly drafted.  For example, an overwhelming number of early draft picks are at the top of the passing charts from 1972[1]Note that for players who went in both the AFL and NFL drafts, I assigned the better pick to them.  That trend didn’t hold for very long, though.  Then, in the early ’90s, things peaked again for highly drafted quarterback.  In 1994, five of the top seven passers were former top 3 picks, with the other two going in the top 33 selections.

My hunch is that this trend is going to stick around this time: once Brady and Romo retire, there may not be much out there other than Wilson (and perhaps Nick Foles) when it comes to quarterbacks drafted outside of the top 40.  This year, Buffalo, Houston, and Cleveland may be going with quarterbacks that were not highly drafted, but those appear to be short-term solutions, anyway.   And, at least for 2015, we have four top-2 picks that should boost the average. Carson Palmer should be back in Arizona after starting just 6 games last year, while Sam Bradford is a projected starter after missing all of 2014.  And we should also see Jameis Winston and Marcus Mariota helping to bring up last year’s average.

References

References
1 Note that for players who went in both the AFL and NFL drafts, I assigned the better pick to them.
{ 6 comments }

Yesterday, I was a guest on the Wharton Moneyball show on SiriusXM Channel 111 (@BizRadio111), discussing the NFL draft. As always, it was a lot of fun, but the hosts threw me a curveball in the final seconds:

Which will produce the best quarterback from the 2015 Draft — the Jameis Winston/Marcus Mariota group, or the field?

Now I am quite familiar with the value of taking the field in these sort of bets. We are prone to being overconfident in our ability to predict things, especially when it comes to the NFL Draft. But I still said I’d take Winston/Mariota and leave you with everyone else, and be reasonably confident that I would end up with the draft’s best quarterback.

But am I right? How far down the quarterback slots do you have to go in the average draft to find the best QB? Would taking the top two generally be enough?

This is, of course, a question without a clear answer because there is no objective answer to the question “who was the best quarterback in the [__] Draft?” It’s much too early to grade the 2013 or 2014 drafts, and you will get no shortage of debate as to whether Andrew Luck or Russell Wilson is the best quarterback from the 2012 draft. In 2011, Cam Newton was the first overall pick, but Andy Dalton and Colin Kaepernick were the 5th and 6th quarterbacks taken.

In 2010, Sam Bradford does appear to have been the best quarterback from that draft, and should be remembered that way absent Colt McCoy, Tim Tebow, or Jimmy Clausen having a magical career turnaround.

In 2009, getting the top two quarterbacks would give you Matthew Stafford and Mark Sanchez, while the field would give you…. Josh Freeman and Curtis Painter.

In 2008, the top two quarterbacks were Matt Ryan and Joe Flacco. The book is not yet written on which one of them will be remembered as the best, but we can say that both will wind up being better than the field of Chad Henne, Matt Flynn, and Josh Johnson.

In 2007, the quarterback class was… ugly. The top guy will probably go down as one of Trent Edwards (most starts, most wins, most yards), Kevin Kolb (a positive TD/INT ratio!), or Drew Stanton (highest ANY/A but only 12 starts). Although for our purposes, we don’t need to finely split hairs. That’s because it’s clear the top quarterback was not JaMarcus Russell or Brady Quinn, the top two quarterbacks in that draft. Score one for the field.

Say what you want about Jay Cutler, but he was the clear top quarterback of 2006. In fact, he has thrown for more touchdowns than the rest of the class combined! As the 11th overall pick, he doesn’t quite meet the spirit of today’s question, but he is part of the field technically. That’s because Vince Young and Matt Leinart were the 3rd and 10th selections.

We need not spend much time on 2005. It was Aaron Rodgers, the second quarterback selected. Although Rodgers was much closer to the field (Jason Campbell was taken 25th overall, one pick after Rodgers) than being the first pick (Alex Smith).

For 2004, we can at least ignore the pretend Eli Manning/Philip Rivers debate, but that doesn’t help us when Ben Roethlisberger is in the mix, too. Call this one a push between top 2 and the field.

In 2003, it’s easy: it was Carson Palmer, the first overall pick. Nobody else comes close. Well, I guess that depends how you define class: Tony Romo went undrafted that year. Does the field include undrafted quarterbacks?

In 2002, not only is the answer David Garrard, but I think it’s Garrard by a wide margin. Garrard had a winning record, the most yards, the most TDs, and the best ANY/A out of the group with him, Patrick Ramsey, Josh McCown, and the first and third overall picks: David Carr and Joey Harrington. Score another one for the field.

In 2001, it’s Drew Brees, who was the second quarterback selected, albeit 31 picks after Michael Vick.

For 2000, let’s put that one down for the field.

1999 isn’t particularly close: Donovan McNabb made six Pro Bowls and started for 11 years; Daunte Culpepper is the runner up with three and five, respectively. And we know about 1998. So that’s two more for the top two. [continue reading…]

{ 13 comments }

Bryan Frye, owner and operator of the great site http://www.thegridfe.com/, is back for another guest post. You can also view all of Bryan’s guest posts at Football Perspective at this link, and follow him on twitter @LaverneusDingle.


Last week, I posted a quarterback performance metric that accounts for both passing and rushing. The base stat, Total Adjusted Yards per Play, is easy to comprehend and easy to figure out yourself with basic box score data. My original post only included performance that occurred during or after the 2002 season, because I don’t have spike and kneel data going back further than that. For the sake of consistency, I wanted to maintain the same parameters when calculating career values.

Before we get into the tables, I’d like to first briefly talk about what these numbers are and what they are not.

The formula, in case you forgot: [continue reading…]

{ 22 comments }

Teams that select quarterbacks in the first round of the draft generally struggled in the passing department prior year, although not as much as you might think. On average, these teams [1]Since 1970, excluding quarterbacks taken in the supplemental draft, and including the 2015 Bucs. had a Relative ANY/A of -0.71, meaning those teams were 0.71 Adjusted Net Yards per Attempt below average. For reference, that’s right about where the 2014 Bears finished, and Chicago ranked 27th in the NFL in ANY/A last year.

There have been 91 teams that have selected a quarterback in the first round of the regular NFL Draft since 1970; the Tampa Bay Bucs are almost certainly going to be the 92nd. [2]Note: Kerry Collins, Tim Couch, and David Carr all were drafted by expansion teams in the first round. These examples are being deliberately excluded in this analysis. Every once in awhile, a good passing team will dip its toes into the quarterback waters and select a passer in the first round. Over this time period, there have been eight teams that had a RANY/A of at least +1.0 and then selected a quarterback in the draft.

The 2005 Packers are not that team. In ’04, Green Bay behind Brett Favre had a RANY/A of +1.42, which didn’t stop the franchise from drafting Aaron Rodgers in the first round in the following draft. But there are four other teams that had an even better RANY/A the year before selecting a quarterback in the first round during this period. Can you name the team with the best RANY/A? [continue reading…]

References

References
1 Since 1970, excluding quarterbacks taken in the supplemental draft, and including the 2015 Bucs.
2 Note: Kerry Collins, Tim Couch, and David Carr all were drafted by expansion teams in the first round. These examples are being deliberately excluded in this analysis.
{ 1 comment }

Bryan Frye, owner and operator of the great site www.thegridfe.com/, is back for another guest post. You can also view all of Bryan’s guest posts at Football Perspective at this link, and follow him on twitter @LaverneusDingle.


I spent a few weeks this offseason parsing out quarterback spike and kneel numbers from post-2002 play by play data. Chase published the findings, which I believe are a useful resource when trying to assess a QB’s stats. [1]For instance, 180 of Peyton Manning’s 303 rush attempts since 2002 have been kneels. He has lost 185 yard on those plays. Why in the world should we include those in his total output? … Continue reading Since I have the data available, I thought it would be good to use it.

Regular readers know Chase uses Adjusted Net Yards per pass Attempt as the primary stat for measuring quarterback performance. [2]It’s not perfect, but it’s at least easy to understand and calculate, and is not proprietary like DVOA, ESPN’s QBR, or PFF’s quarterback grades. I am going to do something similar, but I am going to incorporate rushing contribution as well. This is something Chase talked about doing awhile ago, but we didn’t have the kneel or spike data available. [3]For another thing Chase wrote on combining rushing and passing data — while (gasp) analyzing Tim Tebow — click here. I’ll call the end product Total Adjusted Yards per Play (TAY/P). The formula, for those curious: [4]I use 25 as the modifier for fumbles based on the idea that a QB fumble is worth roughly -50 yards, and fumble recovery is a 50/50 proposition.

[Yards + Touchdowns*20 – Interceptions*45 – Fumbles*25 + First Downs*9] / Plays, where

Yards = pass yards + rush yards – sack yards + yards lost on kneels
Touchdowns = pass touchdowns + rush touchdowns
First Downs = (pass first downs + rush first downs) – touchdowns
Plays = pass attempts + sacks + rush attempts – spikes – kneels [continue reading…]

References

References
1 For instance, 180 of Peyton Manning’s 303 rush attempts since 2002 have been kneels. He has lost 185 yard on those plays. Why in the world should we include those in his total output? Similarly, Ben Roethlisberger has spiked the ball 44 times, by far the most in the league since 2002. Why count those 44 “incomplete passes” in his completion rate?
2 It’s not perfect, but it’s at least easy to understand and calculate, and is not proprietary like DVOA, ESPN’s QBR, or PFF’s quarterback grades.
3 For another thing Chase wrote on combining rushing and passing data — while (gasp) analyzing Tim Tebow — click here.
4 I use 25 as the modifier for fumbles based on the idea that a QB fumble is worth roughly -50 yards, and fumble recovery is a 50/50 proposition.
{ 36 comments }

Quarterback Trivia: Going 1-2 in the NFL Draft

It seems likely that Florida State’s Jameis Winston will be the first pick in the 2015 Draft. And if he isn’t the first pick, that will probably be because Oregon’s Marcus Mariota went first overall.

It’s been three years since Andrew Luck and RG3 went 1-2 at the top of the draft; in fact, Luck is the last quarterback to go first overall, with Jadeveon Clowney and Eric Fisher being selected at the top of the last two drafts. The graph below shows what draft pick was used on the first (in blue) and second (in red) quarterbacks drafted in each year since 1967. [continue reading…]

{ 7 comments }

Brad Oremland is a longtime commenter and a fellow football historian. Brad is also a senior NFL writer at Sports Central. There are few who have given as much thought to the history of quarterbacks and quarterback ranking systems as Brad has over the years. Today, he’s contributed this guest post, but also is asking for your feedback. So please, help Brad and help us, in the comments, with your thoughts.


In recent weeks, Football Perspective has hosted some lively discussions about the greatest quarterbacks of all time. I like to think my approach to these issues is balanced, but it begins with statistics. I am always looking for ways to improve my analysis, and Chase has graciously invited me to post the results of my statistical rating system for quarterbacks.

This is not my personal list of the best quarterbacks in history. My subjective list differs, at time significantly, and I’ll post that next month. The list below is purely statistical, with three notable limitations:

1. It measures regular-season statistics only.

2. It covers the years 1946-2014. The modern quarterback position didn’t really exist prior to the mid 1940s.

2b. QBs who played prior to 1946 are omitted, even if they continued to play after the end of World War II. I don’t want a ranking that shows Sammy Baugh 65th, since it’s missing the first decade of his career. Players like Baugh, Sid Luckman, and Bob Waterfield are deliberately excluded.

3. Only seasons in the NFL, AFL, and AAFC count toward these rankings.

My purpose in posting this list is to ask for help. There are a lot of smart readers and commenters at this site, and I want you to critique my results.

I’m not showing my work yet: I’m not looking for a critique of my process, but of my results. Who’s too high? Who’s too low? You can identify individual players, or patterns. Wherever you think I messed up, I want to hear about it. Please keep in mind, though, that this is purely a stat-based list. It doesn’t represent my opinion, and it’s not slanted toward or against individual players or teams.

But just because this system is unbiased, that doesn’t make it perfect. It is definitely not perfect. But I’m comfortable making subjective adjustments, and that may create blind spots that prevent me from improving the formula. I’m asking you to evaluate the list below and judge where you think it is counterintuitive or inaccurate.

Are players from the ’70s overrated? Are contemporary players underrated? What about players from good teams, and players from bad teams? Are running QBs overrated? Underrated? How about game managers vs. downfield bombers? Is the system fair to them? Are one-year wonders overrated? Are compilers overrated? Players who threw a lot of TDs, a lot of interceptions, players who got sacked a lot? Wherever you think the system is off, I’m eager for your feedback.

Hopefully you find this list interesting, and you can expect a fuller explanation of my rankings in the future, but in the meantime, I appreciate your input and assistance. I included each player’s numerical score, which I realize isn’t in context yet, but it can give you a more precise idea than a simple ranking. Troy Aikman, Donovan McNabb, and Joe Namath, for instance, are effectively tied. Below are the top 125 QBs of the modern era, as ranked by my stat-based system: [continue reading…]

{ 72 comments }

Stafford wins the prize for best quarterback drafted by the Lions since 2000

Stafford wins the prize for best quarterback drafted by the Lions since 2000

There are some teams — the Lions, Jaguars, and Raiders come to mind — that have spent most of the last 15 years looking for their next quarterback of the future. And others that seem to ignore the position in the draft, either because they found a Tom Brady or Tony Romo in a haystack (to go along with some Drew Bledsoe) or organizational indifference to drafting quarterbacks (Chiefs, Saints).

Today, I want to quantify those numbers. At the top of every page at Football Perspective is a link to the Draft Pick Value Calculator, based on the values derived here and shown here. If we assign each draft pick its proper value, and then sum the values used to select quarterbacks by each team over the last 15 years, we can see which teams have devoted the most draft capital on quarterbacks.

Here’s how to read the chart below. Detroit leads the way in draft capital spent. The Lions have only selected five quarterbacks, but spent 78.4 points of Draft Value on passers. That averages out to 15.68 points of draft value spent on each quarterback, the second highest (to Jacksonville) among the 32 teams. The far right column displays each quarterback selected in the draft since 2000. [continue reading…]

{ 10 comments }

I previously looked at points per game by each quarterback in his starts and points per game allowed by each quarterback in his starts. Please check there for the fine print.

Today, we put it all together, for a list of points differential per game in games started by each quarterback.

Again, I’m short on time, so I will leave the commentary to you guys.

{ 9 comments }

Please see yesterday’s post for the fine print. The table below shows the average points per game allowed in games started by each quarterback, minimum 15 games (but the ranks only count for quarterbacks with 50 or more starts).

Again, I will leave the commentary to you guys.

{ 5 comments }

Aaron Rodgers has started 114 games (including playoffs) in his career. In those games, the Packers have averaged 28.5 points per game (including non-offensive scores), the highest average for any quarterback in his team’s starts in NFL history.

The table below shows the PPG average in each quarterback’s starts for all quarterbacks with at least 15 starts. However, since 15 is a pretty low cut-off, I only ranked players with 50 starts; if a player had fewer than 50 starts, I just gave him the same rank as the player above him in the table.

Here’s how to read the table below. Rodgers has started 114 games, his team has scored 28.5 points per game during those games, and he has produced a 76-38-0 record. That translates to a 0.667 winning percentage, and Rodgers is 38 games over 0.500.

I’m again short on time, so I will leave the commentary to you guys, and all the Rams fans out there.

{ 7 comments }

On Tuesday, I looked at quarterback records when their team allows 21 or more points.  Today, a look at records when scoring 21+ points.  I’m short on time, so today’s post will just be a quick data dump.  I leave the comments up to you!

Here’s how to read the table below. Tom Brady has played in 169 games (including playoffs) where his team has scored 21+ points, and he’s posted a 155-14-0 record in those games (translating to a 0.917 winning percentage). On average, teams win about 75% of their games when they score 21 or more points; as a result, we would have expected Brady to win 126.75 games, all else being equal. Since he’s won 155, this means he has won 28.25 more games than expected, the most in NFL history. In general, one might translate this to something like “this quarterback had a good defense.” Among active quarterbacks, Colin Kaepernick, Brady, Joe Flacco, Andy Dalton, and Jay Cutler have the best five winning percentages when scoring 21+ points. [continue reading…]

{ 21 comments }

Back in November, Cian Fahey tweeted me a simple question: “What is Alex Smith’s record in games where his D gives up 21 or more points?”

I made a note to run the numbers in the off-season, and guess what? It’s the off-season. Smith now holds a career record of 7-38-1 (including a 1-1 mark in the postseason) when his team [1]Yes, that is not the same thing as his defense. allows 21 or more points. That’s really bad, as it turns out. In fact, among quarterbacks who started such a game last year, only Ryan Fitzpatrick (5-43-0) has a worse career record. [continue reading…]

References

References
1 Yes, that is not the same thing as his defense.
{ 32 comments }

Career RANY/A Rankings

Adjusted Net Yards per Attempt is my preferred basic measurement of quarterback play. ANY/A is simply yards per attempt, but includes sacks and sack yardage lost, and provides a 20-yard bonus for touchdowns and a 45-yard penalty for interceptions.

RANY/A, or Relative ANY/A, measures a quarterback’s ANY/A average to league average. Let’s use Aaron Rodgers as an example. This past season, he threw 520 passes and gained 4,381 yards and 38 touchdowns, while throwing five interceptions and being sacked 28 times for 174 yards. That translates to an 8.65 ANY/A average, best in the NFL in 2014.

The league average rate in 2014 was a record-high 6.14 Adjusted Net Yards per Attempt; as a result, this means that Rodgers averaged 2.52 ANY/A above average, or had a RANY/A of +2.52. [1]Difference due to rounding. But that is just for one season. To measure Rodgers’ career RANY/A, we need to do that for every season of his career, and weight his RANY/A in each season by his number of dropbacks.

For example, Rodgers had 14.7% of his career dropbacks come in 2014, which means 14.7% of his career RANY/A is based off of the number +2.52. During his other MVP season in 2011, Rodgers had a RANY/A of 3.49 on just 10 fewer dropbacks; as a result, 14.4% of his career RANY/A is based off of +3.49. If you multiply his RANY/A in each year by the percentage of dropbacks he had in that season relative to his entire career, and sum those results, you will get a player’s career RANY/A. Here, take a look: [continue reading…]

References

References
1 Difference due to rounding.
{ 8 comments }

Today is a good day. Data collecting is difficult, but Bryan Frye has made life easier for all of us. Bryan, as you may recall, owns and operates his own great site at http://www.thegridfe.com/, where he focuses on NFL stats and history — and you should really check out his work. You can also view all of Bryan’s guest posts at Football Perspective at this link. You can follow him on twitter @LaverneusDingle. [continue reading…]

{ 9 comments }

Guest Posts: Immobile Quarterbacks

Longtime commenter Jason Winter has chimed in with today’s guest post. Jason is a part-time video game journalist and full-time sports fan. You can read more of him at his blog: https://jasonwinter.wordpress.com/, and follow him on twitter at @winterinformal.

As always, we thank Jason for contributing.


A couple months ago, Ryan Lindley had a historically bad postseason game. If he’d thrown just seven more passes in the regular season, he would have made history in another way, too.

Lindley threw 93 passes last season, while recording precisely zero rushes. There was nary a scramble, quarterback sneak, or even a kneeldown on his record for the 2014 season. At 6’3”, 229 lbs., he hardly seems the scrambling type, but he was also only 25 and was, shall we say, far from the best passer in the league. You’d think he might have resorted to using his legs at least once.

Lindley’s 93 passes gives him the second-most passes in a season for a player who recorded zero rushes. The record-holder is a somewhat better-known name: the recently deceased Earl Morrall, who recorded 99 pass attempts with the Colts in 1969 without a carry. On the one hand, Morrall was 10 years older than Lindley, though he was a fairly effective and semi-regular runner throughout his career, averaging 3.7 yards on 235 rushes in 255 career games. Lindley has thus far totaled seven yards on four carries, all coming in 2012. [continue reading…]

{ 6 comments }

Quarterbacks and Passing Milestones

The first 3,000 yard passer came in 1960, when Johnny Unitas reached such feat in the NFL and Jack Kemp and Frank Tripucka did so in the AFL. Joe Namath became the first 4,000-yard passer seven years later, and Dan Marino in 1984 was the first to reach 5,000 yards.

The graph below shows the number of 3,000 yard passers in blue, 4,000-yard passers in red, and 5,000-yard passers in green in each season since 1960.  As you can see — and no doubt already knew — passing productivity is on the rise:

YardPassers [continue reading…]

{ 11 comments }
Was this the best quarterback of his era?

Was this the best quarterback of his era?

There are a lot of great things about Football Perspective, but my favorite is the caliber of the commenters. The Football Perspective community is a great one, and has been going back to its days at the Pro-Foootball-Reference blog. In the recent Greatest QB of All Time, Wisdom of Crowds post, long-time commenters Kibbles and Brad O. got into a fascinating discussion in the comments about Norm Van Brocklin and Otto Graham.

I’ve decided to reproduce, unedited, their words here. Why? Well, for starters, I found the debate fascinating, but you may not have seen the whole thing buried in the comments. The Van Brocklin/Graham question is a great one, and any historian will enjoy reading their thoughts. I also present their words in an aspirational sense: the Football Perspective commenters are great, but these are the type of respectful, meaningful, and thought-out words that I hope breaks out more often.

I kicked things off by expressing a bit of disappointment that Van Brocklin finished only 25th in the Wisdom of Crowds poll.  He had a star-studded career, is the only quarterback to lead two different NFL teams to a title, and had some outstanding efficiency seasons. [continue reading…]

{ 72 comments }

Beginning on Friday the 6th, Football Perspective hosted a “Wisdom of Crowds” election with respect to that age old question: Who is the Greatest Quarterback of All Time?™ Well, Football Perspective guest commenter Adam Steele offered to count the ballots and provide a summary. What follows are his words, and the results from the contest.


Two of the greatest  quarterbacks of all time

Two of the greatest quarterbacks of all time

First, I want to offer my sincere appreciation to all the readers who participated in this project, as it wouldn’t have been possible without your contributions. We generated over 300 comments and lots of great discussion. And, as you’re about to see, every vote really did matter.

After tallying 80 ballots, 2,000 votes, and 26,000 ranking points, the difference between first and second place was just eight points. That’s insane. Well, I won’t tease you any longer, so here are the results:

This chart is sortable by total points, points per ballot (using 80 as the denominator), GOAT votes, top 10 votes, and top 25 votes. In the interest of statistical significance, a player needed to appear on at least five ballots in order to be ranked in the table below. [continue reading…]

{ 159 comments }
Next Posts Previous Posts