≡ Menu

[Update: You can view the results from our 80 ballots here.]

Regular guest contributor Adam Steele has offered to administer a Wisdom of Crowds edition of the GQBOAT debate. And we thank him for that.


Who is the Greatest Quarterback of All Time? This is a fun question to debate because there is no absolute right answer. In recent years, the practice of crowdsourcing has gained momentum in the analytics community, in some cases yielding more accurate results than mathematical models or expert opinions. For the uninitiated, here’s the gist: Every human being represents a data point of unique information, as all of us have a different array of knowledge and perspective about the world. Therefore, when you aggregate the observations of a group of people, they will collectively possess a greater and more diverse reservoir of knowledge than any single member of the group.

The readers of Football Perspective are an insightful bunch with areas of expertise spanning the entire football spectrum; we are the perfect group for crowdsourcing an age old football question. If you’d like to participate in this experiment, there are just a few guidelines to follow:

1. Create a list of the top 25 quarterbacks of all time, in order, using any criteria you believe to be important. I encourage readers to be bold in your selections – don’t worry about what others may think.

2. Commentary is not necessary, but most definitely welcome. In particular, I’d enjoy seeing a short blurb explaining the criteria you based your selections on.

3. Please compile your rankings BEFORE reading anyone else’s. Crowdsourcing works best when each source is as independent as possible.

4. Please DO NOT use multiple screen names to vote more than once.

I’ll give readers a week or so to cast their ballots, then analyze the results in a follow-up article. A first place vote is worth 25 points, second place 24 points, and so on. Let the process begin!

{ 344 comments }

Probably was picked off

Probably was picked off

I still can’t quite comprehend what happened. Leading 19-7 with less than three minutes remaining, Green Bay somehow lost the NFC Championship Game. It was the most remarkable comeback in conference championship game history since at least 2006, when Peyton Manning and the Colts came back from the dead against the Patriots.

But this game had the added element of Russell Wilson looking like he had no idea what he was doing out there. With four minutes remaining, Wilson had one of the ugliest stat lines in playoff history: he was 8/22 for 75 yards with no touchdowns, four interceptions, and four sacks for 24 yards. He was averaging -4.96 Adjusted Net Yards per Attempt. It was worse than Ryan Lindley against Carolina, a performance that would rival Kerry Collins in the Super Bowl against the Ravens for worst playoff passing performance ever.

Wilson’s stat line was straight out of a 1976 boxscore featuring a rookie quarterback against the Steelers. Yet, somehow, minutes later, the game would be in overtime. Wilson ended regulation with a still miserable stat line of 11/26 for 129 yards, with 0 touchdowns (to be fair, he did run one in), 4 interceptions, and 4 sacks for -24 yards. That translates to an ANY/A average (which gives a 45-yard penalty for interceptions, and a 20-yard bonus for touchdowns, while penalizing for sacks) of -2.50.

If the Seahawks returned the overtime kickoff for a touchdown, the game would have easily gone down as the worst performance by a playoff-winning quarterback in history. But in overtime, Wilson did his best work: first, he found Doug Baldwin for ten yards. Then, after taking a one-yard sack, he hit Baldwin on 3rd-and-7 for 35 yards. The next play, Wilson hit Jermaine Kearse for a 35-yard touchdown, and Seattle was headed back to the Super Bowl.

Wilson finished 14/29 for 209 yards, with 1 touchdown, 4 interceptions, and five sacks for -25 yards. That translates to an anemic ANY/A average of +0.71. How does that compare historically? I thought it would be worthwhile to compare the ANY/A average of every winning quarterback in a playoff game to the league average ANY/A that season. So, in 2014, the NFL averaged 6.13 Adjusted Net Yards per Attempt per pass. This means Wilson finished 5.42 ANY/A below average. And given that Wilson had 34 dropbacks, it means that Wilson produced -184 Adjusted Net Yards over average. As it turns out, that’s only the … third worst ever by a winning quarterback. [continue reading…]

{ 19 comments }
Tom Brady has been known to wear Suggs

Tom Brady has been known to wear Suggs

Disclaimer: Quarterbacks don’t have records, teams do. A quarterback’s “record” is simply shorthand for saying “the record of a quarterback’s teams in all playoff games started by that quarterback.” Please forgive me for using that shorthand for the remainder of this post.

Eight years ago, Doug Drinen wrote a fun post in advance of the 2006 AFC Championship Game. At the time, Peyton Manning had gone 0-2 in playoff games against Tom Brady, so Doug looked at quarterbacks who had gone winless against another particular quarterback in the postseason.

Manning wound up beating Brady in that game, and evened his record against Brady in the 2013 playoffs. No pair of quarterbacks have ever met as starters five times in the playoffs, so Brady/Manning are tied for the most playoff meetings. Joining them on Saturday will be Brady and Joe Flacco. This weekend’s game will be the fourth time since 2009 that the Ravens have traveled to Foxboro in the postseason, and Brady and Flacco have been under center for each game. [continue reading…]

{ 7 comments }

A massively disappointing quarterback and Josh  McCown

A massively disappointing quarterback and Josh McCown

Passer rating is a stupid stat. But my interest in trivia trumps my disdain for passer rating, so let’s move on.

Josh McCown had a passer rating of 109.0 last year, the third best in the NFL in 2013. With one game left in the 2014 season, McCown has a passer rating of 70.5, and he is in a tight three-way race with Geno Smith and Blake Bortles to see who finishes the season with the worst passer rating. Update: McCown had a passer rating of 70.0 in week 17, and finished the year with a 70.5 passer rating. A decline of 38.5 points in a quarterback’s passer rating is enormous, but not unprecedented. In fact, eight other players (minimum 200 pass attempts both years) have seen larger declines:

#8) Daunte Culpepper (2004-2005)

In 2004, Culpepper set an NFL record with 5,123 yards of total offense.  I wrote about Culpepper’s great ’04 season and his subsequent decline at the PFR blog back in 2007, and I maintain that Culpepper was a very underrated quarterback during his time in Minnesota.  In 2004, he finished with a passer rating of 110.9; the next year, his final with the Vikings, he threw 6 touchdowns against 12 interceptions in seven games, before an ACL year ended his season.  He finished with a 72.0 passer rating, representing a 38.9 point drop from his lofty ’04 standard. [continue reading…]

{ 6 comments }

Quarterback Passing Value and First Downs

Nine days ago, I looked at the leaders in passing value, measured as the difference between each quarterback’s ANY/A average and league average, multiplied by such passer’s number of dropbacks. This is the conventional method I have used to measure passing value, but that doesn’t make it the best.

Over the summer, Brian Burke of Advanced Football Analytics fame, helped me determine the value of first down. His research concluded that a first down was worth about 9 marginal yards. I was short on time, so I didn’t have the chance to incorporate that into my formula last week. But I will rectify that today.

In addition, I will provide -30 yards for each “net fumble” — defined as fumbles minus fumbles recovered. And since last week I calculated the numbers relative to average, this time around I will compare player production to replacement value, defined as 80% of league average. [1]Customarily, I use 75%, but I think with the first down bonus, 80% makes more sense here.

Let’s use Aaron Rodgers as an example. The Packers star has thrown 458 times for 3,837 yards, 35 touchdowns (+700), with 5 interceptions (-225), 9 fumbles, and 5 fumble recoveries (-120). He has also been sacked 27 times and lost 166 yards on those plays. Finally, Rodgers has picked up 188 first downs (+1692), which means he has a total of 5,718 adjusted net yards. Over his 485 dropbacks, that gives him an average of 11.79 “ANY/A”, while the league average is 8.91. That means Rodgers has produced 1,397 yards of value over average, and 2,261 yards of value over replacement. [continue reading…]

References

References
1 Customarily, I use 75%, but I think with the first down bonus, 80% makes more sense here.
{ 6 comments }

Guest Post: Marginal Drops

Munir Mohamed, a reader of Football Perspective, has agreed to write this guest post for us. And I thank him for it.


Regular readers are familiar with Adam Steele’s threepart series here on Marginal YAC; today, I want to look at drops, and marginal drops.  As Adam noted, Sportingcharts.com keeps track of dropped passes. [1]Some fine print: Unfortunately, that data is only recorded on a team level, not at the individual passer level.  As a result, I gave each quarterback his pro rata portion of his team’s dropped … Continue reading

Her’s how to read the table below, which is sorted by career Marginal Drops.  Over the course of this data set, Eli Manning completed 2,929 of his 5,008 passes, for a completion percentage of 58.5%.  Manning’s Giants dropped an estimated 299.4 of his passes; if we add those to his 2,929 completions, Manning was therefore “On Target” with 64.5% of his throws.  Relative to league average, Manning had 44 more drops than we would expect. Manning’s drop percentage — i.e., his number of drops divided by his total number of completions and drops, was 9.3%, which represents his percentage of catchable balls that were dropped. Manning lost 516.5 yards from his marginal drops, or 52.9 yards last from marginal drops per 300 completions. [continue reading…]

References

References
1 Some fine print: Unfortunately, that data is only recorded on a team level, not at the individual passer level.  As a result, I gave each quarterback his pro rata portion of his team’s dropped passes relative to the percentage of team incompletions for the entire team.

For example, let’s say the Jaguars have 30 dropped passes. Assume QB A for the Jaguars has 200 incompletions, and QB B has 100 incompletions. My methodology handled this by crediting QB A with 20 dropped passes and QB B with 10 drops. The numbers in this article are from 1992-2013. In the table below, “Marginal Drops” represents how many drops above average a quarterback had compared to league average rate. If a passer has positive Marginal Drops, this means he had more drops than expected.

{ 10 comments }

Quarterback Musical Chairs

Not every team is so lucky.

Not every team is so lucky.

There are 13 teams with very clear quarterback situations for the near future. By that I mean, barring unforeseeable injury, you can say with 95% confidence who the team’s week 1, 2015 starting quarterback will be. Those teams are, in no particular order: Green Bay (Aaron Rodgers), Indianapolis (Andrew Luck), Carolina (Cam Newton), Baltimore (Joe Flacco), New Orleans (Drew Brees), Atlanta (Matt Ryan), Detroit (Matthew Stafford), Kansas City (Alex Smith), Pittsburgh (Ben Roethlisberger), Jacksonville (Blake Bortles), San Diego (Philip Rivers), Seattle (Russell Wilson), and New England (Tom Brady).

We can get to an even half the league by adding San Francisco (Colin Kaepernick), Miami (Ryan Tannehill), and the New York Giants (Eli Manning), but I think each of those situations are slightly cloudier due to potential uncertainties higher up in the organization. Will Jim Harbaugh still be coaching the 49ers in 2015, and if not, what does that mean for Kaepernick? If the Dolphins miss the playoffs for the sixth straight year, would that mark the end of the Joe Philbin — and Tannehill — eras in South Beach? Manning is actually entering the last year of his contract in 2015, and comes with a cap hit of $19.75M and dead money of just $2.25M if he’s cut or traded. He’s not worth $20M per year, and if Tom Coughlin is gone, will a new coach want to go in a new direction?

Still, the smart money is on those three wearing the same uniforms in 2015; more importantly for our musical chairs purposes, all three will be starting quarterbacks somewhere next year. Peyton Manning could retire if the Broncos win the Super Bowl, but odds are he brings our list up to 17 quarterback situations we can clearly identify for week 1 of the 2015 season. We can get to an even 20 by including Cincinnati (it’s unlikely Andy Dalton isn’t the starter this time next year), Dallas (Tony Romo will be the guy if healthy, but his back troubles moves him out of the group 1 list), and Minnesota (no, Teddy Bridgewater has not been great, but he’s been capable enough as a 22-year-old rookie to be given the job at the start of the 2015 season).

[continue reading…]

{ 9 comments }

New York Times, Post Week-12 (2014): Total QBR

This week at the New York Times, I take my annual look at ESPN’s Total QBR:

In 2011, ESPN introduced Total QBR, or Total Quarterback Rating, a proprietary statistic intended to capture several of the hidden aspects of quarterback play. The next year, the Indianapolis Colts drafted quarterback Andrew Luck. And while he has helped revitalize the franchise, he has also served as one of the shining examples of how Total QBR credits players for positive plays that are otherwise ignored.

As a rookie, Luck ranked 26th in passer rating but ninth in Total QBR; last year he finished 18th in passer rating but eighth in Total QBR. So what was traditional passer rating missing when it came to Luck? In both years, he ranked in the top three in value added via penalties and on the ground. He did the little things — drawing a significant number of penalties (including value pass interference flags), making key contributions with his legs — that traditional passer rating ignored.

This year, though, Luck ranks slightly higher in passer rating (seventh) than Total QBR (eighth). Alok Pattani and Sharon Katz of ESPN Stats & Information, via email, shed some light on Luck’s season, along with other quarterbacks who have exhibited key differences between their Total QBR and passer rating numbers.

While Luck is having a breakout year via traditional metrics — he leads the N.F.L. in passing yards and is on a pace to set career highs in completion percentage, passer rating and touchdown percentage — he has taken a step back in some of the areas in which he used to excel. Luck picked up a first down on 78 percent of his rushes last year, but that number has dropped to 40 percent in 2014. Scrambles represent the majority of his rushes, and he gained a first down on 75 percent of them last year, compared with 29 percent of them this year. He also ranked third among quarterbacks in Expected Points Added via penalties in 2012 (+12.6), in part because he drew 13 defensive pass interference plays for 238 yards. This year Luck ranks 14th in penalty E.P.A. (+3.5), with five pass interference calls for 104 yards

You can read the full article here.

Finally, a Brian Hoyer note or two that made its way to the cutting room floor. Hoyer ranks 10th in ANY/A but 23rd in Total QBR. I was curious about that, and here is what Alok and Sharon were able to tell me:

  • Hoyer has really struggled on third downs. He ranks 2nd-to-last among qualifiers in completion percentage (49%), Y/A (5.7), and first down pct (32%) on 3rd downs.  Not coincidentally, the Browns rank 2nd-to-last in NFL in 3rd down conversion rate.
  • Hoyer has also been really bad at running, with 4 yards on 22 carries (only 4 1st downs).  Total rush EPA of -5.6 is lowest in NFL this season.
  • Hoyer’s also getting bad grades for the context of his interceptions: five of his interceptions cost his team 4+ EPA, including two of his picks against Falcons.  Only Cutler, Bortles, and Dalton have more “really bad” interceptions.
{ 4 comments }

Dalton was scary bad last night.

Dalton was scary bad last night.

Last night, Andy Dalton was not very good. completed 10 of 33 passes for 86 yards, while throwing 0 touchdowns and 3 interceptions. Add in his two sacks for 14 yards, and Dalton averaged -1.80 ANY/A. That’s terrible, of course, but how bad does that measure historically? Let’s use the same methodology we did when calculating how good Ben Roethlisberger was against the Colts. Against every other passer this year, the Browns had allowed 5.58 ANY/A to opposing players. As a result, Dalton finished 7.38 ANY/A below expectation.

Over the course of his 35 dropbacks, that means Dalton provided -258 adjusted net yards of value relative to expectation. That’s bad — really bad — but it only ranks as the 83rd worst performance since the merger. The table below shows the 150 worst games since 1970, although for 2014, I have only included Dalton’s game (so Geno Smith and his bad performances could make the list, but I didn’t have time to calculate — feel free to do so in the comments!). [continue reading…]

{ 13 comments }

Adam Steele is back for his third guest post in his Marginal YAC series.


In my two previous two posts, I introduced Marginal YAC and Marginal Air Yards. Today, I’m posting the career mYAC and mAir for the 96 quarterbacks with at least 1,000 pass attempts from 1992-2013. There’s a lot of data here, so I’ll let the readers do most of the commentary.

Here is a table of career Marginal YAC. The “Per 300” column is the rate of mYAC per 300 completions, or roughly equivalent to one full season. And on a “per season” basis, no quarterback benefited more from YAC than Steve Young, who also had four top-40 seasons. [continue reading…]

{ 1 comment }
It was criminal how good Ben was on Sunday

It was criminal how good Ben was on Sunday

Against Indianapolis in week 8, Ben Roethlisberger was close to perfect. He completed 40 of 49 passes for 522 yards. He threw six touchdowns, and didn’t throw an interception or take a sack. That’s a magnificent performance: in fact, among players with an 80% completion percentage in a game, he set a record for completions. It goes without saying that 500+ yard games are rare, and 6+ TD games are rare, and the combination of both are really rare.

But was it the best passing game ever? Not so fast. Let’s start by calculating his Adjusted Net Yards per Attempt, which gives a 20-yard bonus for touchdown passes, a 45-yard penalty for interceptions, and deducts sack yardage from the numerator (and adds sacks to the denominator). Roethlisberger averaged 13.10 ANY/A, a sparkling number. That’s an outstanding number that needs no qualifier, but it’s even more impressive when you consider the opponent. Entering the day, the Colts were allowing just 5.52 ANY/A to opposing passers.

Therefore, the Steelers star averaged 7.58 more ANY/A against the Colts than the average passer in 2014. Over the course of 49 dropbacks, this means Roethlisberger produced a whopping 372 Adjusted Net Yards above average, with average being defined as what all other passers did against Indianapolis.

That number may not mean much in the abstract. But if the Colts defense continues to allow just 5.52 ANY/A to all other passers year, that would give Roethlisberger the 7th best passing game since 1960. [continue reading…]

{ 24 comments }

Passing Kings, From Friedman to Manning

Friend-of-the-program Bryan Frye has contributed a fantastic guest post for us today. Bryan lives in Yorktown, Virginia, and operates his own great site at http://www.thegridfe.com/, where he focuses on NFL stats and history. Be sure to check out Bryan’s site, and let him know your thoughts on today’s posts in the comments.


Last Sunday, Peyton Manning broke the record for career touchdown passes. You may have heard about it. Rather than add more flotsam and jetsam to the vast sea of internet articles dedicated to Manning, I thought I would instead focus on the rich history of the record itself.

[continue reading…]

{ 27 comments }

In early September, Adam Steele, a longtime reader and commenter known by the username “Red” introduced us to his concept of Marginal Yards after the Catch. Today is Part II to that post. Adam lives in Superior, Colorado and enjoys digging beneath quarterback narratives to discover the truth; hey, who can blame him?


Introducing Marginal Air Yards

There are three components of Y/A: Completion %, Air Yards/Completion, and YAC/Completion. In my last post I looked at YAC, so today, let’s look at the other two components. By multiplying completion percentage and air yards per completion, we get air yards per attempt, which we can then modify to create Marginal Air Yards (mAir):

mAir = (Air Yards/Attempt – LgAvg Air Yards/Attempt)*Attempts

Here are the yearly Air Yard rates since 1992, with the table sorted by Air Yards per Attempt:: [continue reading…]

{ 15 comments }

Eli Manning and the Hall of Fame

Let’s worry about axes and labels later. For now, take a look at the graph below. The red dots represent Hall of Fame quarterbacks (or players not yet eligible but very likely to wind up in Canton). The blue dots represent non-HOF quarterbacks. The black dot? That’s Eli Manning.

hof

Okay, so what the heck is this chart? What it’s *not*, is the most sophisticated way to measure the value of a quarterback. Instead, it’s a quick-and-dirty method I calculated to measure quarterback dominance.

  • Step 1) Calculate each quarterback’s ANY/A for each season of his career where he had enough pass attempts to qualify for the passing title (14 attempts per team game). ANY/A, of course, is calculated as follows: (Passing Yards + PassTDs * 20 – INTs * 45 – Sack Yards Lost) / (Pass Attempts + Sacks).
  • Step 2) For each quarterback, award him 10 points if he led the league [1]For purposes of this post, I have excluded AAFC stats, but combined the AFL and NFL as one league. in ANY/A, 9 points if he finished 2nd, 8 points if he finished 3rd, … and 1 point if he finished 10th. A quarterback receives 0 points if he does not finish in the top 10 in ANY/A or does not have enough pass attempts to qualify.
  • Step 3) For each quarterback, add his “points” from each season to produce a career grade.

[continue reading…]

References

References
1 For purposes of this post, I have excluded AAFC stats, but combined the AFL and NFL as one league.
{ 43 comments }

In the third quarter on Monday night, I texted my Patriots fan buddy Matt, “Is it possible that we suck? Maybe the run is finally over.” Bill Barnwell mused on this, and Aaron Schatz also wrote about it. It was hard not to think that, given the way the Patriots were manhandled by a mediocre team playing without several key players. It looked every bit as bad as the 41-14 score and maybe worse.

I remember the last time I wondered if the Pats were done. In a 34-14 loss to the Browns in 2010, the Patriots looked pretty impotent. In that game, as in the Chiefs one, the Pats had just under 300 yards of offense. Peyton Hillis ran over the Patriots. Of course, that wasn’t the end. Maybe this time is different, though. If anything the Chiefs game was even worse, so it’s possible this time really is the end. [1]And those Pats were 6-1 at the time of the loss to the Browns.

Will the Patriots offense be good later this year? To provide a little insight into this, I went back and looked at performance trends for quarterbacks who have had long careers. The first table looks at quarterbacks since 1969 who have the biggest single-season drops in adjusted net yards per attempt (ANY/A) from the previous five year trend. I look just at quarterbacks with at least 100 attempts in a season and I weight by the number of attempts when calculating the average ANY/A over the previous five years.

[continue reading…]

References

References
1 And those Pats were 6-1 at the time of the loss to the Browns.
{ 20 comments }

Guest Post: Introducing Equivalency Rating

Just above these words, it says “posted by Chase.” And it was literally posted by Chase, but the words below the line belong to Bryan Frye, a longtime reader and commenter who has agreed to write this guest post for us. And I thank him for it. Bryan lives in Yorktown, Virginia, and operates his own great site at http://www.thegridfe.com/, where he focuses on NFL stats and history.


In August, I introduced a concept on my site to better adjust the NFL’s passer rating for the league passing environment. I love Pro Football Reference’s use of the Advanced Passing Index for passer rating (Rate+), but it still bothered me that the internal math of the NFL’s formula remained the same.

The NFL’s official passer rating formula is based on four variables: completion percentage, yards per attempt, touchdown percentage, and interception rate. Each of those variables are then used to determine four different variables, as seen below:

A = (Cmp% – .3) * 5
B = (Y/A – 3) * .25
C = TD% * 20
D = 2.375 – Int% * 25

Passer rating is then calculated as follows, provided that each variable is capped at 2.375 and has a floor of zero:

(A + B + C + D)/(0.06)

For each component, a score of 1 represents the ideal average passer. Because the formula is based on a league average completion rate of 50%, modern passers significantly exceed that; pre-modern passers rarely reached it. Similarly, the NFL’s model is based on a 5.5% interception rate and a 5% touchdown rate. Thanks to a Greg Cook injury (and Bill Walsh’s genius reaction to it), those numbers have also changed significantly. Last year, the league interception and touchdown rates were 2.8% and 4.4%, respectively. [continue reading…]

{ 11 comments }

Week 1 Quarterback Comparison

Am I going to update my stock Fitzpatrick photo now that he's on Houston? What do you think?

Am I going to update my stock Fitzpatrick photo now that he's on Houston? What do you think?

Ryan Fitzpatrick averaged 9.61 Adjusted Net Yards per Attempt in week 1, good enough for the 4th best grade of the week. But the Houston signal caller — who went 14/22 for 206 yards with 1 touchdown, no interceptions, and 1 sack — was not a very good fantasy quarterback. Using the Footballguys.com standard scoring system of 1 point per 20 yards passing, 1 point per 10 yards rushing, 4 points per touchdown pass, and -1 point per interception, Fitzpatrick had just 15.3 fantasy points (he rushed for 10 yards). That tied him for only the 25th best performance by a quarterback in week one.

Obviously there’s a big difference between ANY/A and fantasy points.  But while we use ANY/A as our main metric for lots of reasons, it’s always helpful to compare it to other statistics.  For example, RG3 ranked 17th in ANY/A in week 1, but only 27th in ESPN’s Total QBR. Why is that? Well, Griffin fumbled twice (losing one), and he completed a lot of very short throws (he had the third lowest air yards per throw and air yards per completion).  But another factor is that his third down performance was a bit misleading using conventional metrics, which is something Total QBR is good at identifying.

Griffin gained 75 net yards on 10 third down dropbacks in the game: that’s pretty good, but he only picked up first downs on 3 of 10 opportunities.   He had a 48-yard completion on a 3rd-and-7, which is great, but it also inflates his average gain; he also had a pair of 9 yard completions on third and very long that added little value.

We can also look at Football Outsiders’ main efficiency metric, DVOA, and compare that to other statistics.  Matt Cassel is an interesting player to analyze.  In DVOA, he ranked 5th.  In ANY/A, he ranked 10th.  In Total QBR, he was 15th, and in fantasy points, he was 21st!   So what gives?

As noted by Vince Verhei, Cassel’s “average pass traveled just 4.8 yards past the line of scrimmage, nearly a full yard shorter than the next shortest quarterback (Derek Carr, 5.6).” That would explain why QBR would be less high on Cassel than other statistics.  And since Cassel threw just 25 passes for only 170 yards, his fantasy value won’t be very high. Football Outsiders, on the other hand, gives Cassel credit for things like his a 9-yard pass on third-and-10 that created better field goal range.  Overall, comparing what Cassel did to the baseline, he looks really good according to FO, and just pretty good according to QBR.  As for ANY/A, it’s impressed by his 2 TD/0 INT ratio, but it’s hard to get a great ANY/A grade when you are averaging just 10.0 yards per completion.

The table below shows each quarterback’s stats in each metric.  For example, Matthew Stafford averaged 11.55 ANY/A in week 1, scored 31.5 fantasy points, had a Total QBR of 97.5, and a DVOA of 90.3%.  Those ratings, among the 33 quarterbacks in week 1 (curses, Rams!), ranked him 1st in ANY/A, 3rd in fantasy points, 1st in QBR, and 1st in DVOA, for an average rank of 1.5. [continue reading…]

{ 37 comments }

Just above these words, it says “posted by Chase.” And it was literally posted by Chase, but the words below the line belong to Adam Steele, a longtime reader and commenter known by the username “Red”. And I thank him for it. Adam lives in Superior, Colorado and enjoys digging beneath quarterback narratives to discover the truth; hey, who can blame him? One other house-keeping note: I normally provide guest posters with a chance to review my edits prior to posting. But due to time constraints (hey, projecting every quarterback in the NFL wasn’t going to write itself!), I wasn’t able to engage in the usual back and forth discussion with Adam that I’ve done with other guest posters. As a result, I’m apologizing in advance if Adam thinks my edits have changed the intent of his words. But in any event, sit back and get ready to read a very fun post on yards after the catch. When I envisioned guest submissions coming along, stuff like this is exactly what I had in mind.


Introducing Marginal YAC

A quarterback throws a two yard dump off pass to his running back, who proceeds to juke a couple defenders and run 78 yards into the endzone. Naturally, the quarterback deserves credit for an 80 yard pass. Wait, what? Sounds illogical, but that’s the way the NFL has been keeping records since 1932, when it first began recording individual player yardage totals. The inclusion of YAC — yards after the catch — in a quarterback’s passing yards total can really distort efficiency stats, which in turn may distort the way he is perceived.

In response, I created a metric called Marginal YAC (mYAC), which measures how much YAC a quarterback has benefited from compared to an average passer. Its calculation is very straightforward:

mYAC = (YAC/completion – LgAvg YAC/completion) * Completions

I have quarterback YAC data going back to 1992 for every quarterback season with at least 100 pass attempts. [1]This data comes courtesy of sportingcharts.com. It’s obviously unofficial, but there doesn’t seem to be any noticeable biases from one team to another. Some unofficial stats, such as … Continue reading That gives us a healthy sample of 965 seasons to analyze, and includes the full careers of every contemporary quarterback. But first, let’s get a sense of what’s average here. The table below shows the league-wide YAC rates since 1992: [continue reading…]

References

References
1 This data comes courtesy of sportingcharts.com. It’s obviously unofficial, but there doesn’t seem to be any noticeable biases from one team to another. Some unofficial stats, such as passes defensed or quarterback pressures, can vary wildly depending on the scorekeeper, but Sporting Charts’ YAC stats seem pretty fair, from what I can tell. Here is a link to the 2013 data. Chase note: I have not had the chance to compare these numbers to what is on NFLGSIS, but that’s a good idea.
{ 23 comments }

Below are my 2014 projected quarterback rankings. Let me be very clear at the top of this post as to exactly what these rankings mean: they represent my projections of the order in which these quarterbacks will finish in my preferred measure of quarterback play. Everyone has their own measuring sticks when it comes to quarterbacks; for me, it’s Adjusted Net Yards provided above league-average. As a reminder, here is how we calculate that metric.

First, we start with Adjusted Net Yards per Attempt, which is calculated as follows:

(Passing Yards + 20 * PassTDs – 45 * INTs – Sack Yards Lost) / (Pass Attempts + Sacks)

Then, we take each quarterback’s ANY/A average, and subtract from that number the league average ANY/A metric, which should be around 5.9 ANY/A. Then, we multiply that difference by the quarterback’s number of dropbacks.

Last year, Peyton Manning led the league in this category, with 2,037 Adjusted Net Yards of value provided above average. The benefit to this approach to ranking passers is that the results are easy to test. At the end of the season, we can calculate the actual results, and then look back and laugh at this post.

So, ranking 1-32, here is how I project the top quarterback for each team to finish in 2014.

No, Peyton, you're the number one

No, Peyton, you're the number one.

1) Peyton Manning, Denver Broncos

There’s a reason Manning is the heavy favorite to repeat as NFL MVP. The Broncos lost Eric Decker and Knowshon Moreno, and Wes Welker’s concussion concerns only worsened this preseason. No matter: Manning remains the gold standard. Denver added Emmanuel Sanders in the offseason, and he caught five passes for 128 yards with two touchdowns against Houston in the preseason. Manning has led the NFL in sack rate in three of his last four seasons, and the return of Ryan Clady should make Manning even more difficult to sack in 2014. No need to over think this one: Manning is the clear favorite to again provide the most value of any quarterback in the league.

2) Aaron Rodgers, Green Bay Packers

3) Drew Brees, New Orleans Saints

Choosing between Brees and Rodgers is tough, but the return of a healthy Randall Cobb and the departure of Darren Sproles is enough to tip the scales towards Rodgers for me. Green Bay tends to forget about the little things — Corey Linsley, a fourth round pick, will be the team’s starting center — but Rodgers has a way of curing all ills. Brees turns 36 in January, which is yet another reason to break ties in favor of Rodgers. Since ’09, Rodgers is the league-leader in ANY/A, while over that period, Brees has thrown the most touchdowns and gained the most yards. If Manning isn’t the king in 2014, it’s a good bet that either Rodgers or Brees took the crown. [continue reading…]

{ 42 comments }

A full one-quarter of all NFL teams have opening day starters who have won a Super Bowl: New England (Tom Brady), Pittsburgh (Ben Roethlisberger), Baltimore (Joe Flacco), Denver (Peyton Manning), New York Giants (Eli Manning), Green Bay (Aaron Rodgers), New Orleans (Drew Brees) and Seattle (Russell Wilson) all sport Super Bowl winning passers.

That’s pretty rare. In 1991, Jeff Hostetler was the only quarterback starting in week 1 who had a Lombardi Trophy on his resume. [1]Phil Simms was the team’s backup, Joe Montana missed the entire year with an elbow injury, Doug Williams had retired, Jim McMahon was the backup in Philadelphia, Jim Plunkett and Joe  … Continue reading From 1993 to 2012, an average of 4.0 week 1 starters had previously won a title. Having a Super Bowl winning quarterback is nice, but it doesn’t exactly make a team unique. At least not for 2014.

YearWk 1 SB QBsQuarterbacks
20148Tom Brady; Ben Roethlisberger; Peyton Manning; Eli Manning; Drew Brees; Aaron Rodgers; Joe Flacco; Russell Wilson
20137Tom Brady; Ben Roethlisberger; Peyton Manning; Eli Manning; Drew Brees; Aaron Rodgers; Joe Flacco
20126Tom Brady; Ben Roethlisberger; Peyton Manning; Eli Manning; Drew Brees; Aaron Rodgers
20115Tom Brady; Ben Roethlisberger; Eli Manning; Drew Brees; Aaron Rodgers
20105Brett Favre; Tom Brady; Peyton Manning; Eli Manning; Drew Brees
20096Brett Favre; Kurt Warner; Tom Brady; Ben Roethlisberger; Peyton Manning; Eli Manning
20086Brett Favre; Kurt Warner; Tom Brady; Ben Roethlisberger; Peyton Manning; Eli Manning
20074Brett Favre; Tom Brady; Ben Roethlisberger; Peyton Manning
20064Brett Favre; Kurt Warner; Tom Brady; Brad Johnson
20054Brett Favre; Kurt Warner; Trent Dilfer; Tom Brady
20044Brett Favre; Kurt Warner; Tom Brady; Brad Johnson
20034Brett Favre; Kurt Warner; Tom Brady; Brad Johnson
20023Brett Favre; Kurt Warner; Tom Brady
20012Brett Favre; Kurt Warner
20003Troy Aikman; Brett Favre; Kurt Warner
19993Troy Aikman; Steve Young; Brett Favre
19984Troy Aikman; Steve Young; Brett Favre; John Elway
19973Troy Aikman; Steve Young; Brett Favre
19962Troy Aikman; Steve Young
19953Jeff Hostetler; Troy Aikman; Steve Young
19943Joe Montana; Jeff Hostetler; Troy Aikman
19936Joe Montana; Jim McMahon; Phil Simms; Jeff Hostetler; Mark Rypien; Troy Aikman
19922Phil Simms; Mark Rypien
19911Jeff Hostetler
19902Joe Montana; Phil Simms
19893Joe Montana; Jim McMahon; Phil Simms
19884Joe Montana; Jim McMahon; Phil Simms; Doug Williams
19872Joe Montana; Phil Simms
19862Joe Montana; Jim McMahon
19853Jim Plunkett; Joe Montana; Joe Theismann
19843Jim Plunkett; Joe Montana; Joe Theismann
19834Ken Stabler; Jim Plunkett; Joe Montana; Joe Theismann
19824Terry Bradshaw; Ken Stabler; Jim Plunkett; Joe Montana
19813Terry Bradshaw; Ken Stabler; Jim Plunkett
19803Bob Griese; Terry Bradshaw; Ken Stabler
19794Roger Staubach; Bob Griese; Terry Bradshaw; Ken Stabler
19783Roger Staubach; Terry Bradshaw; Ken Stabler
19775Joe Namath; Roger Staubach; Bob Griese; Terry Bradshaw; Ken Stabler
19764Joe Namath; Roger Staubach; Bob Griese; Terry Bradshaw
19754Joe Namath; Roger Staubach; Bob Griese; Terry Bradshaw
19744Joe Namath; Len Dawson; Roger Staubach; Bob Griese
19734Joe Namath; Johnny Unitas; Roger Staubach; Bob Griese
19723Joe Namath; Len Dawson; Johnny Unitas
19711Len Dawson
19703Bart Starr; Joe Namath; Len Dawson
19692Bart Starr; Joe Namath
19681Bart Starr
19671Bart Starr

References

References
1 Phil Simms was the team’s backup, Joe Montana missed the entire year with an elbow injury, Doug Williams had retired, Jim McMahon was the backup in Philadelphia, Jim Plunkett and Joe Theismann had long been retired, and that takes us all the way back to 1979.
{ 10 comments }

Is Quarterback Stability on the Rise?

This time last year:

Brady will be the Patriots week 1 starting quarterback for the 13th year in a row.

Brady will be the Patriots week 1 starting quarterback for the 13th year in a row.

It’s easy to remember those times and think “man, life moves pretty fast.” But I’m going to take the opposite approach.

Twenty-five teams — twenty-five teams! — are bringing back the same week 1 starting quarterback from week 1, 2013. That, of course, doesn’t include Foles or Henne, who ended last year as starters. Last year, twenty-six teams had the same week one starter as they did in 2012. As it turns out, the past two seasons have seen the highest week 1 starting QB retention rate of any seasons since the merger. [continue reading…]

{ 2 comments }

Not Tim Couch

Not Tim Couch.

The preseason is meaningless, right? Well, as it turns out, it might give us a window into quarterback development, despite what you might think. The threshold for whether the preseason is useful is whether including that information tells us anything about a quarterback’s potential that we don’t already know from his draft position (or perhaps certain analytics). I have been putting together data from preseason box scores going back to 1997. The data show that, for some quarterbacks, the preseason is not quite meaningless.

Neil Paine showed some interesting evidence relating to this idea on Friday. Looking at team performance since 2009 for teams with new quarterbacks, Neil showed that preseason passing efficiency helps predict regular season passing efficiency. It’s important to note that part of this result may have been pretty predictable even before we watched those preseason games. The 2012 Redskins replaced Rex Grossman and John Beck with the #2 pick in the draft who would have been #1 in an average year. So we would expect a big improvement to come just by way of moving from Grossman to a healthy RGIII. [continue reading…]

{ 12 comments }

Yesterday, I looked at how long it took the best quarterbacks to break out. Today, I want to apply what we learned from that post to 15 current NFL quarterbacks with fewer than 50 starts, all of whom were 26 years old or younger during the 2013 season.
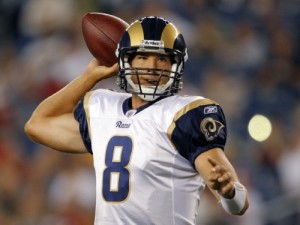
Bradford looks to check down

Bradford looks to check down.

Sam Bradford (49 career starts): Career Relative Adjusted Net Yards per Attempt of -0.68.

Bradford was overrated after he put up good counting stats but weak efficiency numbers as a rookie; he posted a -1.0 RANY/A in 2010, a -1.4 average in 10 starts in 2011, was at -0.3 in 16 starts in 2012, and then +0.2 in seven starts last year. Yesterday, we noted that great quarterbacks who came to terrible teams (Warren Moon and Drew Brees, in addition to former number one picks like Troy Aikman, Terry Bradshaw, Vinny Testaverde, and Steve Young) struggled initially. Bradford would seem to fit that mold, although he’s now 49 starts into his career. Are there other reasons to give him a pass?

St. Louis had the third-youngest offense in the NFL last year, and the man who has gained the most yards from Bradford over the last four years is Brandon Gibson. The former first overall pick has received very little help, and been saddled with a revolving door of mediocre receivers.

On the other hand, Kellen Clemens posted better numbers than Bradford last year, at least when you adjust for strength of schedule. As Bill Barnwell pointed out last week, Bradford’s big problem is his inability to throw the ball down the field, which jives with some of the work I’ve done Bradford’s historically low yards per completion averages.  If not for Bradford’s first season of above-average work last year, I’d say his odds of ever being a franchise quarterback are very low.  But there has been some progression, and he does fit the mold of number one pick being saddled with bad teammates.  Of course, the presence of Brian Schottenheimer is enough to make me skeptical of Bradford’s ability to put it all together this year.  Perhaps the best case scenario is a Testaverde-like revival with another team years from now.

Cam Newton (48 career starts): Career RANY/A of +0.30.

Not much to see here. Newton’s RANY/A has moved from +0.3 as a rookie to +0.7 in 2012 to -0.2 last year; it went under the radar because #QBWINZ, but Newton did have a down season in 2013.  It’s hard to find any reasons for optimism for the Panthers this year after a mass exodus in the offseason, but that doesn’t say much about Newton’s long-term prospects.   Add in his rushing ability, and Newton has shown enough to say that he’s still in contention (if he’s not already there) to go down as a franchise quarterback.

Andy Dalton (48 career starts): Career RANY/A of -0.01.

Look at that, Dalton is almost perfectly average! Bill Barnwell did a nice job profiling Dalton last week, and it does seem like what you see is what you will get from Dalton.  After posting slightly below-average RANY/A numbers in 2011 and 2012, he was above-average (+0.4) last year.  But the Bengals have one of the most talented offenses in the NFL if you exclude the quarterback position; at this point, you’d be hard-pressed to find many folks who believe Dalton will turn into a future star.

Of the 42 quarterbacks I looked at yesterday, 13 failed to be significantly above-average during any of their first three 16-game samples.  Dalton doesn’t really resemble any of them: Bradshaw/Testaverde/Elway/Vick were former number one picks; Brady/Favre/Krieg/Kelly were on the border of being good enough on to not make the list, and were certainly ahead of where Dalton is now; McNabb and Cunningham were running quarterbacks.  Moon played for a terrible team, and Gannon and Theismann sat for long stretches.  That’s the full thirteen. The best case scenario may be that Dalton turns into a Krieg or a poor man’s Jim Kelly.  Of course, he could also win a Super Bowl by riding the coattails of one of the more talented (and youngest) rosters in the league.

Christian Ponder (35 career starts): Career RANY/A of -1.19.

There are always excuses to be made for bad quarterbacks, and I’m sure that there are still some Vikings fans who believe in Ponder.  He produced a -1.7 RANY/A as a rookie, improved to -0.9 in 2012, but was back at -1.1 in nine starts last year.  Minnesota may not have a ton of talent at wide receiver, but Ponder’s failure to produce even with Greg Jennings is yet another strike against him. The Vikings drafted Teddy Bridgewater at the end of the first round in the 2014 draft, which seems like the beginning of the end for the former Florida State star.
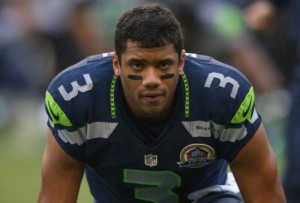
Wilson is watching game tape right now.

Wilson is watching game tape right now.

Russell Wilson (32 career starts): Career RANY/A of +1.15.

Franchise quarterback achievement badge mode: unlocked.

Ryan Tannehill (32 career starts): Career RANY/A of -0.80.

Tannehill was at -0.7 RANY/A in 2012 and at -0.9 RANY/A last year; neither of those numbers put his future prospects in a positive light.  There are excuses, to be sure: he was a raw prospect, the Dolphins offensive line was the worst in the NFL, he and Mike Wallace have the chemistry of a pair of tomatoes, etc., but the numbers are bleak enough to cast doubt on Tannehill’s future.  Unless the argument is that Tannehill landed on one of the very worst offenses in the league — which would allow you to lump him in with the Aikmans, Bradshaws, Breeses, and Testaverdes of the world — there is simply no precedent for a quarterback being this below average for this long and then turning into a franchise passer. [1]I suppose one could point to Phil Simms, but I’d object for a couple of reasons. For one, Simms didn’t crack my initial list, checking in at #86 in my GQBOAT series.  Then again, … Continue reading Barnwell is a little (and only a little) more bullish on Tannehill than I am, but 2014 would appear to be Tannehill’s last chance to convince the Dolphins that he was not a wasted pick.  There are a couple of mitigating factors here — the running game has been terrible, and as an immediate starter, Tannehill is at a disadvantage relative to other quarterbacks on this list — but I’m not going to lose sleep over whether this prediction will look bad in a few years.

Andrew Luck (32 career starts): Career RANY/A of -0.06.

Since starting this site, Luck has been one of the quarterbacks I’ve profiled the most.  He wins without much help and is an ESPN QBR star, but he’s below average in ANY/A.  I’m inclined to grade Luck on a curve — after all, the Colts team he inherited didn’t look any better than the ’70 Steelers or ’89 Cowboys or ’87 Bucs.  On the other hand, Reggie Wayne and T.Y. Hilton have given Luck some excellent targets, which has probably been enough to boost his ANY/A to league-average proportions.

Perhaps the best comparison will be to another quarterback drafted first overall by the Colts who had a magical history of producing comebacks: John Elway.  In any event, Luck’s already a franchise quarterback.
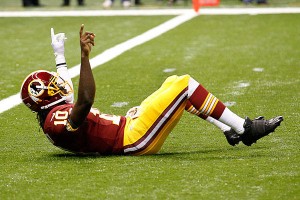
Can RG3 get up from a disastrous 2013?

Can RG3 get up from a disastrous 2013?

Robert Griffin III (29 career starts): Career RANY/A of +0.5.

Griffin’s career RANY/A is like measuring the temperature of a person with a foot in the freezer and a foot in a frying pan.  As a rookie, he had a RANY/A of +1.5; last year, it was -0.4, and that number doesn’t begin to explain how ugly things were in D.C.  The simplest explanation is that Griffin is a franchise quarterback who struggled last year as he recovered from ACL surgery and dealt with an ego-maniacal head coach.  But it’s hard to just assume Griffin is a franchise quarterback after 2013.  If Griffin one day turns into a Hall of Famer, we’ll remember that it was obvious from the start, as he had one of the greatest rookie seasons ever.  If he flames out, the first chapter of that book has already been written, too.

Blaine Gabbert (27 career starts): Career RANY/A of -2.15.

Spoiler alert: Gabbert is not a franchise quarterback.  He started at -2.2 RANY/A as a rookie on a team not dissimilar from the ’89 Cowboys; he’s followed that up, however, with a -1.2 RANY/A in 2012 and a -4.7 RANY/A over three starts last year. Suffice it to say if Gabbert turns into a franchise quarterback, it will have taken the greatest reclamation project in NFL history.

Colin Kaepernick (23 career starts): Career RANY/A of +1.06.

Kaepernick was mind-bogglingly efficient in 2012, producing a +1.6 RANY/A over 13 games and seven starts.  That number dropped to +0.8 RANY/A last year, but much of that is due to the loss of Michael Crabtree.  With an all-star crew of receivers set to take the field in 2014, I expect another very strong year out of Kaepernick. He may not be a finished product, but he already has the label (and contract) of a franchise quarterback.

Jake Locker (18 career starts): Career RANY/A of -0.25.

Maybe it’s because I’m a college football guy, too, but doesn’t it feel like Locker has already been around forever? I can’t believe he only has 18 career starts. And his RANY/A is nearly league-average, even if it doesn’t feel like Locker has been even that good.  I was not a fan of him as a prospect, but he has been better than I feared.  While we shouldn’t compare Locker’s first 18 starts to those of a quarterback who started immediately, I think Locker has shown enough that you can’t just write him off just yet.  On the other hand, his numbers last year were a bit inflated by one of the NFL’s easiest schedules. Like Tannehill, this is the crucial season for Locker, who also carries with him the injury prone label. But if Locker can stay healthy and produce strong numbers, Ken Whisenhunt may prove that he really is a quarterback whisperer (to the extent he’s not whispering to someone named Skelton, or Kolb, or Anderson, or Leinart, or Lindley, or Hall….)

Nick Foles (16 career starts): Career RANY/A of +1.45

Foles had a rookie RANY/A of -0.8 before posting an absurd +3.3 RANY/A in 2013. Even the bigger Eagles homer would admit that much of Foles’ success was due to good fortune, the presence of Chip Kelly, or both.  Foles may not have arrived just yet as a franchise quarterback, but if he turns into one, nobody will ever question when we first saw a glimpse of that ability.

Geno Smith (16 career starts): Career RANY/A of -1.70.

Smith was bad — really bad — for long stretches as a rookie.  But he finished the season well, and terrible rookie numbers on a talent-deficient offense are not the death knell for a quarterback’s career.  The Jets need to see a lot more from him this year, though, and he’ll need to produce roughly league-average numbers to make the Jets think he’s not just another Mark Sanchez.

Mike Glennon (13 career starts): Career RANY/A of -0.9.

Glennon had a very different rookie campaign than Smith, but the acquisition of Josh McCown sends Glennon to the bench, at least for now.  We don’t know how he’ll fare in (or when he’ll see) his next three starts, but Glennon’s performance through 16 starts likely won’t be enough to write him off.

EJ Manuel (10 career starts): Career RANY/A of -1.0.

Manuel had a rough rookie year, especially when you consider how much worse he looked than Thaddeus Lewis. On the other hand, ten starts of bad (but not horrendous) play certainly isn’t enough to write off Manuel, not when Smith was worse for a longer stretch.  Still, as with Smith, this is a big year for Manuel, especially after the team went out and acquired Clemson’s Sammy Watkins.

References

References
1 I suppose one could point to Phil Simms, but I’d object for a couple of reasons. For one, Simms didn’t crack my initial list, checking in at #86 in my GQBOAT series.  Then again, I’ve made the argument that Simms’ numbers underrate him because of his terrible receivers, so I would morally classify Simms as a franchise quarterback. However, the Giants teams of the late ’70s and early ’80s were so terrible that he really has more in common with the Aikmans of the world than someone like Tannehill. Here is how Simms fared compared to the other Giants quarterbacks during Simms’ first three years and 1978, the year before he came to New York. That’s U-G-L-Y. But if Dolphins fans want to point to Simms as a pro-Tannehill example, so be it.
{ 9 comments }

A couple of years ago, I asked how long it should have taken the Jaguars to move on from Blaine Gabbert. Today I want to revisit that general idea, but look at how long it takes the best quarterbacks to identify themselves as top-tier players. A couple of months ago, I looked at the greatest quarterbacks of all time. Using the top 75 quarterbacks from that list, I removed any player whose career began before the merger; that left me with 42 passers.

First, I looked at how each quarterback fared in relative Adjusted Net Yards per Attempt — i.e., ANY/A relative to league average — through their first 16 starts. Just over two-thirds of these passers were above average during their first 16 starts, with 1/3 of those quarterbacks being at least 1 ANY/A better than league average.  That group of fourteen quarterbacks — which Aaron Rodgers just falls shy of joining — can be categorized as above-average quarterbacks from the beginning. They are Kurt Warner, Dan Marino, Daunte Culpepper, Chad Pennington, Tony Romo, Mark Rypien, Jeff Garcia, Boomer Esiason, Ben Roethlisberger, Philip Rivers, Matt Ryan, Joe Montana, Steve McNair, and Ken Stabler. Obviously a number of those quarterbacks were not immediate starters in the NFL, but they did excel as soon as they became starters.

The graph below shows each of the 42 quarterbacks’ Relative ANY/A through their first 16 starts. The X-Axis represents the quarterback’s first year, and the Y-Axis shows their RANY/A value through 16 starts.

QB breakout 1

Now, let’s remove the 14 quarterbacks who had a RANY/A of at least +1.0 through their first sixteen starts. How did the other 28 quarterbacks fare in starts 17 through 32 in RANY/A? Eleven of them produced a RANY/A of at least +1.0 in their next sixteen starts: Bert Jones, Matt Schaub, Ken Anderson, Peyton Manning, Aaron Rodgers, Brad Johnson, Carson Palmer, Jim Everett, Steve Young, Dan Fouts, and Steve Grogan.

[continue reading…]

{ 24 comments }

Quarterback Losses Trivia

Can you name the two quarterbacks with the most losses in a single season?

Trivia hint 1 Show


Trivia hint 2 Show


Trivia hint 3 Show

Click 'Show' for the Answer Show


What about the quarterback with the most losses during his rookie year?
Trivia hint 1 Show


Trivia hint 2 Show


Trivia hint 3 Show

[continue reading…]

{ 4 comments }

Smith struggled as a rookie; then again, so did many greats

Smith struggled as a rookie; then again, so did many greats.

In 2013, Geno Smith had the worst passer rating (66.5) in the NFL. The year before, Mark Sanchez had a passer rating of 66.9, which was very nearly the lowest in the league (Matt Cassel had a rating of 66.7). But while the Jets didn’t quite do it, a couple of teams have managed to have different quarterbacks in consecutive seasons finish with the lowest passer ratings in the NFL (minimum 14 attempts per game).

In 2000, a second-year Akili Smith was given the starting job and posted a miserable 52.8 passer rating. A year later, Jon Kitna took over for the Bengals, and his 61.1 rating was the worst among qualifying passers.

In 1993, Mark Rypien finished with the worst passer rating in the league two years after winning the Super Bowl. Washington drafted Heath Shuler the following year, and as a rookie, Shuler finished with the worst passer rating in the NFL.

The Seahawks almost pulled off this feat in the prior two years. In 1992, Stan Gelbaugh had the worst passer rating as part of the historically inept Seattle passing attack. In 1991, Jeff Kemp finished with the worst passer rating in the league. Kemp, the son of Jack , started the year with Seattle but finished it with Philadelphia. He didn’t have enough attempts with the Seahawks to qualify, so I probably wouldn’t include the ’91-’92 Seahawks in this category, although that may be pickin’ nits.

The table below shows the quarterbacks to finish with the lowest passer rating in the NFL in each year since the merger. For each passer, I’ve included his age as of September 1st of that season, his traditional metrics, and his passer rating. [continue reading…]

{ 21 comments }

One of my first posts at Football Perspective was one of my favorites: the top receivers and the men who threw it to them. I like referencing that post from time to time, so I decided to update the numbers through the 2013 season.

I looked at all regular season games since 1960 [1]Sorry, Don Hutson., and calculated the percentage of passing yards produced from each quarterback. Then, I assigned that percentage to the number of receiving yards for each receiver. For example, in this Raiders game from 1995, Vince Evans threw for 75% of the Raiders passing yards, and Jeff Hostetler was responsible for the other 25%. Therefore, since Tim Brown gained 161 yards, 121 of those yards are assigned to the “Brown-Evans” pairing and 40 to the “Brown-Hostetler” pairing. Do this for every game since 1960, and you can then assign the percentage of career receiving yards each receiver gained from each quarterback.

For example, 32% of Brown’s yards came from Rich Gannon, 26% from Hostetler, 12% from Jeff George, and 9% from Jay Schroeder. That breakdown isn’t too unique: in fact, of the six receivers with the most receiving yards since 1960, all six (including Brown) gained between 29% and 37% of their career receiving yards from their top quarterback.

The table below lists the top 7 quarterbacks for each receiver, although I only included quarterbacks who were responsible for at least five percentage of the receiver’s yards. It includes the 200 players with the most receiving yards since 1960. [continue reading…]

References

References
1 Sorry, Don Hutson.
{ 16 comments }

Last off-season, I looked at passing performance on “third downs”, and I thought it would be fun to revisit that idea this summer. As before, I am putting that term in quotes because I’m including fourth down data in the analysis, but don’t want to write third and fourth down throughout this post.

To grade third down performance, I included sacks but discarded rushing data (again, just in the interest of time). The first step in evaluating third down performance is to calculate the league average conversion rate on third downs for each distance. Here were the conversion rates I calculated last year.

To GoPassesFirst DownsRateSmoothed Rate
130915851.1%50.8%
241520850.1%48.5%
348720742.5%46.2%
451222744.3%43.9%
555922640.4%41.6%
654122842.1%39.2%
752118134.7%36.8%
842614333.6%34.5%
936511631.8%32%
1072822030.2%29.6%
112137133.3%27.2%
121533925.5%24.7%
131352417.8%22.2%
141072220.6%19.7%
151432215.4%17.2%
166258.1%14.6%
17681217.6%12%
185036%9.5%
195335.7%6.8%
204836.3%5%

[continue reading…]

{ 16 comments }
The top passing game of 2013

The top passing game of 2013.

Yesterday, I analyzed the 2013 passing numbers for strength of schedule. Today, we look at the best and worst games of the year, from the perspectives of both the quarterbacks and the defenses.

Let’s start with the top 100 passing games from 2014. The top spot belongs to Philadelphia’s Nick Foles, for his monstrous performance against Oakland. Foles threw for 406 yards and 7 touchdowns on just 28 pass attempts. Even including his one one-yard sack, Foles averaged a whopping 18.79 ANY/A in that game. The league-average last season was 5.86 ANY/A, which means Foles was 12.93 ANY/A above average. Now since the game came against the Raiders, we have to reduce that by -1.29, which was how many ANY/A the Raiders defense was below average. So that puts Foles at +11.64; multiply that by his 29 dropbacks, and he produced 337 adjusted net yards of value above average after adjusting for strength of schedule. That narrowly edges out the other seven-touchdown game of 2013, which came at the hands of Peyton Manning against Baltimore on opening night.

The third spot goes to Drew Brees in a week 17 performance against Tampa Bay. The 4th best game of 2013 was a bit more memorable: Tony Romo takes that prize in a losing effort, the insane week five shootout against Manning and the Broncos (Peyton’s performance checks in at #32). The table below shows the top 100 games of 2013, although for viewing purposes, it displays only the top 10 by default (all tables, as usual, are fully searchable, expandable, and sortable). [continue reading…]

{ 16 comments }

Adjusting for strength of schedule is important

Adjusting for strength of schedule is important.

Every year at Footballguys.com, I publish an article called Rearview QB, which adjusts the fantasy football statistics for quarterbacks (and defenses) for strength of schedule. I’ve also done the same thing for years (including last season) using ANY/A instead of fantasy points, which helps us fully understand the best and worst real life performances each year. Today I deliver the results from 2013.

Let’s start with the basics. Adjusted Net Yards per Attempt is defined as (Passing Yards + 20 * Passing Touchdowns – 45 * Interceptions – Sack Yards Lost) divided by (Pass Attempts plus Sacks). ANY/A is my favorite explanatory passing statistic — it is very good at telling you the amount of value provided (or not provided) by a passer in a given game, season, or career.

Let’s start with some basic information. The league average ANY/A in 2013 was 5.86, a slight downgrade from 2012 (5.93). Nick Foles led the way with a 9.18 ANY/A average last year, the highest rate in the league among the 45 passers with at least 100 dropbacks. Since the Eagles quarterback had 317 pass attempts and 28 sacks in 2013, that means he was producing 3.32 ANY/A (i.e., his Relative ANY/A) over league average on 345 dropbacks. That means Foles is credited with 1,145 Adjusted Net Yards above average, a metric labeled “VALUE” in the table below. Of course, Peyton Manning led the league in that category last year, with a whopping 2,037 Adjusted Net Yards over Average.

RkNameTmCmpAttPydTDINTSkSkYdDBANY/AVALUE
1Peyton ManningDEN45065954775510181206778.872037
2Nick FolesPHI2033172891272281733459.181145
3Drew BreesNOR44665051623912372446877.511130
4Philip RiversSDG37854444783211301505747.791107
5Aaron RodgersGNB1932902536176211173118665
6Josh McCownCHI149224182913111372358.54629
7Russell WilsonSEA2574073357269442724517.1555
8Tony RomoDAL34253538283110352725706.54384
9Colin KaepernickSFO2434163197218392314556.65358
10Matthew StaffordDET37163446502919231686576.4355
11Andy DaltonCIN36358642933320291826156.29265
12Ben RoethlisbergerPIT37558442612814422826266.24238
13Tom BradyNWE38062843432511402566686.13175
14Michael VickPHI7714112155315991566.93166
15Jay CutlerCHI22435526211912191323746.23136
16Andrew LuckIND3435703822239322276026.06120
17Sam BradfordSTL159262168714415972776.166
18Alex SmithKAN3085083313237392105475.9441
19Matt McGloinOAK1182111547886532175.9622
20Jake LockerTEN111183125684161051995.68-36
21Matt CasselMIN153254180711916852705.69-46
22Brian HoyerCLE5796615536481025.22-66
23Cam NewtonCAR29247333792413433365165.69-88
24Thaddeus LewisBUF93157109243181001755.35-89
25Ryan FitzpatrickTEN21735024541412211093715.62-90
26Matt RyanATL43965145152617442986955.72-103
27Carson PalmerARI36257242742422412896135.67-119
28Matt FlynnGNB124200139285241352245.32-121
29Case KeenumHOU137253176096192012725.4-126
30Kellen ClemensSTL142242167387211382635.25-162
31Jason CampbellCLE1803172015118161043335.32-182
32Robert GriffinWAS27445632031612382744945.48-188
33Christian PonderMIN152239164879271192664.75-296
34EJ ManuelBUF1803061972119281593344.87-330
35Josh FreemanTAM63147761248611553.61-349
36Kirk CousinsWAS81155854475321603.67-351
37Brandon WeedenCLE141267173199271802944.51-398
38Mike GlennonTAM2474162608199403144564.98-405
39Matt SchaubHOU21935823101014211623794.53-504
40Terrelle PryorOAK1562721798711312033034.09-537
41Chad HenneJAX30550332411314382435414.86-544
42Ryan TannehillMIA35558839132417583996465-559
43Eli ManningNYG31755138181827392815904.53-788
44Geno SmithNYJ24744330461221433154864.17-824
45Joe FlaccoBAL36261439121922483246624.5-904

Manning paces in the field in Value over average, of course: that’s not surprising when the future Hall of Famer set the single-season record for passing yards and passing touchdowns. Foles, Drew Brees, and Philip Rivers formed the next tier of quarterbacks, far behind Manning but well ahead of the rest of the league.

And at the bottom of the list was the defending Super Bowl MVP, Joe Flacco. With a 4.50 ANY/A average, Flacco only edged out four other quarterbacks in that statistic, and none of the other passers came close to accumulating as many dropbacks as Flacco. After him comes the two New York quraterbacks, Geno Smith and Eli Manning.

But the point of today’s post is to adjust those numbers for strength of schedule. The solution is this post — a methodology I’ve labeled Rearview adjusted net yards per attempt, which adjusts those numbers for strength of schedule. The system is essentially the same as the one used in the Simple Rating System. Let’s look at Matt Ryan, who averaged 5.72 ANY/A last season, on 695 dropbacks. If we want to find Ryan’s SOS-adjusted rating, we need an equation that looks something like this: [continue reading…]

{ 19 comments }
Next Posts Previous Posts