≡ Menu
One of the two greatest quarterbacks of the first half of the 20th century

One of the two greatest quarterbacks of the first half of the 20th century.

The comments to Parts I and II of this series have been great, so let me start with a thank you. One of the more difficult parts of this process is comparing players across eras not just for efficiency, but for gross volume. In 2013, teams averaged 38.0 pass attempts (including sacks) per game, compared to just 24.5 in 1956. A great quarterback will be above average in either era, but it’s easier for great quarterbacks to accumulate above-average value when they play in a high-dropback era.

So what’s the solution? Simply pro-rating the numbers feels a bit too dramatic; we got into a similar issue with True Receiving Yards, and our solution there was to take a (literal) middle ground approach. I thought it would be fun to apply the same philosophy here. Over the course of the 96 league seasons in this study, the average number of league-wide dropbacks per game was 26.1. If we were going to do a 1:1 adjustment, we would then multiply each quarterback’s value in 2013 by 0.687, since that’s the result of 26.1 divided by 38. Instead, I decided to split the baby, and take the average of 0.687 and 1.000, which means modifying the VALUE metric for each quarterback in 2013 by 84.4%. On the other hand, a quarterback in 1956 now gets his VALUE multiplied by 103%, and a passer in 1937 sees his score multiplied by 129.0%.

The table below shows the revised single-season leader list. Here’s how to read it, which will explain why Dan Marino climbs back ahead of Tom Brady into the top spot on the list.  Under the old system, Marino had a value of 2,267 yards above average, but with the modifier, he gets downgraded to an adjusted value of 1981; of course, Brady’s modifier is more severe, which is why Marino vaults him.  Meanwhile, thanks to a 110.3% modifier, Sid Luckman’s 1943 season [1]Note that there is already a 25% deflation rate built into all seasons during World War II. Luckman’s numbers that year were insane. The Bears averaged 9.2 ANY/A, while the rest of the seven … Continue reading jumps ahead of Peyton Manning’s 2004 season, which has a modifier of 88.1%.  The table below shows the top 200 single seasons using this formula. [continue reading…]

References

References
1 Note that there is already a 25% deflation rate built into all seasons during World War II. Luckman’s numbers that year were insane. The Bears averaged 9.2 ANY/A, while the rest of the seven teams averaged just over two ANY/A. And even that understates things, as Luckman’s backup significantly deflated Chicago’s average.
{ 26 comments }

These two men look important

The two best regular season quarterbacks of all time?

Yesterday, I explained the methodology behind the formula involved in ranking every quarterback season since 1960. Today, I’m going to present the career results. Converting season value to career value isn’t as simple as it might seem. Generally, we don’t want a player who was very good for 12 years to rank ahead of a quarterback who was elite for ten. Additionally, we don’t want to give significant penalties to players who struggled as rookies or hung around too long; we’re mostly concerned with the peak value of the player.

What I’ve historically done — and done here — is to give each quarterback 100% of his value or score from his best season, 95% of his score in his second best season, 90% of his score in his third best season, and so on. This rewards quarterbacks who played really well for a long time and doesn’t kill players with really poor rookie years or seasons late in their career. It also helps to prevent the quarterbacks who were compilers from dominating the top of the list. For visibility reasons, the table below displays only the top 25 quarterbacks initially, but you can change that number in the filter or click on the right arrow to see the remaining quarterbacks. [1]Note that while yesterday’s list was just from 1960 to 2013, the career list reflects every season in history, using the same methodology as used in GQBOAT IV.

Here’s how to read the table. Manning’s first year was in 1998, and his last in 2013. He’s had 8,740 “dropbacks” in his career, which include pass attempts, sacks, and rushing touchdowns. His career value — using the 100/95/90 formula [2]And including negative seasons. is 12,769, putting him at number one. His strength of schedule has been perfectly average over his career; as a reminder, the SOS column is shown just for reference, as SOS is already incorporated into these numbers (so while Tom Brady has had a schedule that’s 0.25 ANY/A tougher than average, that’s already incorporated into his 10,063 grade). Manning is not yet eligible for the Hall of Fame, of course, but I’ve listed the HOF status of each quarterback in the table. Note that I only have quarterback records going back to 1960; therefore, for quarterbacks who played before and during (or after) 1960, only their post-1960 record is displayed. In addition, SOS adjustments are only for the years beginning in 1960. [continue reading…]

References

References
1 Note that while yesterday’s list was just from 1960 to 2013, the career list reflects every season in history, using the same methodology as used in GQBOAT IV.
2 And including negative seasons.
{ 109 comments }
Can you spot the GOAT?

Can you spot the GOAT?

In 2006, I took a stab at ranking every quarterback in NFL history. Two years later, I acquired more data and made enough improvements to merit publishing an updated and more accurate list of the best quarterbacks the league has ever seen. In 2009, I tweaked the formula again, and published a set of career rankings, along with a set of strength of schedule, era and weather adjustments, and finally career rankings which include those adjustments and playoff performances.  And two years ago, I revised the formula and produced a new set of career rankings.

This time around, I’m not going to tweak the formula much (that’s for GQBOAT VI), but I do have one big change that I suspect will be well-received.  Let’s review the methodology.

Methodology

We start with plain old yards per attempt. I then incorporate sack data by removing sack yards from the numerator and adding sacks to the denominator. [1]I have individual game sack data for every quarterback back to 2008. For seasons between 1969 and 2007, I have season sack data and team game sack data, so I was able to derive best-fit estimates for … Continue reading To include touchdowns and interceptions, I gave a quarterback 20 yards for each passing touchdown and subtracted 45 yards for each interception. This calculation — (Pass Yards + 20 * PTD – 45 * INT – Sack Yards Lost) / (Sacks + Pass Attempts) forms the basis for Adjusted Net Yards per Attempt, one of the key metrics I use to evaluate quarterbacks. For purposes of this study, I did some further tweaking. I’m including rushing touchdowns, because our goal is to measure quarterbacks as players. There’s no reason to separate rushing and passing touchdowns from a value standpoint, so all passing and rushing touchdowns are worth 20 yards and are calculated in the numerator of Adjusted Net Yards per Attempt. To be consistent, I also include rushing touchdowns in the denominator of the equation. This won’t change anything for most quarterbacks, but feels right to me. A touchdown is a touchdown.

Now, here comes the twist.  In past year, I’ve compared each quarterback’s “ANY/A” — I put that term in quotes because what we’re really using is ANY/A with a rushing touchdowns modifier — and then calculated a value over average statistic after comparing that rate to the league average. For example, if a QB has an “ANY/A” of 7.0 and the NFL average “ANY/A” is 5.0, and the quarterback has 500 “dropbacks” — i.e., pass attempts plus sacks plus rushing touchdowns — then the quarterback gets credit for 1,000 yards above average. [continue reading…]

References

References
1 I have individual game sack data for every quarterback back to 2008. For seasons between 1969 and 2007, I have season sack data and team game sack data, so I was able to derive best-fit estimates for each quarterback in each game. For seasons between 1960 and 1969, I gave each quarterback an approximate number of sacks, giving him the pro-rated portion of sacks allowed by the percentage of pass attempts he threw for the team.
{ 41 comments }

Andrew Luck and Quarterback Help

Luck confuses defenders, statisticians

Luck confuses defenders, statisticians.

It’s no secret that Andrew Luck’s efficiency numbers aren’t quite up to par with his reputation. Over the past two seasons, Luck ranks just 18th in ANY/A, far behind some of the other young quarterbacks in the NFL. Nick Foles, Russell Wilson, and Colin Kaepernick rank in the top 6th in that metric, Robert Griffin is 11th, Cam Newton is 14th, and even Andy Dalton is 16th. Luck tends to fare much better in ESPN’s QBR than in ANY/A (and Andy Benoit wrote an interesting pro-Luck piece yesterday), but today I wanted to try to quantify another issue: quarterback help.

A quick disclaimer: there are probably a zillion different ways to quantify quarterback help. This is certainly not not not the best way, but it’s the way that was easiest and most intuitive to me. On the scale of “this feels right” to “rigorous quantitative analysis” this certainly falls closer to the former end of the scale. But it’s Friday and we’re having fun, so here’s what I did.

1) Calculate how many standard deviations from average each team was in Points Allowed (negative means fewer points allowed).

2) Calculate how many standard deviations from average each team was in Pass Ratio (negative means more run-heavy).

3) Add the two standard deviations to see how much each team relied on each quarterback’s arm.

Here were the 2013 results. According to this, no quarterback was asked to do more than Matt Ryan. Here’s how to read the table below: The Falcons allowed 443 points last year, which was 1.05 standard deviations more than the average team. Atlanta also passed on 68.7% of all plays, which was 1.99 standard deviations above average. Add those together, and the Falcons get a grade of +3.04, the most in the NFL in 2013. [continue reading…]

{ 14 comments }

Blake Bortles, Johnny Manziel, and Teddy Bridgewater were selected in the first round of the 2014 Draft. The Jaguars seem intent on giving Bortles a redshirt year, but it seems likely that the Browns and Vikings will hand their rookie quarterbacks the reins at some point early this fall.

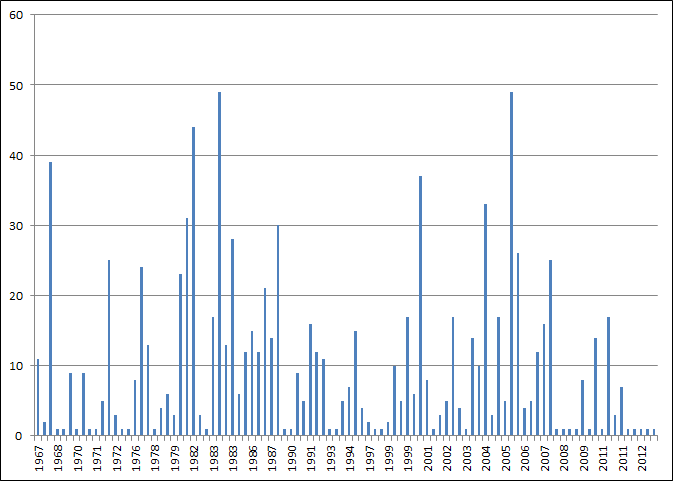
From the first common draft in 1967, until 2013, there were 96 quarterbacks selected in the first round of the draft. [1]Ignoring Rich Campbell, the only quarterback in the study to never start a game, and all quarterbacks taken in supplemental drafts. Today’s post looked at how long it took each quarterback to start his first game. For each quarterback, I assumed 16 game seasons for all seasons where the quarterback sat on the bench. Two quarterbacks, Jim Kelly and Aaron Rodgers, sat three full seasons before starting in week 1 of their 4th year; that means both players get an estimated first start of game 49. [2]Of course, Kelly and Rodgers didn’t start for pretty different reasons: Kelly was in the USFL, while Rodgers was sitting behind Brett Favre. Twenty-eight quarterbacks (29% of our sample) started their team’s first game in the year they were drafted; as a result, those quarterbacks get an estimated first start of game 1. The graph below shows how long it took each quarterback to start his first game; the X-axis represents draft year, and the Y-axis estimated number of games.

QB starts [continue reading…]

References

References
1 Ignoring Rich Campbell, the only quarterback in the study to never start a game, and all quarterbacks taken in supplemental drafts.
2 Of course, Kelly and Rodgers didn’t start for pretty different reasons: Kelly was in the USFL, while Rodgers was sitting behind Brett Favre.
{ 9 comments }

Who is the Best Backup Quarterback Ever?

That's a pretty good backup.

That's a pretty good backup.

Determining the best backup quarterback ever is really complicated. Steve Young and Aaron Rodgers backed up Joe Montana and Brett Favre, respectively, but neither Young nor Rodgers morally feel like they belong in the discussion of best backup quarterbacks.

There are a couple of ways to measure how a backup quarterback fares. One way is on a game-by-game approach: i.e., the starter gets injured or pulled, and now the backup is in charge. That’s the sort of thing Frank Reich, at least anecdotally, excelled at. [1]Post for another day (or another author): Which quarterbacks were the best off the bench? The more interesting, and easier question to analyze, is to take a season-by-season approach. If a quarterback does not start his team’s season opener, he’s a backup. If he does, he’s not.

Using that concept, the name that immediately jumps to mind is Earl Morrall.  After all, he led two teams to Super Bowls during seasons that began with him on the bench. But what do the numbers say?

Ironically, my proposed definition excludes what is undoubtedly the greatest season in backup quarterback history: Kurt Warner in 1999. That season may have been a top-three season in quarterback history, but it began with Warner second on the depth chart to Trent Green. When Rodney Harrison ended Green’s season in the preseason, Warner become the starter, which would exclude his ’99 season from this analysis.

And, uh, ironically again, Morrall’s best season is excluded, too.  His top year was in 1968 when he won the NFL MVP, but since Johnny Unitas was injured in the preseason, Morrall isn’t labeled a backup by this formula, either. But I do think that the Warner and Morrall examples are rare enough that we can proceed with minimal concern. [continue reading…]

References

References
1 Post for another day (or another author): Which quarterbacks were the best off the bench?
{ 12 comments }

The Evolution of Quarterbacks

Get your roll on 'Pepp

Get your roll on 'Pepp.

With the NFL draft approaching, you’ll hear a lot of statements about how the quarterback position is changing. Mobile quarterbacks are now “in”, which is a good thing for Johnny Manziel. A 6’4 frame is no longer required, which is a good thing for… well, Manziel, and negates some of the value of a player like Blake Bortles or Tom Savage. And, heck, do you even need to get a quarterback in the first round? If Teddy Bridgewater falls to the second round, how much of an outlier does that make him? What about say, Aaron Murray, who is both short and expected to be a late round pick?

I can’t tell you how any of the prospects in this year’s draft will turn out, but I can walk you through how the quarterback position has changed over the course of NFL history.

Methodology

For all three variables, I will be using the same methodology to measure “league average” in each season.  Each player in each year gets credit for his percentage of league-wide pass attempts in the season multiplied by his value in each variable.  For example, when calculating the 2013 league average, Peyton Manning’s [rushing numbers, height, draft position] was worth 3.6% of the league average, while in 1958, Johnny Unitas’s [rushing, height, draft position] was worth 6.7% of the league average. This gives us a weighted average for each variable, weighted by the number of pass attempts by that quarterback. [continue reading…]

{ 5 comments }
Luck's rushing ability makes him a QBR star

Luck's rushing ability makes him a QBR star.

A few weeks ago, I put ESPN’s Total QBR under the microscope. Today, I want to look at the quarterbacks whose passing statistics most differ from their QBR grades.

Total QBR grades go back to 2006, so to start, I ran a regression using Adjusted Net Yards per Attempt to predict Total QBR. The best-fit formula was:

Total QBR = -13.5 + 11.23 * ANY/A

For those curious, the R^2 was 0.80, indicating a very strong relationship between ANY/A and Total QBR. What this formula tells us is that a passer needs to average 5.65 ANY/A to be “projected” to have a QBR of 50; from there, every additional adjusted net yard per attempt is worth 11.2 points of QBR. Last year, Peyton Manning averaged 8.87 ANY/A, which projects to a QBR of 86.2. In reality, Manning had a QBR of “only” 82.9; this means Manning’s QBR says he wasn’t quite as amazing as his excellent efficiency numbers would indicate (to say nothing of his otherworldly gross numbers). One likely reason for this result is that Manning ranked 29th in average pass length in the air (according to NFLGSIS) and 6th in yards after the catch per completion; this matters because ESPN gives more credit to quarterbacks on the yards they accumulate through the air. (Throughout this post, we will be forced to deal with educated guesses, because Total QBR is a proprietary formula.)

As it turns out, Manning rating higher in actual QBR than projected QBR is a stark departure from prior years. In 2012, he finished 7.2 points higher in actual QBR than projected QBR, but that’s nothing compared to his time with the Colts. In five years in Indianapolis during the Total QBR era, Manning finished at least 10 points higher in actual QBR each season.

Along with Manning, Matt Ryan and Andrew Luck are the two quarterbacks who are most likely to over-perform relative to their “projected” ratings. Let’s be careful about exactly what this means: whatever the ingredients that go into the QBR formula that don’t go into the ANY/A formula, Manning, Ryan, and Luck seem to have a lot of them.

Luck is a fascinating case. In 2012, he ranked just 20th in ANY/A, but 11th in QBR. I wrote several articles during Luck’s rookie season about how his QBR ratings surpassed his standard stats. [1]Although now I can’t recall if his 2012 ratings were inflated because of his 4th quarter comebacks.  And I can’t check, because once ESPN decided to cap the clutch weight associated with … Continue reading Last year, he ranked 16th in ANY/A and 9th in QBR. Does this make Luck the quarterback most underrated (if you buy into QBR) by his traditional passing numbers (if you buy into ANY/A)? [continue reading…]

References

References
1 Although now I can’t recall if his 2012 ratings were inflated because of his 4th quarter comebacks.  And I can’t check, because once ESPN decided to cap the clutch weight associated with each play, they retroactively applied the current formula across past years.
{ 11 comments }

Is Matt Schaub washed up? Is he the next Jake Delhomme? For the first six seasons of his Texans career, Schaub was an above-average quarterback in both Net Yards per Attempt and Adjusted Net Yards per Attempt. But last year was disastrous in a way that his poor conventional stats fail to completely capture (for example, Schaub threws picks six in four straight games).

But does that mean hope is lost? Schaub turns 33 in June, which means more than you might think. Sure, Peyton Manning and Tom Brady can defy the odds, but 33 is still six years to the right side of the peak age for passers. Perhaps even more damning, Schaub’s steep decline in 2013 was his second in two years; he averaged 7.8 ANY/A in 2011, 6.5 in 2012, and then 4.5 last year; his NY/A averages (7.7, 6.6, 5.7) have followed a similar pattern. The graph below shows Schaub’s Relative NY/A and Relative ANY/A — i.e., his averages compared to league average — for each year of his Texans career:

[continue reading…]

{ 21 comments }

One of the very first posts at Football Perspective measured how various passing stats were correlated with wins.  One of the main conclusions from that post was that passer rating, because of its heavy emphasis on completion percentage and interception rate, was not the ideal way to measure quarterback play. But what about ESPN’s Total QBR, a statistic invented specifically to improve on — and supersede — traditional passer rating?

As a reminder, we can’t simply correlate a statistic with wins to determine the utility of that metric. The simplest way to remember this is that 4th quarter kneeldowns are highly correlated with wins. Just because you notice it’s raining when the ground is wet doesn’t mean a wet ground causes rain; i.e., just because two variables are correlated doesn’t mean variable A leads to variable B (alternatively, variable B could lead to variable A, variable C could lead to both variable A and B, or the sample size could be too small to determine any legitimate causal relationship). That said, it at least makes sense to begin with a look at how various statistics have correlate with wins.

The Sample Set

Throughout this post, I will be looking at a set of quarterback data consisting of the 152 quarterback seasons from 2006 to 2013 where the player had at least 14 games with 20+ action plays. Games where the quarterback had fewer than 20 plays were excluded, but the quarterback was still included if he otherwise had 14 such games.

The next step was to sum the weekly quarterback data on various metrics, including wins, and create season data. [1]For ESPN’s QBR, I took a weighted average of the weekly QBR data. I should note that this is not the way ESPN calculates QBR. As explained to me via email, the scaling function that gives the … Continue reading This allowed me to measure the correlation between a quarterback’s statistics over those 14+ games with that player’s winning percentage in those games.

As it turns out, ESPN’s Total QBR is very highly correlated with wins, with a 0.68 correlation coefficient. [2]As a reminder, the correlation coefficient is a measure of the linear relationship between two variables on a scale from -1 to 1. If two variables move in the same direction, their correlation … Continue reading This is to be expected; after all, Total QBR is based off Expected Points Added on the team level, which generally tracks wins and losses. The second most correlated statistic with wins was Adjusted Net Yards per Attempt, my favorite non-proprietary quarterback metric. After ANY/A, both traditional passer rating and touchdowns per attempt were the next most correlated statistics with wins (after all, this is only a step or two away from saying scoring points is correlated with wins). In another unsurprising result, passing yards had almost no correlation with wins, while pass attempts had a slight negative correlation (as any Game Scripts observer would know).  Take a look:

StatCC
ESPN QBR0.68
ANY/A0.57
Passer Rating0.56
TD/Att0.54
NY/A0.46
Yd/Att0.45
INT/Att-0.43
Cmp%0.33
Sack Rate-0.21
Pass Yds0.16
Attempts-0.10

When ESPN first introduced QBR, I wrote that I was intrigued by the possibility of this metric, but frustrated that the specific details of the formula remained confidential. At the time, a clutch weight feature was included in the calculations, which made the metric more of a retrodictive statistic than a predictive one. Since then, ESPN has tweaked the formula several times, and the clutch weight has been capped. [3]When Dean Oliver was on the Advanced NFL Stats podcast, he noted that the formula was tweaked in 2013 so that the “clutch index” part of the formula was essentially capped. He added … Continue reading ESPN is not engaged in academia, so I understand why they have not published all the fine print; as a researcher, I’m still frustrated by that decision. Still, with 8 years of QBR data now publicly available, we can answer two questions: does Total QBR predict wins and how sticky is Total QBR?

We know that a high Total QBR is correlated with winning games, but we also know that there’s limited value to such a statement. If having a high Total QBR was one of the driving factor behind winning games, than such a variable would manifest itself in all games, not just the current one. So with my sample of 152 quarterbacks, I used a random number generator to divide each quarterback season into two half-seasons. Then I calculated each quarterback’s average in several different categories and measured the correlation between a quarterback’s average in such category in each half-season with his winning percentage in the other half-season. [4]Then I did the entire process again, using a new set of random numbers, and averaged the results. The results:

StatCC
ESPN QBR0.31
Wins0.28
ANY/A0.25
Passer Rating0.25
TD/Att0.24
NY/A0.22
Yd/Att0.20
Cmp%0.17
Pass Yds0.16
INT/Att0.15
Sack Rate0.14
Attempts0.06

As you would expect, all of our correlations are now smaller. But ESPN’s quarterback rating metric remains the best measure to predict wins. Perhaps even more impressively, Total QBR is more correlated with future wins than past wins. That’s pretty interesting. Another interesting result is that passer rating fares pretty well here, although much of the same issues as before remain with using correlation to derive causal direction. [5]For example, because passer rating is biased towards high completion percentage and low interception rates, quarterbacks who play with the lead tend to produce strong passer ratings; well, playing … Continue reading

One other concept to remember is that our sample of quarterbacks consists of players who were heavily involved in at least 14 games. That makes sure Peyton Manning, Tom Brady, and Drew Brees are involved, while filtering out some Christian Ponder, Blaine Gabbert, and Brandon Weeden seasons. In other words, the data set contains more above-average quarterbacks than a random sample would, so we may not be able to justify certain conclusions from this study.

The other important question is whether Total QBR is predictive of itself; i.e., how “sticky” is this metric over different time periods. We know that interceptions are very random, and knowing a quarterback’s prior interception rate is not all that helpful in predicting his future interception rate. Where does Total QBR fall along those lines?

StatCC
Pass Yds0.69
Attempts0.66
Sack Rate0.56
Cmp%0.49
Passer Rating0.49
ESPN QBR0.47
ANY/A0.46
NY/A0.45
TD/Att0.43
Yd/Att0.42
Wins0.28
INT/Att0.2

The most “sticky” stats were passing yards and pass attempts, which in retrospect isn’t too surprising. These reflect the style of the offense, the talent of the quarterback, and the quality of the defense, so they should be easier to predict. The second-least sticky metric was wins, which also makes sense. After that, ESPN’s Total QBR fits in a narrow tier with most of our other metrics as being somewhat predictable.

Conclusion

The numbers here indicate that Total QBR is worth examining.  It may be a proprietary measure of quarterback play, but it’s not a subjective one with no basis in reality.  It does seem to be the “best” measure of quarterback play, although whether the tradeoff in accuracy for transparency is worth it remains up to each individual reader. One of the drawbacks I see in Total QBR is the failure to incorporate strength of schedule. And while no other traditional passer metric does, either, it’s also easy enough to make those adjustments. Hopefully, an SOS-adjusted Total QBR measure will be released soon (I’ll note that the college football version does include a strength-of-schedule adjustment).  My sense is that Total QBR is underutilized because (1) ESPN haters hate it because it’s an ESPN statistic, (2) it’s proprietary, and (3) analytics types disliked it because of the (now-eliminated) clutch rating.  While I would not suggest making it the only tool at your disposal, it does appear to deserve a prominent place in your toolbox.

References

References
1 For ESPN’s QBR, I took a weighted average of the weekly QBR data. I should note that this is not the way ESPN calculates QBR. As explained to me via email, the scaling function that gives the “final” QBR on a 0-100 scale is nonlinear; as a result, you can’t just calculate a weighted average of the individual game QBR values to get season QBR. Instead, you need to have the “points per play”-like value that’s behind QBR and calculate the weighted average of that (and weight based on the capped clutch weights, not even the action plays), then re-apply the scaling function to get it back on the 0-100 scale. So while I’m recreating QBR, I’m not recreating it the way ESPN would. That disclaimer aside, I don’t think my method will bias these results.
2 As a reminder, the correlation coefficient is a measure of the linear relationship between two variables on a scale from -1 to 1. If two variables move in the same direction, their correlation coefficient will be close to 1. If two variables move with each other but in opposite directions (say, the number of hours you spend watching football and your significant other’s happiness level), then the CC will be closer to -1. If the two variables have no relationship at all, the CC will be close to zero.
3 When Dean Oliver was on the Advanced NFL Stats podcast, he noted that the formula was tweaked in 2013 so that the “clutch index” part of the formula was essentially capped. He added (beginning at 13:45): “The most clutch plays are ending up counting essentially the same as all other plays. [What] we ended up deciding is that for games that are out of reach, when quarterbacks are putting up meaningless statistics because they are playing against a defense that is not trying as hard because they know that the game is essentially over – so that you can get your yards but we’re just trying to run out the clock – so we still keep in a clutch weight reduction effectively, associated with garbage time. But there isn’t the increase in clutch weight associated with clutch plays.”
4 Then I did the entire process again, using a new set of random numbers, and averaged the results.
5 For example, because passer rating is biased towards high completion percentage and low interception rates, quarterbacks who play with the lead tend to produce strong passer ratings; well, playing with the lead is pretty highly correlated with winning, and winning is also correlated with future wins.
{ 27 comments }
Sanchez tries to understand the formula for wins above expectation

Sanchez tries to understand the formula for wins above expectation.

On Friday, the Jets released Mark Sanchez. I don’t have much in the way of a post mortem, but it felt odd not to have at least some post on the subject. And despite watching every Sanchez start for four years, it still takes me by surprise when I see that his career record is 33-29. That winning record came despite Sanchez being one of the worst starters in the league for most of his career. Through five seasons, he has a career Relative Adjusted Net Yards per Attempt average of -1.03. Among the 140 quarterbacks to enter the NFL since 1970 who have started 40 games, only one other passer (who will remain nameless for now) had a winning record with a worse RANY/A than Sanchez; the next worst quarterback with a winning record over that time frame is Trent Dilfer, who finished 58-55 with a career -0.85 RANY/A.

If you grade quarterbacks by #Winz, Sanchez is above-average. If you look at passing statistics — i.e., ANY/A — he’s one of the worst in the league. So I thought I would quantify that gulf and see if Sanchez was the quarterback with the largest disparity between winning percentage and passing statistics.

First, I ran a regression on team wins (pro-rated to 16 games) and Relative ANY/A for every year since 1970. The best fit formula was 8.00 + 1.756 * RANY/A. In other words, for every 1.00 ANY/A above league average, a team should expect to win 1.756 more games. For a team to expect to win 11 games, they need to finish 1.71 ANY/A better than average.

Next, I calculated the career RANY/A — i.e., the ANY/A relative to league average — for every quarterback to enter the league since 1970. For example, Sanchez has a RANY/A of -1.03. This means you would expect his teams to win 6.19 games every season, for a 0.387 winning percentage. In reality, Sanchez’s Jets have a 0.632 winning percentage, which means he has an actual winning percentage that is 0.146 higher than his expected winning percentage. As it turns out, that differential puts him in the top ten, but it is not the best mark.

That honor belongs to Mike Phipps. Here’s how to read the table below, which shows all 140 quarterbacks to enter the league since 1970 and start at least 40 games. Phipps entered the league in 1970 and last played in 1981, starting 71 games in his career. He finished with a career RANY/A of -1.52; as a result, he “should have” won only 23.6 games. In reality, he won 39 games, meaning he won 15.4 more games than expected. On a percentage basis, his RANY/A would imply a .333 expected winning percentage; his actual winning percentage was 0.549, and that difference of +0.216 is the highest in our sample. [continue reading…]

{ 11 comments }

Wazzup????

Wazzup????

Some quarterbacks and wide receivers just go together. Peyton Manning and Marvin Harrison. Dan Marino and Mark Clayton and Mark Duper. Joe Namath and Don Maynard. John Hadl and Lance Alworth. But quarterbacks play with lots of receivers, and receivers generally play with several quarterbacks. We don’t remember most combinations, but that doesn’t mean they were all unproductive. So I thought it might be interesting to look at every wide receiver since 1950, find his best single season in receiving yards, and record who was his team’s primary quarterback that season.

Jerry Rice’s best year came with Steve Young, not Joe Montana. Randy Moss set the touchdown record with Tom Brady, but his best year in receiving yards was with Daunte Culpepper. Lynn Swann’s best year was with Terry Bradshaw, but John Stallworth’s top season in receiving yards came with Mark Malone. James Lofton’s best season was with Lynn Dickey, Isaac Bruce’s best year was with Chris Miller, Torry Holt’s top season came with Marc Bulger, and Tim Brown’s top year was with Jeff George.

This is little more than random trivia, but this site does not have aspirations for March content higher than random trivia. In unsurprising news, 25 different players had their best season in receiving yards (minimum 300 receiving yards) while playing with Brett Favre. That includes a host of Packers, but also a couple of Jets and Vikings, too (including one future Hall of Famer).

After Favre, Marino is next with 22 players, and he’s followed by Manning and Fran Tarkenton (20). From that group, I suspect that Tarkenton might surprise some folks. That is, unless they realized that he was the career leader in passing yards when he retired and played for five years with the Giants and thirteen with Minnesota.

The table below shows every quarterback who was responsible for the peak receiving yards season of at least five different receivers (subject to the 300 yard minimum threshold). For each quarterback, I’ve also listed all of his receivers. [continue reading…]

{ 10 comments }

Matt Schaub and a franchise quarterback in the same sentence

Matt Schaub and a franchise quarterback in the same sentence.

The Texans and Raiders recently made a couple of veteran quarterback acquisitions. The team with the first overall pick in May’s draft signed Ryan Fitzpatrick and then traded Matt Schaub to Oakland, owners of the fifth overall selection. Will either team now be deterred from spending a top five pick on Teddy Bridgewater, Blake Bortles, or Johnny Manziel? Putting aside your feelings on those players, one would certainly hope not simply as a matter of principle. The idea that a journeyman quarterback would cause an organization to pass on a potential franchise quarterback is absurd. If the Texans choose to select Jadeveon Clowney over a quarterback with the first overall pick, that’s fine, but the reason isn’t going to be because Houston is confident that Fitzpatrick is the quarterback of the future.

I thought it would be interesting to review the last 20 years of NFL history and identify situations where a team added a veteran quarterback and then still selected a passer in the first round of the draft. There weren’t quite as many examples as I originally expected, although part of the explanation is that there simply aren’t that many quarterbacks drafted in the first round, period. In addition, the 2011 lockout prevented this from happening that year, but teams that spent high picks on quarterbacks went after veterans once the lockout ended. Minnesota traded for Donovan McNabb after drafting Christian Ponder, the Titans signed Matt Hasselbeck and gave him the starting job over Jake Locker, and even the Panthers brought in Derek Anderson to do something for Cam Newton. But let’s look at some of the examples more similar to Schaub-to-Oakland or Fitzpatrick-to-Houston: [continue reading…]

{ 5 comments }

No, Peyton, you are #1

No, Peyton, you are #1.

While working on a different post, I needed to derive a quick-and-dirty formula to identify the top 100 or so quarterbacks in NFL history. Here is how I went about doing that:

1) Calculate the Relative ANY/A of each quarterback in every season since 1950. ANY/A, of course, is Adjusted Net Yards per Attempt, defined as (Gross Pass Yards + 20*Pass_TDs – 45*INTs – Sack Yards Lost) divided by (Pass Attempts + Sacks). For quarterback seasons before 1969, we do not have sack data, so that part of the analysis is ignored (I could have used estimated sack data, but I being lazy).

2) For each quarterback season, multiply each quarterback’s number of dropbacks by his Relative ANY/A to derive a Passing Value over Average metric.

3) Pro-rate non-16 game seasons to 16 games.

4) Calculate a career grade for each quarterback based on the sum of his best five seasons.

Then I realized that this data, while background material for a separate post, was probably interesting to folks in its own right.  Hence today’s post. You should not be surprised to see that Peyton Manning is number one on this list. Here’s how to read his line. His best year came in 2004, when he produced 2113 Adjusted Net Yards over Average. Last year was his second best season — his gross numbers were more impressive, of course, but he produced “only” 2,031 ANY over average. Manning’s other three best years came in ’06, ’05, and ’03. Overall, he produced 8,115 Adjusted Net Yards over Average over his five best seasons, the best of any quarterback in this study (by a large margin). The table below shows the top 100 passers since 1950 (you can change the number of quarterbacks displayed in the dropdown box). [continue reading…]

{ 71 comments }

Terry Bradshaw finished his career with 212 touchdowns, 210 interceptions and a 70.9 passer rating. Kurt Warner threw 208 touchdowns against only 128 interceptions, and his 93.7 passer rating ranks 8th in NFL history and 2nd among retired players. But Bradshaw played from 1970 to 1982, while Warner played from 1998 to 2009. As a result, comparing their raw statistics holds very little meaning. Comparing across eras is very challenging, but not impossible. And in this case, once you place the numbers in the proper context, Bradshaw’s numbers were arguably more impressive than Warner’s numbers.

Let’s start with Bradshaw and begin by looking at his Relative ANY/A for each year of his career. For new readers, ANY/A stands for Adjusted Net Yards per Attempt, defined as

(Gross Pass Yards + 20 * PTDs – 45 * INTs – Sack Yds)/(Attempts + Sacks)

Relative ANY/A simply compares a quarterback’s ANY/A average to league average, a necessary element when comparing quarterbacks across eras. In the graph below, the size of the bubble corresponds to how many attempts Bradshaw had in each season, while the Y-Axis shows Bradshaw’s Relative ANY/A (by definition, 0 is equal to league average).  The graph shows a clear story: for the first five years of his career, Bradshaw was a below-average quarterback, but over the rest of his career, he was one of the best in football. His best year came in 1978 when Bradshaw finished with a RANY/A of +2.0, which was the third best mark in football (only a hair behind Roger Staubach and Dan Fouts). Those stats, combined with a 14-2 record, led to Bradshaw being named the AP’s MVP that season. [continue reading…]

{ 41 comments }

Was Smith's fast finish a sign of things to come?

Was Smith's fast finish a sign of things to come?

In Geno Smith’s first 12 NFL starts, he completed 179 of 327 passes (54.7%) for 2,256 yards, with 8 touchdowns and 19 interceptions. Those numbers translate to a 6.9 yards per attempt average, quite respectable for a rookie, and a 4.8 Adjusted Yards per Attempt average, abysmal for anybody. But over the last four weeks of the year, Smith went 68/116 (58.6%) for 790 yards with 4 touchdowns and 2 interceptions. His yards per attempt actually went down slightly to 6.8, but he averaged 6.7 AY/A, much closer to league average. Touchdowns and interceptions are less sticky statistics than yards per attempt, but Jets fans looking for reasons for optimism would cling to the massive flip in touchdown-to-interception ratio over the final quarter of the season.

The real question is whether any of that matters. In general, I’m a Splits Happen type of analyst, but I thought I would run some numbers. As it turns out, perhaps there is some reason to think Smith’s strong December (subject to the caveats below) is a sign of good things to come.  Here’s what I did:

From 1990 to 2013, there were 51 quarterbacks who threw at least 224 passes during their rookie season. Toss out the 2013 rookies (EJ Manuel, Smith, and Mike Glennon), along with the nine quarterbacks who threw fewer than 100 passes in year two (Jimmy Clausen, Ryan Leaf, Kyle Orton, Chad Hutchinson, Andrew Walter, Bruce Gradkowski, Chris Weinke, Ken Dorsey, and Matt Stafford), and that leaves us with 39 quarterbacks who threw at least 224 passes as a rookie since 1990 and then at least 100 passes in their second season. For those quarterbacks, I calculated their Y/A and AY/A averages over their final 4 games of the season, and their Y/A and AY/A averages over the first 1-12 games of the season (with the 224 pass attempts minimum, I felt pretty confident that we would have a large enough sample on the “early” portion of the season).  Then I looked at how those 39 quarterbacks fared in their second years.

The table below shows all 39 quarterbacks, plus the 2013 rookies.  Here’s how to read the table below.  Heath Shuler, a rookie for Washington in 1994, had 150 “early” season attempts, defined as all pass attempts before the final 4 games of the season.  His early year Y/A average was 5.0 and his AY/A average was 2.8.  Shuler had 115 “late” season attempts, defined as pass attempts in the final four games.  His Y/A in the late part of the season was 7.9, and his AY/A was 7.8.  As a result, Shuler improved his Y/A by 3.0 and his AY/A by 5.0 over the final four games of the season.  In Year N+1 — i.e., 1995 for Shuler — he had 125 pass attempts, and averaged 6.0 Y/A and 3.9 AY/A. [continue reading…]

{ 10 comments }

On Friday, I explained the idea behind Playoff Leverage. That post is required reading before diving in today, but the summary is that the Super Bowl counts for more than the conference championship games, which count for more than the division round games, which count for more than the wild card games. The value that is assigned to each game — the Super Bowl is currently worth 3.14 times as much as the average playoff game — is then used to adjust the stats of the players in those games.

For quarterbacks, the main stat used to measure passing performance is Adjusted Net Yards per Attempt. In case you forgot, ANY/A is defined as

[math]Pass Yards + 20*PassTDs – 45*INTs – SackYards)/(Attempts + Sacks)[/math]

Today, we’re going to look at every quarterback since 1966. Players like Bart Starr and Johnny Unitas who played before 1966 will count, but their stats from 1965 and earlier will not be included. This obviously is a serious disservice to Starr in particular, but for now, I’m going to only focus on the Super Bowl era. [continue reading…]

{ 11 comments }

Even for Football Perspective, this is a very math-heavy post. I’ve explained all the dirty work and fine details behind this system, but if you want to skip to the results section, I’ll understand. Heck, it might even make more sense to start there and then work your way back to the top.

Background

In 2012, Neil Paine wrote a fascinating article on championship leverage in the NBA, building on Tom Tango’s work on the same topic in Major League Baseball. Championship Leverage was borne out of the desire to quantify the relative importance of any particular playoff game. Truth be told, this philosophy has more practical application in sports where each playoff round consists of a series of games. But Neil applied this system to the NFL playoffs and crunched all the data for every playoff game since 1965. Then he was kind enough to send it my way, and I thought this data would make for a good post.

The best way to explain Championship Leverage is through an example. For purposes of this exercise, we assume that every game is a 50/50 proposition. At the start of the playoffs, the four teams playing on Wild Card weekend all have a 1-in-16 chance of winning the Super Bowl (assuming a 50% chance of winning each of four games). This means after the regular season ended, the Colts had a 6.25% chance of winning the Super Bowl. After beating Kansas City, Indianapolis’ win probability doubled to 12.5%. Win or lose, the Colts’ Super Bowl probability was going to move by 6.25%, a number known as the Expected Delta.

New England, by virtue of a first round bye, began the playoffs with a 12.5% chance of winning the Lombardi. With a win over Indianapolis, the Patriots’ probability of winning the Super Bowl jumped 12.5% to 25%; had New England lost, the odds would have moved from 12.5% to zero. Therefore, the Expected Delta in a Division round game is 12.5%. [continue reading…]

{ 20 comments }

No, Peyton, you're the man

No, Peyton, you're the man.

In 1984, Dan Marino set an NFL record with 48 touchdown passes, but his Dolphins lost in the Super Bowl. Twenty years later, Peyton Manning broke Marino’s record, but he lost to the eventual Super Bowl champion Patriots in the playoffs. In 2007, Tom Brady broke Manning’s touchdowns record, but he lost in the Super Bowl, too.

When the greatest quarterback seasons of all time are discussed, these three years dominate the discussion. And with good reason. But if you include the playoffs — and frankly, there’s no reason not to include the playoffs — which quarterback produced the greatest season of all time? I’m going to stipulate that the greatest quarterback season ever has to end in a Lombardi Trophy, because otherwise, I think we’ll end up back in the world of Marino ’84/Brady ’07/Manning ’04. Of course, now another Manning season has entered the mix: and with a Super Bowl win, Manning’s 2013 should and would be remembered as the greatest quarterback season of all time.

So, the question becomes, which season would he knock off the top rung? I think there are six seasons that stand out from the rest, based on regular and postseason performance.

Honorable Mention [continue reading…]

{ 14 comments }

How quaint: a quarterback taking snaps form under center

How quaint: a quarterback taking snaps form under center.

With one game remaining, Peyton Manning has already set the new single-season record with 51 passing touchdowns (two months ago, I projected Manning to finish the season with 52 touchdowns). But all records must be viewed in their environment, and NFL teams are averaging 1.58 touchdown passes per team game this year, the highest average since 1948. In 1984, the year Dan Marino threw 48 touchdowns, teams averaged 1.37 touchdown passes per game.

So which season is more impressive? That’s a complicated question, and one that could be answered in many ways. In my view, the question boils down to which performance was more outstanding; in mathematical terms, we could define that as which season was farthest from the mean.

To make life a little simpler, I’m going to analyze this question on the team level, meaning we will compare “Denver 2013” to “Miami 1984.” Of course, this approach is preferable in many ways, since when we praise Manning we really mean “Manning with his offensive line and his coaching staff throwing to Demaryius Thomas, Wes Welker, Eric Decker, and Julius Thomas.” And “Marino in 1984” means “Marino and Mark Clayton and Mark Duper and Dwight Stephenson and Ed Newman.”

This season, the Broncos have 51 touchdown passes. The other 31 teams (through 15 games) are averaging 22.8 passing touchdowns, which means Denver is 28.2 touchdowns above average. The standard deviation of the 32 teams in passing touchdowns is 7.4; as a result, we can say that the Broncos are 3.84 standard deviations above average, also known as their Z-score.

In 1984, the other 27 teams (through 16 games) averaged 21.0 touchdowns, while the Dolphins threw 49 scores (Jim Jenson, a college quarterback who played receiver for Miami, threw a 35-yard touchdown to Duper against the Patriots off a Marino lateral). The standard deviation that season in touchdown passes at the team level was 7.5, which gives Miami a Z-score of 3.72 in 1984.

So the Broncos this season have been more extraordinary, at least by this measure. One nice thing about using the Z-score is we don’t need to adjust for games played. I went ahead and calculated the Z-scores for every team since 1932. The current Broncos are #1, with the ’84 Dolphins in second place. The third place team isn’t the Tom Brady 2007 Patriots; that team is down at #7, because the standard deviation in passing touchdowns among the league’s 32 teams was 8.8 that season. Instead, the third slot goes to the 1986 Dolphins. Few remember that Marino threw 44 touchdowns that season; add in Don Strock’s two touchdowns, a lower league average and a smaller standard deviation, and those Dolphins get a Z-score of 3.70.

Let’s look at the top 100 teams using this metric. The 2004 Colts ranked fifth (if you click on the cell in the team column, the link takes you to that team’s PFR page) in Z-score. That year, Indianapolis threw 51 touchdowns, while the other 31 teams averaged 21.97 touchdown passes. That means Indianapolis was 29.03 touchdowns above average, the highest production above average to date. But that year, the standard deviation among the 32 teams in passing touchdowns was 8.53, giving the Colts a Z-score of “only” 3.41; that’s why they’re 5th, not first.
[continue reading…]

{ 38 comments }
The Packers had a rough Movember without this guy

The Packers had a rough Movember without this guy..

Green Bay started the season 5-2 and seemed on its way to another playoff berth. But in the first quarter of the team’s eighth game, Aaron Rodgers broke his collarbone. The Packers lost that game (technically on Rodgers’ ledger as the starter), and have struggled ever since. In his stead, Seneca Wallace went 0-1, Scott Tolzien went 0-1-1, and then Matt Flynn got a chance to lose on Thanksgiving against the Lions before salvaging a win against the Falcons last Sunday.

Unsurprisingly, Green Bay is much worse without Rodgers. Using his .625 winning percentage as a starter this year, we might presume that the Packers would have won 3.125 out of the team’s five games that he’s missed. Instead, Green Bay has won 1.5 out of five games; that means Rodgers would have provided 1.625 Wins Above the Other QBs on the roster. (If we did not count the Bears game as a Rodgers game, then Rodgers would have provided 2.79 Wins Above the Other QBs.) Rodgers has been ruled out for the Packers’ pivotal week 15 showdown with the Cowboys; a loss there would bring Rodgers’ value up to 2.25 Wins Above the Other Green Bay QBs.

Where does that rank all time? The biggest discrepancy belongs to the 2002 Rams. The Rams started 0-4 under reigning NFL AP MVP Kurt Warner, and then lost the team’s next game when Jamie Martin started in relief of an injured Warner. For the sixth game, the team turned to Marc Bulger, who led the 0-5 team on a five game winning streak before suffering a finger injury just as the starting quarterback was ready to return. Warner started games 11 and 12, but another injury forced Martin started game 13; St. Louis lost all three games. Bulger then returned and won his 14th start. At that point in the year, St. Louis was 6-0 under Bulger and 0-8 under everyone else. In game 15 against Seattle, Bulger was hurt on the St. Louis’ fourth play from scrimmage; Martin came in and the team lost 30-10. The final game of the year was a meaningless one and started by Scott Covington, although Martin took most of the snaps in a victory over the 49ers.

All told, St. Louis went 6-1 in Bulger starts (including the Seahawks game), while the other Rams quarterbacks posted a 1-8 record. Since we would project a 1-8 team to win just 0.78 out of 7 games, Bulger is given credit for being 5.22 Wins Above the Other QBs for the team.

The table below shows all quarterbacks from 1950 to 2013 to produce at least 2 Wins Above the Other QBs for their team. The formula to calculate WAOQBs is simply the difference between the winning percentages with and without the starting quarterback multiplied by the number of starts by the quarterback or by the other quarterbacks on the team, whichever number is smaller. [continue reading…]

{ 6 comments }

Presented below, without comment, is a table of every matchup featuring Tom Brady & Peyton Manning as the starting quarterbacks. Enjoy:

DateHome TeamFavoritePatriots PassingColts/Broncos PassingAdvantageOutcome
2001-09-30NWECLT -11.513-23, 159 yds, 0 TD, 0 Int, 6.63 ANYPA25-43, 240 yds, 1 TD, 3 Int, 2.72 ANYPA+3.91, NWE44-13, NWE
2001-10-21CLTCLT -10.517-21, 262 yds, 4 TD, 0 Int, 16.29 ANYPA22-34, 305 yds, 1 TD, 0 Int, 8.55 ANYPA+7.73, NWE38-17, NWE
2003-11-30CLTCLT -3.526-35, 226 yds, 2 TD, 2 Int, 4.76 ANYPA29-48, 272 yds, 4 TD, 1 Int, 6.14 ANYPA+1.38, CLT38-34, NWE
2004-01-18 (C)NWENWE -3.522-37, 237 yds, 1 TD, 1 Int, 5.73 ANYPA23-47, 208 yds, 1 TD, 4 Int, 0.94 ANYPA+4.79, NWE24-14, NWE
2004-09-09NWENWE -326-38, 320 yds, 3 TD, 1 Int, 8.38 ANYPA16-29, 244 yds, 2 TD, 1 Int, 7.97 ANYPA+0.41, NWE27-24, NWE
2005-01-16 (D)NWENWE -118-27, 115 yds, 1 TD, 0 Int, 4.50 ANYPA27-42, 230 yds, 0 TD, 1 Int, 4.30 ANYPA+0.20, NWE20-3, NWE
2005-11-07NWECLT -325-40, 254 yds, 3 TD, 0 Int, 7.48 ANYPA28-37, 321 yds, 3 TD, 1 Int, 9.08 ANYPA+1.60, CLT40-21, CLT
2006-11-05NWENWE -2.520-35, 201 yds, 0 TD, 4 Int, 0.60 ANYPA20-36, 301 yds, 2 TD, 1 Int, 7.59 ANYPA+6.99, CLT27-20, CLT
2007-01-21 (C)CLTCLT -321-34, 226 yds, 1 TD, 1 Int, 5.74 ANYPA27-47, 330 yds, 1 TD, 1 Int, 6.10 ANYPA+0.36, CLT38-34, CLT
2007-11-04CLTNWE -521-32, 237 yds, 3 TD, 2 Int, 6.09 ANYPA16-27, 210 yds, 1 TD, 1 Int, 6.17 ANYPA+0.08, CLT24-20, NWE
2009-11-15CLTCLT -1.529-42, 364 yds, 3 TD, 1 Int, 8.61 ANYPA28-44, 316 yds, 4 TD, 2 Int, 6.80 ANYPA+1.81, NWE35-34, CLT
2010-11-21NWENWE -4.519-25, 178 yds, 2 TD, 0 Int, 8.38 ANYPA38-52, 396 yds, 4 TD, 3 Int, 6.56 ANYPA+1.83, NWE31-28, NWE
2012-10-07NWENWE -623-31, 193 yds, 1 TD, 0 Int, 6.09 ANYPA31-44, 324 yds, 3 TD, 0 Int, 8.35 ANYPA+2.26, DEN31-21, NWE
2013-11-24NWEDEN -2.534-50, 324 yds, 3 TD, 0 Int, 7.25 ANYPA19-36, 132 yds, 2 TD, 1 Int, 3.34 ANYPA+3.90, NWE34-31, NWE
{ 6 comments }

Is that Bayes?

Is that Bayes?

Peyton Manning is not a 51 touchdown per-season quarterback, but that doesn’t mean he won’t average the necessary 2.9 touchdowns per game over his final ten games this season to break Tom Brady’s touchdown record. Before the season, Footballguys.com projected Manning as a 2.38 passing touchdown per game player.  And while he has looked unstoppable thus far, with 22 touchdown throws in six games, Manning has been known to have great spurts before, too.  All quarterbacks have hot and cold streaks, Manning included.  From 2003 to 2012, after removing games where he sat late in the season, Manning averaged 2.17 passing touchdowns per game with a standard deviation of 1.31 touchdowns. [1]That was after removing week 17 of the ’04, ’05, ’07, ’08, and ’09 seasons, and week 16 of the ’05 and ’09 seasons, when Manning left early. Why did I pick the last ten years? I don’t … Continue reading  In the ’04 season, Manning threw at least 20 touchdowns in each of his trailing six game stretches from week 7 all the way through week 15, with a peak of 27 touchdowns in his prior six games in weeks 11 and 12.  Manning also threw 19 touchdowns in his last two full regular season games of 2010 and his first four games of 2011.  White-hot streaks happen, even to the best players, so we shouldn’t just assume that he’s now a 3.67 touchdown per game player.

On the other hand, it would be naive to assume that we should ignore the first six weeks of the season and continue to project Manning as a 2.38 touchdown per game player for the rest of the year.  The question becomes, how much do we base projection over the final 10 games on his preseason projection and how much do we base it on his 2013 results? In Part I, after four games, a regression model produced a projection of 2.56 touchdowns per game the rest of the year. But the problem with a regression analysis is that Manning is an extreme outlier among NFL quarterbacks; to project Manning, it would be best if we could limit ourselves to just quarterbacks named Manning Peyton Manning.

Before continuing, I want to give a special thanks to Danny Tuccitto, without whom this article wouldn’t be possible. Danny provided this great link and also spent a lot of time walking me through the process. To the extent I’ve mucked it up here, you should blame the student, not the teacher. But after walking through some models online, I realized that the best explanation about how to use Bayes Theorem for these purposes was on a sweet site called FootballPerspective.com. And the smartest person on that website had already laid out the blueprint.

In the comments to one of his great posts, Neil explained that we can calculate Manning’s odds using Bayes Theorem if we know four things:

His Bayesian prior mean (i.e., his historical average):

His Bayesian prior variance (the variance surrounding his historical average):

His observed mean:

His observed variance:

Let’s go through each of these:

1) Manning’s Bayesian prior mean: this is simply what we expected out of Manning before the season. I will use 2.38, since Footballguys is the gold standard of football projections in my admittedly biased opinion. But you can use any number you like, as I’ll provide the full formula at the end.
[continue reading…]

References

References
1 That was after removing week 17 of the ’04, ’05, ’07, ’08, and ’09 seasons, and week 16 of the ’05 and ’09 seasons, when Manning left early. Why did I pick the last ten years? I don’t know, but he won his first MVP in ’03, so that seemed like a useful starting point.
{ 9 comments }

A classic shootout

A classic shootout.

Peyton Manning and Tony Romo staged a classic yesterday afternoon in Dalllas. The Broncos won 51-48, and the two quarterbacks put up ridiculous stat lines. Manning went 33 of 42 for 414 yards, and threw four touchdowns and just one interception. He wasn’t sacked, giving him an impressive 10.69 ANY/A average (based on the formula “Passing Yards + 20 * TDs – 45 * INTs – Sack Yards lost” divided by “Sacks + Attempts”). Romo may have been better, completing 25 of 36 passes for 505 yards and 5 scores — along with one fateful interception, and four sacks for -36 yards. That’s an amazing 13.12 ANY/A average.

So far this year, the league average ANY/A is 6.00. Since Manning was at 10.69 over 42 dropbacks, we could say that he provided 197 adjusted net yards of value over average. Meanwhile, Romo produced 285 adjusted net yards of value (40 * 7.12), which means the two quarterbacks combined to produce over 481 yards of value over average. If the league average for the season remains at 6.00, that would make this the fourth best (era-adjusted) quarterback battle since the merger, although only the second best game involving Manning. The table below shows the top 100 quarterback performances in the same game from 1970 to 2012.

Here’s how to read the table: for the top game: In 1972, Joe Namath and Johnny Unitas played a classic. The fourth column provides the team names (listed as QB 1 vs. QB 2) and a hyperlink link to the actual boxscore. The fifth column shows the quarterback stats: Namath completed 15 of 28 passes for 496 yards, 6 touchdowns, and 1 interception, and had 1 sack for -6 yards; Unitas completed 26 of 45 for 376 yards, threw 2 touchdowns and no interceptions, and was sacked 6 times for -44 yards. Namath produced 441 adjusted net yards of value (using the formula from above), while Unitas produced 154 yards, giving the duo a total of 595 yards above average.
[continue reading…]

{ 33 comments }

It's been a magical month for the Broncos passing game

It's been a magical month for the Broncos passing game.

Sometimes, the simplest questions have the most complicated answers. Peyton Manning has thrown 16 touchdowns so far this season, putting him on pace for 64 touchdowns this year. Now, we can be reasonably sure that Manning’s true ability level — even with Wes Welker, Demaryius Thomas, Eric Decker, and Julius Thomas — isn’t four touchdowns per game. But he doesn’t need to keep up that pace to break Tom Brady’s single-season record of 50 touchdown passes: Manning “only” needs to averaged 2.92 touchdowns per game over the final 12 games. But to figure out his odds of averaging nearly three touchdowns per game, we need to figure out his true ability level. So how do we determine that number?

Even for a man who averages four touchdown throws per game over four games, averaging nearly three touchdowns per game going forward is still a tall order. Footballguys.com projected Manning to averaged 2.38 touchdowns per game this year. In 2012, he threw 37 touchdowns, an average of 2.31 touchdowns per game. From 2003 to 2012, excluding games [1]That was after removing week 17 of the ’04, ’05, ’07, ’08, and ’09 seasons, and week 16 of the ’05 and ’09 seasons, when Manning left early. Why did I pick the last ten years? I don’t … Continue reading he exited early, Manning averaged 2.17 touchdown passes per game. As a Colt, Manning averaged 1.92 touchdowns per game.

It doesn’t take any advanced math skills to figure out that Manning is likely to average somewhere between 2 and 4 touchdowns per game over the rest of the season. But that doesn’t help us very much: we need to be precise, since the threshold he needs to hit is 2.92 touchdowns per game. I’ll get to the more complicated math in Part II. For now, let’s look at some history.
[continue reading…]

References

References
1 That was after removing week 17 of the ’04, ’05, ’07, ’08, and ’09 seasons, and week 16 of the ’05 and ’09 seasons, when Manning left early. Why did I pick the last ten years? I don’t know, but he won his first MVP in ’03, so that seemed like a useful starting point.
{ 4 comments }

Quarterback Alumni

Yep.

Yep.

In week four, Tom Brady, Matt Cassel, and Brian Hoyer started at quarterback, and all three exited Sunday with a victory.  Cassel and Hoyer are former Patriots quarterbacks, which got me to thinking about quarterback alumni. It isn’t that unusual for there to be three starting quarterbacks who all have ties to one team: over the past few years, Matt Ryan has been joined by former Falcons Matt Schaub and Michael Vick as starting quarterbacks in many weeks.  And at various times over the past few seasons (and in week five), Bengals fans have seen Andy Dalton, Carson Palmer, and Ryan Fitzpatrick as starters.

Which made me wonder: what is the record for most starting quarterbacks in a single week who all once played for the same franchise? As it turns out, the answer is six. In week 6 of the 2007 season, the following men who once donned a Dolphins jersey started at quarterback: Brian Griese in Chicago, Damon Huard for the Chiefs, Gus Frerotte for the Rams, Daunte Culpepper for the Raiders, Joey Harrington for the Falcons, and yes, Cleo Lemon for the Dolphins. Think about that: of the thirteen games played that week, nearly half involved a starting quarterback who had previously played for the Dolphins! The group went 1-5, with Huard’s Chiefs providing the sole win.

In the first two weeks of the ’02 season, six different quarterbacks with Washington ties were starters: Shane Matthews in Washington, Frerotte in Cincinnati, Trent Green in Kansas City, Rodney Peete in Carolina, Rich Gannon in Oakland, and Brad Johnson in Tampa Bay.

In the last few years, the closest any team has come to matching that record was in week 8 of the 2011 season, when A.J. Feeley (St. Louis), Drew Brees, Philip Rivers, and Charlie Whitehurst (Seattle) — all men who had worn Chargers jerseys — were starters. That week, Feeley’s Rams pulled off one of the biggest upsets in recent history, defeating Brees’ Saints. Don’t feel bad if you don’t recall Feeley’s days with San Diego: Nick Saban traded him in the middle of the ’05 season, but Feeley simply sat on the bench behind Brees and Rivers.

{ 0 comments }

Finding Comparables For Mike Glennon

Not opposed to occasional acts of piracy

Not opposed to occasional acts of piracy.

It’s official in Tampa Bay: Josh Freeman is out and Mike Glennon is in at starting quarterback. But what are the odds that Glennon actually plays well this year? I’m not very optimistic for a couple of reasons.

Vincent Jackson is a star, but he’s dealing with injuries to his ribs. On 30 passes aimed at Jackson this year, Freeman has picked up 265 yards, an average of 8.83 yards per attempt. On 23 targets to Mike Williams, Freeman has averaged 5.5 yards per pass. On his other 38 targets, Freeman’s averaged just 4.7 yards per pass. Right now, there simply aren’t enough weapons in Tampa Bay, as the Bucs desperately could use a receiving tight end and a slot receiver.

But here’s another reason not to expect much from Glennon. Since 1978, there are 30 rookie quarterbacks who are “similar” to Glennon in that they met the following three criteria:

  • Were not first round picks
  • Did not start in week 1 (i.e., they didn’t pull a Russell Wilson and win the job with a great training camp — they generally became the starter because the man in front of them was ineffective); and
  • Started at least four games as a rookie.

[continue reading…]

{ 8 comments }

Straight cash, homey.

Straight cash, homey.

In 1998, 21-year-old Randy Moss made a stunning NFL debut, racking up 17 touchdowns and 1,260 True Receiving Yards, the 2nd-best total in football that season. The Vikings’ primary quarterback that year, Randall Cunningham, was a former Pro Bowler and MVP, but all that seemed like a lifetime ago before the ’98 season. He’d been out of football entirely in 1996, and in 1997 he posted an Adjusted Net Yards per Attempt average that was 1.2 points below the league’s average (for reference’s sake, replacement level is usually around 0.75 below average). With Moss in ’98, though, Cunningham’s passing efficiency numbers exploded: he posted a career best +3.2 Relative Adjusted Net Yards per Attempt, miles ahead of his perfectly-average overall career mark. If we adjust for the fact that Cunningham was also 35 at the time (an age at which quarterbacks’ RANY/A rates tend to be 1.1 points below what they are at age 27), Cunningham’s 1998 rate was actually 4.3 points better than we’d expect from the rest of his career, a staggering outlier.

The following year, Jeff George took over as the Vikings primary quarterback, and he promptly posted a Relative ANY/A 2.2 points higher than expected based on his age and the rest of his career. [1]Cunningham’s RANY/A was also 1.0 better than expected in limited action. George left Moss and Minnesota after the season, and he would throw only 236 passes the rest of his career, producing a cumulative -0.6 RANY/A in Washington before retiring.

From 2000-04, Moss was the primary target of Daunte Culpepper, whose RANY/A was 0.7 better than expected (based on Culpepper’s career numbers) when Moss was around. [2]That number is an average weighted by the number of TRY Moss had in each season Although he’d enjoyed one of the best quarterback seasons in NFL history in 2004, Culpepper was never the same after Moss was traded to Oakland; in fact, he never even had another league-average passing season, producing a horrible -1.2 RANY/A from 2005 until his retirement in 2009. [3]To be fair, Culpepper tore his ACL, MCL, and PCL halfway through the 2005 season, which also was a factor in his decline.

Moss’s stint with the Raiders was famously checkered — although Kerry Collins’ RANY/A was 0.6 better than expected in 2005, Aaron Brooks played 2.5 points of RANY/A below his previous standards in 2006 — but we all know what happened when he joined the Patriots in 2007. With Moss, Tom Brady’s RANY/A was a whopping 1.3 points higher than expected from the rest of his career, and Moss also played a big role in Matt Cassel’s RANY/A being +1.0 relative to expectations after Brady was lost for the season in 2008.

While Moss’s post-Pats career hasn’t exactly been the stuff of legends, the majority of his career (weighted by True Receiving Yards) saw him dramatically improve his quarterbacks’ play relative to the rest of their careers. In fact, his lifetime WOWY (With or Without You) mark of +1.1 age-adjusted RANY/A ranks 3rd among all receivers who: a) had at least 3,000 career TRY, b) started their careers after the merger, and c) played exclusively with quarterbacks who started their careers after the merger. And the first two names on the list are possibly explained by other means. The table below lists all 301 receivers with 3,000 career TRY. The table is fully sortable and searchable, and you can click on the arrows at the bottom of the table to scroll. The table is sorted by the QB WOWY column.
[continue reading…]

References

References
1 Cunningham’s RANY/A was also 1.0 better than expected in limited action.
2 That number is an average weighted by the number of TRY Moss had in each season
3 To be fair, Culpepper tore his ACL, MCL, and PCL halfway through the 2005 season, which also was a factor in his decline.
{ 7 comments }
Picture1

The consensus view on John Elway is clear. He was the greatest draft prospect ever, a league MVP, a two-time Super Bowl champion, a Hall of Famer, and one of the most clutch quarterbacks in football history.

But that’s not necessarily what the numbers say. In my quarterback ranking system, which rewards efficiency and longevity and adjusts for era, Elway only ranked as the 26th best regular-season quarterback of all time. If you’re so inclined, it’s not hard to find the numbers to argue that Elway – at least until Mike Shanahan returned to Denver as head coach in 1995 — was overrated. Consider:

  • Over the first 10 years of his career, Elway threw 158 touchdowns and 157 interceptions.
  • Elway never led the NFL in passer rating, completion percentage, touchdowns, yards per attempt, or Adjusted Net Yards per Attempt. Elway didn’t finish in the top ten in passer rating until his eleventh season in the league. In Net Yards per Attempt, Elway ranked in the top 10 just once from 1983 to 1994 (a first-place finish in ’87); in ANY/A, Elway’s only top ten finishes during his first ten seasons were in ’86 (10th) and ’87 (4th).
  • Elway ranks fourth all-time in passing yards, but that’s because he ranks fourth in career pass attempts. While he led the NFL in passing yards in 1993, Elway only finished in the top five in passing yards four times in his career: 1985 (2nd), 1987 (4th), 1990 (5th), and 1995 (5th).
  • Elway ranked 2nd in passing touchdowns in 1993, the only time he finished in the top 5 in that metric from 1983 to 1995. Despite throwing the fourth most pass attempts in NFL history, he ranks only 7th in passing touchdowns. In eight of sixteen seasons, including seven of his first ten years, Elway produced a below-average touchdown rate.

Here’s another interesting stat: from 1983 to 1992, the Broncos were slightly better on defense than offense. Over that time period, Denver’s Offensive SRS average was +1.01 while their Defensive SRS was +1.32. On average, the Broncos ranked 12th in points scored and 11th in points allowed. Those Denver teams are remembered as Elway’s teams — and perhaps rightly so — but the defense was just as valuable as the offense. [1]On the other hand, it’s worth pointing out that the ’83-’92 Broncos won more games than their Pythagorean record would have predicted, so perhaps Elway was responsible for more wins … Continue reading
[continue reading…]

References

References
1 On the other hand, it’s worth pointing out that the ’83-’92 Broncos won more games than their Pythagorean record would have predicted, so perhaps Elway was responsible for more wins than his passing numbers would indicate.
{ 99 comments }

Roethlisberger will be without his best targets this year.

Roethlisberger will be without his best targets this year.

While the state of the Steelers’ receiving corps isn’t as shaky as say, that of the New England Patriots, it could certainly be called an area of potential concern for Ben Roethlisberger and the Pittsburgh offense going into 2013. One of the biggest moves on the first day of free agency involved Mike Wallace departing for Miami; meanwhile, Heath Miller’s injury status — while more encouraging than previously thought — will cost him several games, and probably some effectiveness when he does eventually return. All of this comes on the heels of losing stealth HoFer Hines Ward (albeit an older, drastically less effective version) to retirement after the 2011 season.

For Roethlisberger, this downturn in the quality of his receivers is a pretty new phenomenon. In fact, by one measure of career receiving-corps talent (which I’ll explain below), Big Ben has been blessed with the fourth-most gifted receiving group among current starting quarterbacks with more than two years of experience (behind only Peyton Manning, Matt Ryan, and Tony Romo). In fact, Roethlisberger’s 16th-ranked receiving corps in 2012 was by far the least talented group of pass catchers he’s ever had to throw to.

How do you begin to measure the quality of a quarterback’s receiving corps, you ask? Well, pretty much any method is going to fraught with circular logic, especially if a quarterback consistently has the same receivers over several years. His successes are theirs, and vice-versa. However, here’s one stab at shedding at least some light on the issue.

For each team since the NFL-AFL merger, I:

  • Gathered all players with at least 1 catch for the team in the season.
  • Computed their True Receiving Yards in that season; I then determined what percentage of the team’s True Receiving Yards was accumulated by which receiver in each year. For example, Hines Ward had 1,029 TRY in 2009, which represented 25.9% of the 3,979 True Receiving Yards accumulated by all Steelers that year
  • Figured out the most TRY they ever had in a season, a number I’m calling each player’s peak TRY; for Ward, his peak TRY is equal to 1,279.
  • Calculated a weighted average (based on the percentage of team TRY gained by each receiver) of the receivers’ peak TRY (weighted by their TRY during the season in question).

(I also threw out all teams that had a receiver who debuted before 1970, since I don’t know what the real peak TRY of any pre-merger receiver was. I should eventually calculate TRY for pre-merger seasons, of course — thank you Chase & Don Maynard.)

As an example, here are the 2009 Steelers, the most talented corps of receivers Roethlisberger has had in his career:
[continue reading…]

{ 4 comments }
Next Posts Previous Posts