≡ Menu

Wisdom of Crowds: Wide Receiver Edition

Adam Steele is back with a long-awaited wide receiver edition of his beloved Wisdom of Crowds exercise. We thank him for the beautiful discussion it will prompt.


It’s been a few years since FP has run a Wisdom of the Crowds exercise, and this time around we’re going to do wide receivers.

For anyone wanting to submit a ballot, there are a handful of simple rules:

  1. You have 200 points to distribute among your choices for the greatest wide receivers of all time. The criteria for greatness is entirely up to you, and explanations in the comments are encouraged. You can use half points (but nothing smaller than that).
  2. No WR may be assigned more than 15 points. This is done to prevent a few over-weighted ballots from skewing the results.
  3. The maximum number of WR’s you may list is 50, but it’s okay to list fewer than that as long as the points sum to 200.
  4. Players whose career began before 1935 are not eligible because the earliest days of the NFL were too different from the modern game to make fair comparisons.
  5. Please compose and submit your ballot before reading anyone else’s.
  6. Ballots will be accepted for two weeks after the day this is posted.
{ 0 comments }

Over at FiveThirtyEight, Josh Hermsmeyer recently wrote about wide receivers and 40-yard dash times. Using yards per route run as his measure of productivity, Josh concluded “that higher speed isn’t associated with higher on-field production.” Today I want to take a deep dive into the question of how much 40-yard dash times are correlated with wide receiver success. For a very long time, people have argued that 40-yard dash times are overrated (actually, for a very long time, people have argued that just about everything is overrated). But such a comment is paper thin, because it’s unclear exactly how “rated” 40-yard dash times are, anyway. So let’s skip the overrated/underrated analysis and dive into the data.

My sample comprises the 853 wide receivers who ran the 40-yard dash at the NFL combine from 2000 to 2017. [1]Why those years? PFR’s data only goes back to 2000, and players who participated at the combine more recently than 2017 have not yet accrued four NFL seasons. All data is publicly available from PFR, via Stathead Football. I then looked at how many receiving yards those players gained in their first four seasons in the NFL. [2]Chosen because this represents the average length of a rookie contract. The question of what metric to use to measure production is a complicated one: receiving yards is not perfect (and I will revisit this decision at the end of the article), but it should work well enough for these purposes.

On average, these 853 players ran the 40-yard dash in 4.51 seconds and gained a total of 678 receiving yards in their first four seasons; this includes the 360 of them who never gained a receiving yard in the NFL. The top three wide receivers by receiving yards over this period [3]This analysis, of course, excludes players who were not invited to the combine like Tyreek Hill and Josh Gordon, undrafted players like Victor Cruz, Robby Anderson, and Doug Baldwin, and players who … Continue reading were Michael Thomas, A.J. Green, and Anquan Boldin, who ran the 40-yard dash in 4.57, 4.48, and 4.72 seconds, respectively. Strike one for 40-yard dash times mattering. The fastest two players were John Ross and Donte’ Stallworth, who both ran the 40 in 4.22 seconds. [4]That might sound like strike two, but Stallworth was tied for the 61st most receiving yards out of this group if 853 receivers. It’s a strike for 40-yard dash time being the only thing that … Continue reading

But anecdotes can only take us so far when we have 853 players, from Ross and Stallworth on the far left, to Thomas up at the top, all the way to Mississippi State’s De’Runnya Wilson, who never played in the NFL and ran the 40 in 4.85 seconds. [continue reading…]

References

References
1 Why those years? PFR’s data only goes back to 2000, and players who participated at the combine more recently than 2017 have not yet accrued four NFL seasons.
2 Chosen because this represents the average length of a rookie contract.
3 This analysis, of course, excludes players who were not invited to the combine like Tyreek Hill and Josh Gordon, undrafted players like Victor Cruz, Robby Anderson, and Doug Baldwin, and players who skipped the combine like Corey Davis.
4 That might sound like strike two, but Stallworth was tied for the 61st most receiving yards out of this group if 853 receivers. It’s a strike for 40-yard dash time being the only thing that matters, but not for 40-yard dash time having any value.
{ 16 comments }

On Monday, I looked at which receivers were the most productive on a per-team pass attempt basis. This is one good way to measure wide receiver production, but it is far from perfect.

Players on teams with bad quarterbacks will be harmed, as are players who are “competing” with really good receivers on their offense will be boosted. The two guys I’m really thinking of are Terry McLaurin (who ranked 23rd in ACY/TPA on Monday) and Allen Robinson (19th), two wide receivers we know are very good but had very poor quarterback play. [1]An interesting scenario is in Carolina, where the quarterback play was below average but D.J. Moore and Robby Anderson had to compete with each other.

So today I want to look at which receivers gained the largest share of their team’s receiving pie, measured simply as receiving yards in the games they played. Davante Adams led all players in percentage of team receiving yards, at 37.2%, and he did it while playing for the best passing offense in football. It is extremely rare for a wide receiver to both play for an incredible passing offense and have an insanely large share of the pie: it is one reason why Adams had one of the great seasons in receiving history in 2020.

Beyond Adams, who were the most impressive receivers in 2020? There might be some trade-off between being on a great offense and being on a bad one; all things being equal, it’s easier for Robinson or McLaurin to gobble up targets than say, someone in Tampa Bay or Kansas City’s offense. One way I like to measure receivers is to look at both the quality of the pie — i.e., how good was their passing game — and how big of a slice each receiver gobbled up. Getting a good-size pie on a great passing offense, a large chunk of a good passing game, and a huge chunk of a bad passing game are all about equally impressive if you think that players “compete” with their teammates for targets.

In the graph below, I’ve shown the percentage of the team receiving yards each receiver had in 2020 (limited only to the games they played) on the X-Axis, and their team’s passing efficiency (as measured by ANY/A) on the Y-Axis. I’ve also labeled some notable players who stood out. [continue reading…]

References

References
1 An interesting scenario is in Carolina, where the quarterback play was below average but D.J. Moore and Robby Anderson had to compete with each other.
{ 0 comments }

Top Receivers in 2020 Per Team Pass Attempt

Nobody could stop Adams in 2020.

Davante Adams was the best wide receiver in the NFL in 2020, and by a very large margin. Unless you want to assign a heavy penalty on him for playing with the MVP quarterback, Adams had otherworldly numbers. He played in just 14 games, but still gained 1,374 yards, 73 first downs, and caught 18 touchdowns. This came in just 461 pass attempts during those 14 games, making that even more impressive.

When measuring receiver performance, it’s important to recognize that some wide receivers play on pass-heavy teams while some play on run-heavy teams. Targets are often mistakenly viewed as a measure of opportunity, when really targets are a form of production; a player who gets a target on a play is doing something positive. The best measure of opportunity is routes run, and team pass attempts serves as a good proxy for that.

Let’s skip Adams, who again blows away the field. Let’s instead look at Titans wide receiver A.J. Brown, who is often the lead horse for the great efficiency numbers that Ryan Tannehill has produced since joining the Titans. Brown missed two games this year, but in those 14 games, he gained 1,075 receiving yards, 55 first downs and 11 touchdowns. Most impressively, this came with only 424 pass attempts (excluding sacks) in those games. Brown picked up a first down on 13% of all Titans pass attempts in the games he played, the fourth-best mark in the NFL; he caught a touchdown on 2.6% of all Tennessee pass plays during those 14 games, the third-highest mark in the league. A receiver can only produce on passing plays, and Brown was a huge reason for the Titans success last year.

For each receiver last year, I calculated how many Adjusted Catch Yards they gained, which is simply receiving yards with a 9-yard bonus for each first down and a 20-yard bonus for each touchdown. [1]Without duplication, so a touchdown only gets 11 additional yards, since each touchdown is always a first down. For Brown, that means he gained 1691 adjusted catch yards; in the 14 games he played, he averaged 3.99 ACY per team pass attempt, the second-best rate in the NFL. Here are the top 100 receivers by this metric: [continue reading…]

References

References
1 Without duplication, so a touchdown only gets 11 additional yards, since each touchdown is always a first down.
{ 0 comments }

History of the Career Receiving Touchdowns Record

Wide Receiver Jerry RiceI’ve written several histories of NFL career records, but the history of the career receiving touchdowns record is the most fascinating to me. Twelve men held the receptions title, and eleven held the receiving yards record. Seven different players held the record for rushing yards and for rushing touchdowns. Eleven quarterbacks held the passing yardage crown, while ten captured the touchdown title. This record is different. Thanks, primarily, to Don Hutson and Jerry Rice, only four players have held the record for receiving touchdowns since the NFL started keeping official statistics in 1932.

Receivers to Hold the Career Receiving Touchdowns Record

Johnny Blood (7 years as record-holder)

By the end of 1932, the first season in the official NFL record book, Blood had scored 25 receiving touchdowns. Most of those occurred in the “pre-stat” era, with 22 of his scores coming between 1926 and 1931. That includes a career high (by far) eleven touchdowns in 1931—he never had another season with more than five touchdowns. He played until 1938, slowly racking up touchdowns and retiring with 37 through the air.

Don Hutson (49 years, 3 months as record-holder)

Huston finished the 1939 season with 36 receiving touchdowns, just one shy of Blood’s record. To begin 1940, he tied the record in the third quarter of a blowout loss to the Bears, and he broke it in the opening quarter of a blowout win over the Cardinals. He got a fortunate break when WW2 took much of the talent from the NFL; during the war-depleted years, Hutson had by far his most productive touchdown seasons (1941-43 were his only three season with double-digit receiving scores). He ended his career with 99 receiving touchdowns, a number that wasn’t approached for decades.

Steve Largent (3 years as record-holder)

Largent was two touchdowns shy of the record coming into the 1989 season. Things looked dim for the receiver, who scored in week one but followed with ten straight weeks in which he failed to find the end zone. However, he was able to tie the record in game twelve and subsequently break it in week 14. The last touchdown of his storied Hall of Fame career was the one that gave him sole possession of the record. He didn’t hold the record for long, because the most prolific player of all time was already on his heels.

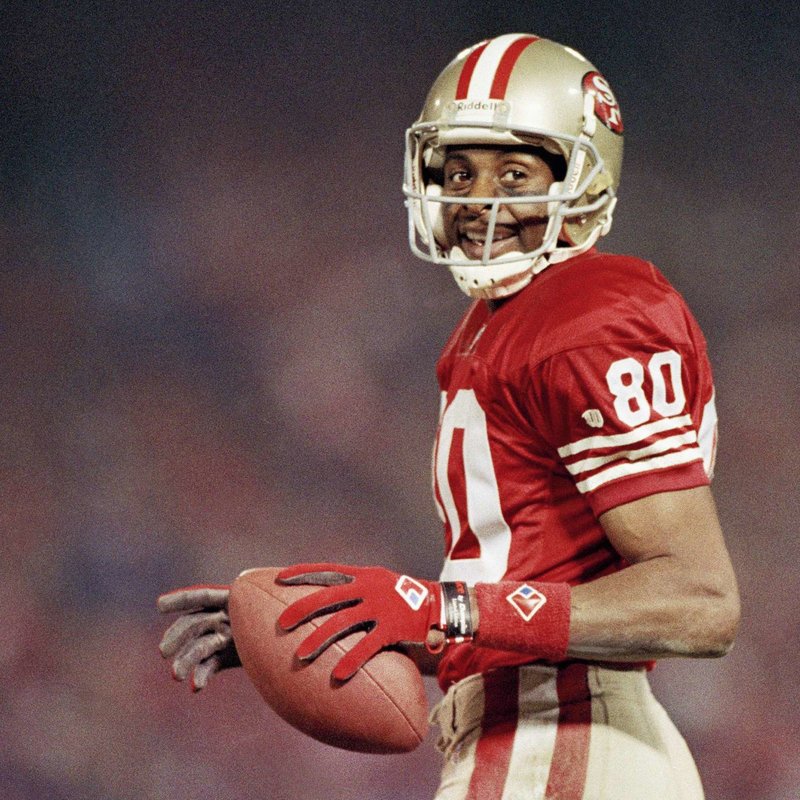
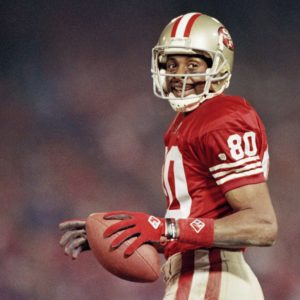
Jerry Rice (27 years, 10 months as record-holder, so far)

Through seven seasons (1985-91), Rice had already compiled 93 receiving touchdowns. [1]He did this despite a slow start, hauling in just three touchdown passes as a rookie. Rice then scored 15, 22, 9, 17, 13, and 14 receiving touchdowns, averaging a touchdown per game over that span. In week 12 of 1992, Rice tied Largent’s record in a victory over the Eagles. The following week, in a dominant win over the Dolphins, World gained sole possession of the record, becoming the first player in history to top the century mark. He added an incredible 96 touchdowns after that, walking away with 197 and a distant lead over anyone before or since. [2]The second and third place receivers, Randy Moss and Terrell Owens, were incredibly productive for several years. Moss finished with 156, and Owens finished with 153. The two of them have a sizable … Continue reading

Future of the Career Receiving Touchdowns Record

This record seems like it’s going to last for a pretty long time. As of today, the top ten active leaders in touchdowns are:

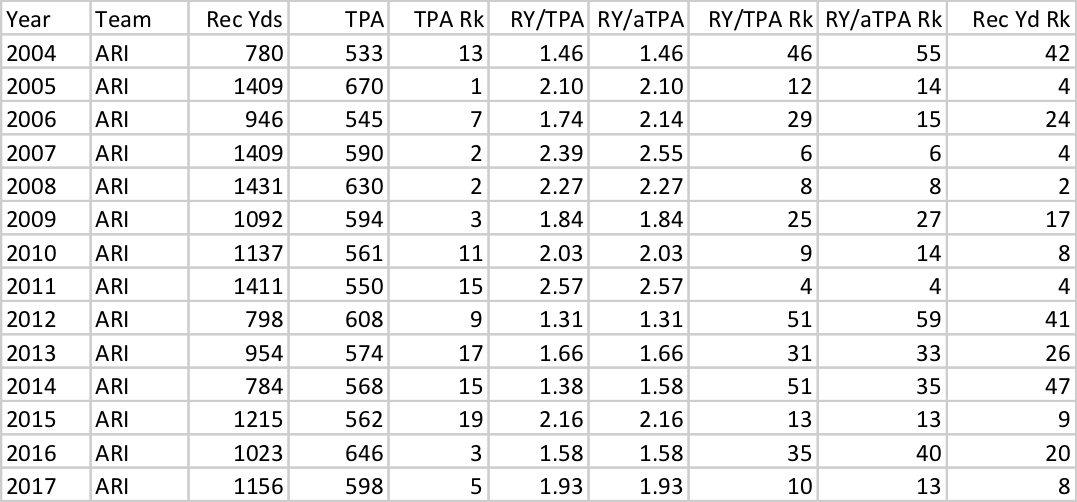
Larry Fitzgerald – 120
Rob Gronkowski – 79
Jimmy Graham – 75
Antonio Brown – 75
Jason Witten – 72
A.J. Green – 63
Demaryius Thomas – 63
Greg Olsen – 60
Julio Jones – 57
DeSean Jackson – 55
DeAndre Hopkins – 55

Fitzgerald is 37 and is still 77 touchdowns short of the record. Gronk needs 118 to tie, which would more than double his career output to date. Given his injury history, it’s a little outlandish to expect him to come anywhere close. Graham is 122 shy and is just not very good anymore, and he hasn’t been for some time now. Brown is also 122 away, and he is both 32 years old and out of the league for being a total head case.

Witten has looked and played like an old man since he entered the league. Green looks like he aged a decade overnight. Thomas can’t find a team, and Olsen looks his age. Jones famously doesn’t score touchdowns, while Jackson is 33 and not the threat he once was.

Looking for younger players on the right track, I don’t see anyone. But let’s discuss a few anyway. How about DeAndre Hopkins, Mike Evans, Odell Beckham Jr., Davante Adams, and Travis Kelce.

Hopkins is 28 and has 55 touchdowns. His career high was 13 in 2017. For reference, Rice had eight seasons with at least that many touchdowns (and six with more). He’d have to replicate his best season eleven times to own the record!

Evans is just 27, and he has 50 scores. He has also only had two seasons in which he played the full 16 games. With 9 touchdowns per 16 games over his career, he’d have to reproduce his career average—without missing a game—for over 15 more years. Or average 14.7 touchdowns a year over the next decade.

Beckham started his career on fire, scoring 35 touchdowns in his first three seasons. He’s one of just six players in history to accomplish that. But from 2017 to present, he has played in just 34 games and scored a mere 14 touchdowns. That means after his tremendous start he is now 148 touchdowns short of the record with no signs of reclaiming past glory.

Adams is 28 and has 46 touchdowns. Most of that came from 2016-28, during which time he scored 35 times. He had a down year in 2019, scoring just five touchdowns. That might not seem like an issue, but things have to go perfectly to take the crown from the king. Rice started slow with three touchdowns, but after that, he didn’t have a season as low as five until he was 35 years old and played in just two games. During his “peakiest” peak, from ages 24-33, his touchdown output looked like something from a video game: 15, 22, 9 (his down year), 17, 13, 14, 10, 15, 13, and 15.

Kelce will be 31 in a few weeks. He’s a scoring machine for a tight end, but with 38 touchdowns he is still 159 shy of Rice. If he was guaranteed to match his career high every year until he broke the record, he’d have to play until he was 47.

Maybe Reek Hill is a sleeper. He is a big play threat and a favorite target of a guy who throws a lot of touchdown passes. I don’t think he stands a chance. At 26, he’s already older than he seems. And he has just 33 touchdowns. Rice had 49 by that age and added 97 over the following seven seasons. Then he threw in another 51 just for funsies.

What I’m saying is this: I don’t believe any active player will break Rice’s record, even with expanded schedules.

References

References
1 He did this despite a slow start, hauling in just three touchdown passes as a rookie. Rice then scored 15, 22, 9, 17, 13, and 14 receiving touchdowns, averaging a touchdown per game over that span.
2 The second and third place receivers, Randy Moss and Terrell Owens, were incredibly productive for several years. Moss finished with 156, and Owens finished with 153. The two of them have a sizable lead over fourth place Cris Carter (130), but neither is within 40 of Rice.
{ 0 comments }

Update: Top Receiving Seasons By Age

Five years ago, I noted the age when receivers produced their best season in terms of receiving yards. Today, I am going to revisit that study.

Irving Fryar is the biggest outlier in NFL history in this regard. He was a top college star and a prized NFL prospect who wound up going first overall in the USFL-depleted 1984 NFL Draft. He spent his 20s on some inconsistent Patriots teams, and then in 1991, at the age of 29, he had his first 1,000-yard season while playing with a below-average quartebrack in Hugh Millen. Fryar then went to Miami, and while playing with Dan Marino, had a career-season at age 31 in 1994. Eventually, Fryar landed in Philadelphia during the lean, pre-Reid/McNabb years. And yet in 1997, at the age of 35, while playing with journeymen Ty Detmer and Bobby Hoying in a Jon Gruden offense, Fryar had the first 1,300-yard season of his career.  In fact, it remains the lone season of 1,300+ yards by a player 35 years or older… which is pretty remarkable given the quarterback presence.

There are 141 players in NFL history who have reached 7,000 career receiving yards.  Fryar is the only one to have his best season (measured by receiving yards) at the age of 35; only four other players — Pete Retzlaff, Charlie Joiner, Bobby Engram, and Joey Galloway — had their best season at age 34.

The graph below shows the age where each of the 141 players with 7,000 career receiving yards had their best season. [continue reading…]

{ 0 comments }

Let’s get it out of the way: playing with Tom Brady and Peyton Manning sure helps. From 2007 to 2013, Wes Welker had the best seven year stretch of his career, and most of that time came with Brady as his quarterback (there was one season with Matt Cassel and the 2013 record-breaking season with Manning). During those seven seasons, Welker’s teams averaged a remarkable 32.3 points per game. In 2014, Welker’s team — still the Broncos — also topped 30 points per game, but the other seasons of Welker’s career were spent on significantly less productive offenses.

Of course, in most of those other seasons, Welker himself wasn’t a significant part of the offense: he was a young backup or a past-his-prime player. I wanted to calculate how many points per game each wide receiver’s offense scored over his career. This is trickier than you’d think: what do you do for years where a player was a backup, or missed time due to injury? For Welker, he played 14 games with the 2004 Dolphins but as a returner and did not catch a pass. Would that team count in his career average?

To solve for these problems, I weighted each season by the percentage of career receiving yards he gained in that season.  Welker gained 9,924 receiving yards in his career.  In 2015 with the Rams, he gained 102 yards, or 1.0% of his career total.  That isn’t much, so the Rams production that year — 17.5 points per game, or 5.31 PPG below average — counts for 1.0% of Welker’s career score.  The 2013 Broncos averaged 37.88 PPG, 14.47 better per game than league average; since Welker gained 7.8% of his career yards that season, the 2013 Broncos stats count for 7.8% of his career total.  Welker’s best year was 2011, when he gained 1,569 yards.  That represented 15.8% of his career total, so the 2011 Patriots — 32.06 points per game, 9.88 points per game above league average — counts for 15.8% of Welker’s career grade.

If you perform this analysis for every season of Welker’s career, his team’s averaged 30.13 points per game once you weight for Welker’s production, which was 8.11 points per game above average. Here’s the math: the final two columns represent the product of multiplying his percentage of career receiving yards in that season by his team’s scoring (both raw and relative to league average): [continue reading…]

{ 0 comments }

A few months ago, I calculated the concentration index for each passing offense in the NFL.  For new readers, don’t be scared: a passing offense’s Concentration Index is simple to calculate, and it measures how concentrated a team’s passing offense is among a small or large number of players.  To calculate, you take each player’s receiving yards and divide that by his team’s total receiving yards.  Once you get that number, you square it, and then do that for each player on the offense and add the totals.  The most concentrated passing offense in 2019 was in New Orleans. For the Saints, Michael Thomas gained 38.9%; the square of that is 15.2%.  Jared Cook was second on the team with 705 yards, or 15.9% of the team’s receiving yards; the square of that number is 2.5%.  Do this for every player, and the Saints have a total Concentration Index of 21.1%… which is highly concentrated, at least by 2019 standards.  Here is the full table: [continue reading…]

{ 0 comments }

The 2000 NFL Draft was the most wide receiver-heavy draft in NFL history. Peter Warrick, Plaxico Burress, and Travis Taylor went in the top 10 picks, Sylvester Morris and R. Jay Soward also went in the first round, and another eleven (11!) wide receivers went in the first 100 picks after that: Dennis Northcutt, Todd Pinkston, Jerry Porter, Ron Dugans, Dez White, Chris Cole, Ron Dixon, Laveranues Coles, JaJuan Dawson, Darrell Jackson, and Gari Scott.

In case you can’t tell by those names, the draft was a complete dud. Expected to revolutionize the NFL with a new wave of athletic wide receivers, the entire class combined to make just 1 Pro Bowl at wide receiver — Coles in 2003 (Dante Hall, drafted in the fifth round, would make two Pro Bowls as a returner). Coles, Burress, and Jackson were all good players, but they were also the only three to eclipse even 5,000 receiving yards.

Twenty years later, we are looking at the next “greatest wide receiver class” of a generation. Oklahoma’s CeeDee Lamb and Alabama’s Jerry Jeudy will be early first round picks; they are expected to be joined in the first round by Jeudy’s teammate, Henry Ruggs III, Clemson’s Tee Higgins, and possibly  LSU’s Justin Jefferson, Arizona State’s Brandon Aiyuk, or Colorado’s Denzel Mims.

I looked at the CBS 7-round mock draft and calculated the Draft Value used on wide receivers. Why CBS? Because they were the first website I found that put together a clean table of all draft picks for all 7 rounds, making it easy to calculate draft value. Draft value is simply calculated as the value assigned to each pick, according to my draft value chart, that is used on a wide receiver.

Based on the CBS projections — which has WRs going at 12, 14, 15, 21, 30, 34, 37, 42, 50, 51, and 58 — this would be an outstanding draft class for wide receivers. And while none would be selected in the top 10, there would be a total of 201.6 points of draft capital spent on wide receivers. That would make this one of the top 10 drafts for wide receivers since the common draft era beginning in 1967.

The graph below shows the draft capital used on the position in each draft since 1967. [continue reading…]

{ 0 comments }

Gronk played on very good passing offenses.

Let’s talk about little bit about Kellen Winslow II. Winslow’s life has been marked more by what’s happened off the field than what happened on the field, starting with being the son of a Hall of Famer, continuing with an awful motorcycle accident early in his career, and ending with a conviction for rape and a CTE diagnosis. On the field, Winslow was productive but played during the peak of the tight end era: Tony Gonzalez, Antonio Gates, and Jason Witten were all still in their prime, Rob Gronkowski and Jimmy Graham were setting single-seaosn records, and guys like Vernon Davis and Dallas Clark were productive Pro Bowlers.

Winslow produced solid numbers, but he did so in the worst of circumstances. During this time, his quarterbacks were mostly Josh Freeman and Derek Anderson, along with a season of Charlie Frye, and a few games from Josh Johnson, Brady Quinn, and end-of-career Byron Leftwich. On average, Winslow’s offenses were 0.87 ANY/A below average during the course of his career, weighted by how productive Winslow was each season. Among tight ends with at least 5,000 career receiving yards, that is — by a large measure — the worst group of passing offenses. The second-worst would be Todd Heap: About a quarter of his career came with the early days of Joe Flacco, and another quarter was defined by the Kyle Boller era. He caught passes from end-of-career Steve McNair, Anthony Wright, Jeff Blake, Chris Redman, Elvis Grbac, and also Kevin Kolb and John Skelton in Arizona. On average, Heap’s offenses finished 0.45 ANY/A below average.

Only three other tight ends with 5,000+ career receiving yards played on teams that finished at least 0.20 ANY/A below average: Rich Caster (who had a little bit of prime Joe Namath and then little else), Delanie Walker, and Greg Olsen. If you want to lower the threshold for tight end production, we should all feel badly for Chargers TE Freddie Jones, who played with Ryan Leaf and a string of bad quarterbacks who were either bad, very young, or very old (or two of those three). For his career, Jones’s passing offenses finished 1.46 ANY/A below average. We can also pour one out for Boston Patriots TE Jim Whalen, who was one of the best tight ends of the late ’60s. In 1968, as the Patriots finished with the second-worst passing offense in the AFL — the passing offense was 2.88 ANY/A below average — Whalen somehow was a first-team AP All-Pro. Among all tight ends who have been named first-team All-Pro in a season, that is the worst accompanying passing offense in history. Whalen was a consummate Massachusetts man: he was born and raised in Cambridge, starred at Boston College, and then was drafted and spent the first five years of his career with the Patriots. That said, most of his career was played with bad or out of their prime quarterbacks.

On the other side, Brent Jones had a pretty sweet set-up: he played most of his career with Steve Young or Joe Montana, and his average offense had a Relative ANY/A of +2.00.  Second on the list would be Rob Gronkowski, who of course played with Tom Brady.  And if you lower the minimum threshold, nobody had it easier than Aaron Hernandez, who played his entire, short career during Brady’s prime.

I looked at the careers of over 100 tight ends and calculated how productive their average passing offense was. Regular readers may recall that I previously used a similar methodology to grade wide receivers. Let’s use Vernon Davis as an example.  He’s experienced it all, from the early struggles of Alex Smith to the efficient version, the dark days of Shaun Hill and Troy Smith, but also the good days of Colin Kaepernick and Kirk Cousins. [continue reading…]

{ 1 comment }

True Receiving Yards with Postseason

In a recent post, I revisited True Receiving Yards. That articles covers the nuts and bolts of the metric, so I’m not going to discuss that again today. Instead, I’m taking my favorite version of the metric, TRYSoft, and adding postseason performance for single seasons. You will recall that TRY includes adjustments for both a team’s pass frequency relative to its peers and a year’s pass frequency relative to other years. For the playoffs, I dropped the team adjustment but kept the yearly adjustment. I can see arguments for using both (or neither), but this is what I landed on, so strap in.

The table below contains receiving seasons with a combined regular and postseason TRY greater than 750. Read in thus: In 1945, Jim Benton caught 45 passes for 1067 yards and 8 touchdowns in the regular season. That’s good for 1227 adjusted catch yards and a TRYSoft of 2384. [1]Yea, that’s a pretty huge adjustment. In the postseason, he caught an additional 9 passes for 125 yards and a score, giving him a postseason ACY of 145, adjusted up to 171 after the year modifier. His combined production, which I have simply dubbed X, comes to 2555.

I don’t feel like getting into a ton of observations today. Besides, the remarks from the regular FP readers tend to be more interesting anyway. I’ll just say this: Jerry Rice was good at football.

References

References
1 Yea, that’s a pretty huge adjustment.
{ 0 comments }

True Receiving Yards Revisited

Way back in the simpler days of 2013, Chase introduced a Neil Paine creation called True Receiving Yards (TRY). It was a great look at receiving production [1]As measured by adjusted catch yards (ACY), which you’ll read about in less than a minute. in the context of both the team’s passing environment relative to the rest of the league and that year’s league’s passing environment relative to the average passing environment since 1970.

I wanted to revisit TRY, this time using my version of the metric (sorry Stuart-Paine loyalists). I will do so in a short series of brief posts. [2]Unless I fall prey to ennui and decide to stop without further explanation, which is a very real possibility. In today’s article, I plan to explain my methodology and present an abridged version of the results for single seasons.

Methodology

  1. The first step in finding TRY is finding each receiver’s adjusted catch yards. In the original post, Neil used receiving yards and 5 and 20 yard bonuses for catches and touchdowns, respectively. I decided to forego the reception bonus and simply use receptions and a 20 yard touchdown bonus. The 5 yard coefficient for catches isn’t bad, but it’s just not the way I prefer to calculate it. If you would like to see this study done with the original methodology, Pro Football Reference has all the information you need to run the numbers through the gamut. [3]You will notice I did not do the subsequent conversion for ACY that Neil did. The reason is simple: I didn’t find it necessary. We can then prorate these numbers to a 16-game league schedule. Using Lance Alworth‘s glorious 1965 campaign as an example: he had 1602 yards and 14 touchdowns, which translates to 1882 ACY. Using 16/14 to prorate to a modern league schedule, that comes to 2151.
  2. Next, we find the number of pass attempts for each team in the league, as well as for the league as a whole. The original version used dropbacks, whereas my version uses passes attempts. This is because it allows me to go back to 1932 rather than stopping at 1949. [4]Or 1947 if you want to use estimated sacks based on sack yardage numbers. By doing this, we can see how often a team passed the ball relative to the rest of the league. For example, the 1965 Chargers threw the ball 28.6 times per game. The AFL average was 32.6. That means the San Diegans passed 88% as often as the average team that league season. Thus, Bambi’s 1965 season gets an adjustment: 2151/0.88 = 2449. Because such steep adjustments can seem a bit too much, we can soften the adjustment by dividing 2151 by the average of 0.88 and 1: 2151/0.94 = 2290.
  3. Now, we find the number of pass attempts per game in each season, as well as the historical average for passes per game. Like the second step allowed us to compare a receiver’s team pass-happiness to contemporary teams, this step allows us to compare his league’s pass propensity to all teams “in NFL (and AAFC and AFL) history.” Since 1932, the first season for which official and mostly-reliable statistics are widely recorded, the average team has thrown the ball 30.35 times per game. Continuing with our Alworth ’65 magnum opus, the 1965 AFL passes 32.61 times per bout. A little back of the envelope math tells us that’s 107% of the historical average. If we soften that the same way we did the adjustment in step two, it drops to 104%.
  4. There are a few paths we can take from here. We can combine the two hardest adjustments like so: 2449/1.07 = 2279. Alternatively, we can combine the soft adjustment from step two with the hard adjustment from step three: 2290/1.07 = 2132. Last, and my preferred method, we can combine the two soft adjustments: 2290/1.04 = 2208.

I hope to all that is pure and true that I have adequately explained this to the FP Faithful. If I have failed to do so, I’m happy to have offseason banter in the comments. For now, let’s look at some tables.

The Boring Table

The first table contains the sausage making data that informs the more interesting tables to follow and is sorted by greatest total adjustment. [5]The combined statistical adjustments of the soft team passing ratio and the soft year adjustment. Read it thus: Bill Smith, playing in the 1935 NFL, caught 24 passes for 318 yards and 2 touchdowns, worth 358 adjusted catch yards. his team played 12 games and passed 10.6 times per contest. The league averaged 15.4 passes per game, so Smith’s squad sported a ratio of 0.69 and a soft ratio of 0.84. The 1935 NFL league year usage rate factor is 0.51, and the soft factor is 0.75. With a league adjustment of 1.18 (1/0.84) and a year adjustment of 1.33 (1/0.75), Smith’s final adjustment is 1.57.

If you are the type who is interested in the nuts and bolts rather than just the results, you may like this one. It shows all the little background modifications outlined in the methodology section, as well as the combination of the two soft adjustments, which will be the basis for what I write about this going forward.

You can see Bill Smith gets the most help from adjustments, with a whopping 57% boost to his ACY. I like this, in part, because it highlights the problems we encounter when we go back too far when trying to compare passing and receiving across eras. The same thing happens when you apply Chase’s RANY and VAL to Sid Luckman‘s 1943. Is it fair that some of these antediluvian fellows get such a large bump? I can’t answer that, but I think it’s important to think about. [6]Important in the NFL stats history sense of the word. Not actual important. We’re all wasting our time with this nonsense anyway.

On the flip side, Calvin Johnson sees the biggest decrease, losing about 20% of his ACY. he doesn’t get any help from prorating, since he already played in a 16-game league. His team was so pass happy that it made people think Matthew Stafford was a future Hall of Famer. And his league was so pass happy that several Hall of Average passers had rapidly ascended career leaderboards. One could argue that it is specifically because Megatron was so talented that his team passed so frequently, and that is a reasonable position to hold. Again, I don’t know that there are definite answers to debates like this, and I’m not here to provide them even if there are. I just want to facilitate (hopefully) friendly discussion.

The Table You Really Want

The table below contains several different versions of True Receiving Yards, based on regular season production, and is sorted by my favorite version – TRYSoft. Here’s how to decipher the information: The famous Crazy Legs 1951 season saw him haul in 66 passes for 1495 yards and 17 touchdowns. That’s good for 1835 adjusted catch yards. That prorates to 2447 ACY in a 16 game schedule. Hirsch played for a pass-happy team, so his team adjustment brings that down to 2121. When we soften that a bit, the number increases to 2272. TRYMax is based on the full team adjustment and the full league adjustment. In Hirsch’s case, that means we divide 2121 by the 1951 NFL factor of 0.888, giving us 2389. TRYMid is based on the soft team adjustment with the full league adjustment, so we divide 2272 by the 0.888 factor, arriving at 2559. My preferred method, TRYSoft, uses softened factors for both the team and the league. For Crazy Legs, that means dividing 2272 by 1951’s soft factor of 0.944, finally landing on 2407.

I think if most regular readers here were to guess prior to seeing the table, they would have correctly picked out the top season (and easily five of the top ten) without giving it much thought. Hopefully this suggests face validity and not mass stupidity on our parts.

The list contains 3090 seasons from 937 players. Only seasons that saw a player gain at least 750 TRYSoft are included. [7]That is combined regular season and postseason TRYSoft. Ranks are with respect to combined numbers, though those numbers aren’t in the tables presented today. The playoff princess is in another … Continue reading Obviously, Jerry Rice leads all receivers in appearances with 18. Larry Fitzgerald backs him up with 16, while Terrell Owens and Tony Gonzalez boast 14 apiece. The GOAT’s top season (playoffs included) is 1989, which ranks sixth. He also sports top-100 seasons ranking 13th, 16th, 17th, 41st, 73rd, and 76th. His seven top-100 seasons leads all receivers.

Underrated-by-modern-box-score-scouts-receiver Michael Irvin has five seasons in the top 100, as does the receiver with arguably the best highlight reel of them all, Randy Moss. Don Hutson, perhaps surprisingly, only has four. Lance Alworth, Steve Smith Sr., and Antonio Brown have three.

I’m sure there are plenty more interesting observations to be made, but I’ll leave that to the good people in the comments.

References

References
1 As measured by adjusted catch yards (ACY), which you’ll read about in less than a minute.
2 Unless I fall prey to ennui and decide to stop without further explanation, which is a very real possibility.
3 You will notice I did not do the subsequent conversion for ACY that Neil did. The reason is simple: I didn’t find it necessary.
4 Or 1947 if you want to use estimated sacks based on sack yardage numbers.
5 The combined statistical adjustments of the soft team passing ratio and the soft year adjustment.
6 Important in the NFL stats history sense of the word. Not actual important. We’re all wasting our time with this nonsense anyway.
7 That is combined regular season and postseason TRYSoft. Ranks are with respect to combined numbers, though those numbers aren’t in the tables presented today. The playoff princess is in another castle.
{ 1 comment }

Players who are in their first three years in the league are responsible for a whopping 45% of all receiving yards this season. That is a new high in the modern era, and since the new CBA was signed in 2011, we have seen a trend of younger players being responsible for more receiving yards.

[continue reading…]

{ 0 comments }

Analyzing wide receivers is complicated, so much so that I’ve devoted a tag here at FP to the project. In my opinion, there’s no one statistic we can use to grade receivers, so a holistic approach is best.

A great wide receiver should have a large percentage of his team’s passing pie. And a great wide receiver should make that passing offense effective. So from time to time, I look to compare how receivers look in these two metrics, and see who is standing out. The theory is simple: if you are a great wide receiver, you should have an outsized portion of that team’s passing offense, unless the supporting cast is so strong that well, the entire passing offense looks great. A wide receiver on a bad passing offense should have a huge percentage of his team’s production, so he’ll still look good here; a wide receiver on a great offense should fare well unless he’s only got a small piece of the pie, in which case he’s probably not having a great season. Regular readers will recall that this analysis is why I think Gary Clark‘s 1991 season is one of the best of all time.

So here’s what I did.

1) Calculate the Adjusted Net Yards per Attempt for each offense so far in 2019.

2) Calculate Adjusted Catch Yards, defined today as Receiving Yards + 20 * Receiving Touchdowns, for each player on each offense.

3) Divide each player’s Adjusted Catch Yards by his team’s total Adjusted Catch Yards; this shows what percentage of the pie each receiver is gobbling up.

There are 12 players who have at least 30% of their team’s Adjusted Receiving Yards this year. Michael Thomas, Mike Evans, Courtland Sutton, Cooper Kupp, Allen Robinson, Chris Godwin, John Brown, Stefon Diggs, Terry McLaurin, D.J. Chark, Amari Cooper, and Tyler Lockett. Of that group, only three — Lockett, Cooper, and Diggs — are playing on really good passing offenses, and Thomas, Kupp, and Chark are the only other ones on passing offenses that are above average. It’s safe to say that all six of these players are having really good years (at least when it comes to picking up receiving yards; Diggs has four fumbles, including three lost, that knock him down a few pegs). And while McLaurin and Robinson are playing on awful passing offenses, at least they are dominating the pie: they are saddled with bad quarterbacks, and there probably isn’t much either of them can do.

I’ve plotted every player with a reception so far in 2019 in the graph below.  The X-Axis shows the Relative ANY/A for that player’s passing offense — this is simply a measure of team pass efficiency, and is calculated as ANY/A minus league average ANY/A.  Players on the Jets are on the far left; players on the Seahawks and Chiefs are on the far right.

The Y-Axis shows the percentage of team’s Adjusted Receiving Yards by each player.  So Michael Thomas (38.8%) is at the top of the chart, Mike Evans is second (at -0.42, 36.0%) is the second highest point, etc.  In general, you want to be up and to the right on this chart.  The four players who stand out here are Thomas (+0.80, 38.8%), Amari Cooper (+1.57, 30.6%), Stefon Diggs (+2.16, 31.1%) and Tyler Lockett (+2.43, 30.3%). [continue reading…]

{ 0 comments }

What do the following 17 players have in common?

Chris Sanders
Devery Henderson
DeSean Jackson
Malcom Floyd
Kenny Stills
Michael Irvin
Julio Jones
Rob Gronkowski
Brandin Cooks
Jordy Nelson
Doug Baldwin
Adam Thielen
Travis Kelce
Michael Thomas
Terry Kirby
Priest Holmes
Pierre Thomas

They are all, as the title of today’s post implies, Pareto Efficient, at least when it comes to two variables: catch rate and yards per carry.

In general, there is an inverse relationship between catch rate (receptions divided by targets) and yards per catch (yards divided by receptions). This is more clearly true in broad strokes at the position level: running backs have high catch rates and low YPC averages, wide receivers (particularly outside wide receivers) have low catch rates and high YPC averages, and tight ends and slot receivers tend to be in the middle on both categories. The graph below shows the catch rate (on the X-Axis) and yards per reception averages (on the Y-Axis) for all players with at least 400 targets since 1992. As you can see, there is a very clear inverse (i.e., negative) relationship between the two variables. Players with high catch rates tend to have low YPC averages, and players with high YPC averages tend to have low catch rates. [continue reading…]

{ 0 comments }

One of the greatest receivers ever

As noted yesterday, Steve Smith played on teams that didn’t pass very often (just 94% as often as the average team) or pass well (his average team’s passing offense produced a -0.12 Relative ANY/A). He’s the only player in the top 20 in career receiving yards who played on teams that were below average in both categories; Muhsin Muhammad and Joey Galloway are the only other such players in the top 40, and Eric Moulds (who ranks 49th) is the only other such player in the top 75 in career receiving yards. There’s a reason that Smith has long been a Football Perspective favorite.

Using the results from Friday’s post and Saturday’s post, we can sum the results to see which receivers really played in the most disadvantageous environments. To do that we need to convert each player’s results in both Pass Ratio and Relative ANY/A into Z-scores.

For Pass Ratio, the average for this group of 200 players was 102.5%, and the standard deviation was 6.7%. So for Smith, whose teams passed on 93.6% of plays, he has a Z-Score in the Pass Ratio variable of -1.33, since his teams were 1.33 standard deviations below average (102.5% minus 93.6% is 8.9%, and 8.9% divided by 6.7% is 1.33). For Relative ANY/A, the average was +0.35 and the standard deviation was 0.63. For Smith, he has a Z-Score in pass efficiency of -0.74, since his teams were 0.12 ANY/A below average (+0.35 minus -0.12 is 0.47, and 0.47 divided by 0.63 gives us how many standard deviations his teams were below average).

Note that the averages here for both pass quantity and quality are above average. That’s not surprising, but it is noteworthy. One, the players with the most receiving yards tended to play on better passing offenses, but we also give more weight to a player’s best seasons, which tend to come when they play with good quarterbacks who frequently pass.

The table below shows the full results for all 200 players. Here’s how to read the Jerry Rice line. He is the career leader in receiving yards with 22,895, and he played from 1985 to 2004. His average team had a RANY/A of +1.57, which was 1.91 standard deviations above average. His average team also had a Pass Ratio of 105.8% of league average, which was 0.51 standard deviations above average. Add those numbers together, and he has a Z-Score total of 2.42. [continue reading…]

{ 0 comments }

Yesterday, inspired by Doug Baldwin leaving Seattle, I looked at the top 200 players in receiving yards and measured how pass-happy that player’s average pass offense was.  For Baldwin, his teams were the 4th-most run-heavy teams of any player on that top 200 list, which obviously disadvantaged him from putting up big numbers.

One thing that helped him, of course, was playing with a great quarterback.  Baldwin’s Seahawks were, on average, 0.65 ANY/A better than average.  That ranks 57th among the 200 players.

Regular readers may recall that I used this methodology to grade receivers last year.  So consider today’s post an update for 2018. Among players who were active in 2018, Rob Gronkowski (+1.50) and Jordy Nelson (+1.38) played on the best passing offenses, and DeAndre Hopkins (-0.39) and Larry Fitzgerald (-0.32) played on the worst passing offenses relative to league average. That isn’t going to be breaking news to anyone, but that’s not the point: yes, we know that the Patriots and Packers have had good passing offenses, and the Texans and Cardinals have not. But quantifying those terms is always helpful.

The full results, below: [continue reading…]

{ 1 comment }

A sight Seahawks fans loved to see.

Doug Baldwin was released by the Seahawks yesterday due to multiple injuries that leaves his career in doubt. It is not expected that he will ever play in the NFL again, and if this truly is the end, it was a special run for a unique player.

Baldwin will be remembered as a Seahawks great, one of the engines of the best era in Seattle’s history.  He was an undrafted free agent out of Stanford, and while he wasn’t quite Rod Smith, Wes Welker, or Drew Pearson, he can make a reasonable case as being one of the top 10 or so wide receivers to get overlooked in the draft.

But when we look back on his career, his statistics won’t tell much of a story.  With just 6,563 career receiving yards, he will get lost with the many of talented wide receivers in pro football history.  Even in the postseason, Baldwin’s 734 yards and 6 touchdowns in 13 games won’t quite stand out. [continue reading…]

{ 0 comments }

This is a picture of one Hall of Fame player.

The Giants really did it: New York traded Odell Beckham to the Cleveland Browns for the 17th and 95th picks in the 2019 Draft, along with safety Jabrill Peppers. On the surface, this is an insane decision by the Giants front office. Dig a little deeper, as Bill Barnwell did, and your suspicions are confirmed.

A future Hall of Fame wide receiver — which is the trajectory Beckham is on — who is just 26 years old is an invaluable asset. Consider that Don Hutson, Marvin Harrison, Steve Largent, Michael Irvin, Raymond Berry, John Stallworth, Fred Biletnikoff, Lynn Swann, Calvin Johnson, Reggie Wayne, and a host of other great receivers (include a still active Larry Fitzgerald) played their whole careers for one team. Their teams saw an elite talent and never let them go. I expect Julio Jones to join this group or the next one.

Some all-time greats eventually moved on to other teams at the tail ends of their careers, like Jerry Rice, Tim Brown, Art Monk, Andre Reed, Isaac Bruce, Steve Smith, Harold Carmichael, Stanley Morgan, Andre Johnson, Torry Holt, Chad Johnson, Henry Ellard, Bob Hayes, etc. It’s not unusual for teams to part ways when they think their superstar receiver is outside of his prime years.

Even in cases where some all-time greats left earlier, it still wasn’t that early. Lance Alworth, James Lofton, Terrell Owens, Tommy McDonald, Harlon Hill, Gary Clark, and yes, even Antonio Brown, played all of their 20s with one team. [continue reading…]

{ 0 comments }

Antonio Brown is in the news today. The star receiver was just traded from Pittsburgh to Oakland, capping one of the most successful runs any wide receiver has ever had with one team.

Brown led the NFL in receiving yards from 2012 to 2016, a 5-year period where he racked up 7,102 yards. Then he had a monster year in 2017, and his trailing 5-year total was upped to a whopping 7,848 yards. That not only led all players, it also was the largest number of receiving yards any player ever gained over any 5-year period.

That held true for… one season, as Julio Jones — who missed most of 2013 — led the NFL in receiving yards from 2014 to 2018 with 7,994 yards.

The table below shows the league leader in receiving yards over every 5-year period. Note that the AAFC and AFL have pretty strong representation here; for those curious, I included both leagues when calculating the league leaders, but I also noted in the footnotes who would be the leader if your study was NFL stats only. [continue reading…]

{ 0 comments }

2018 Air Yards And YAC, By Position

RB Christian McCaffrey had 867 receiving yards last year, while WR Chris Godwin had 842 receiving yards. But they got there in very different ways. McCaffrey gained just 16 of his receiving yards via “air yards” — yards gained on catches based on yards in the air the pass traveled from the line of scrimmage to the receiver — and 851 of his receiving yards came on yards gained after the catch. Godwin had 597 air yards, and 245 yards after the catch.

That’s an extreme split, but consistent with the general rule that running backs gain very little air yards (many of their receptions come from behind the line of scrimmage, which produces negative air yards) and a lot of yards after the catch. For wide receivers, about 60-70% of their yards come through the air, with the remainder coming after the catch.

Tight ends are interesting, by virtue of usually landing somewhere in between those two marks. The graph below shows data from the 2018 season, with air yards shown on the X-Axis and yards gained after the catch shown on the Y-Axis. Running backs are in red, tight ends are in green, and wide receivers are in blue. [continue reading…]

{ 0 comments }

DeSean Jackson has been putting together long runs for a long time.

In 2010, a third-year DeSean Jackson, playing with the Eagles and Michael Vick, led the NFL in yards per reception at 22.5.

In 2014, in Jackson’s first year with the Redskins, and playing with a rotating trio of quarterbacks in Robert Griffin, Kirk Cousins, and Colt McCoy, Jackson again led the league in yards per reception at 20.9.

In 2016, in Jackson’s final year in Washington, he teamed with Cousins to lead the NFL in yards per reception (17.9) for a third time.

Now, in 2018, alternating between Jameis Winston (15.2 YPC with 198 yards on 13 receptions) and Ryan Fitzpatrick (20.4 YPC with 552 yards on 72 catches), Jackson is once again leading the NFL in yards per reception (18.8).

How remarkable would it be for Jackson to lead the league in yards per reception for a fourth time in his career?  He nearly picked up a fourth crown in his second season, when he was a runner-up to Mike Wallace in 2009.  No player has ever led the NFL in yards per catch four times in their career, and Stanley Morgan (1979, 1980, 1981) and Jimmy Orr (1958, 1964, 1968) are the only players to even do it three times.

So Jackson is already in the discussion for best yards per reception player in league history, but what’s really impressive is his ability to maintain this skill in different environments.  Morgan was on the Patriots all three years, in Ron Erhardt’s vertical offense, with Steve Grogan throwing over two-thirds of passes during those years, and Matt Cavanaugh starting 12 games.   Orr teamed up with three different quarterbacks and two different teams (Bobby Layne in Pittsburgh in 1958, and Johnny Unitas in 1964 and Earl Morrall in 1968 with the Colts).

But Jackson will be with three teams, three coaches, and four different quarterback situations (not to mention, his performance in 2009 came with Donovan McNabb).  Jackson is a remarkable deep threat not dependent on any quarterback, system, or coach. And now, he’s showing that age may not be a key variable, either.

The oldest player to lead a league in yards per reception was Henry Ellard, who averaged 19.5 yards/catch with the Redskins in 1996. No 34-year-old has done it, but Jimmy Orr (25.6 in the 1968 NFL) and Don Maynard (22.8 in the 1968 AFL) did it at age 33. A 32-year-old Joey Galloway led the league in yards per catch in Dallas in 2003 (19.8), and Elbert Dubenion (31 in 1964), DeSean Jackson (30 in 2016), and Malcom Floyd (30 in 2011) are the only other 30+ year old players to win the YPC crown.

Jackson’s performance has fallen with Winston in 2018, and his performance with Winston in 2017 led to the lowest YPC average of his career. We’ll see what happens over the final two games — Jackson is going to miss today’s game due to injury — but Jackson may be on the verge of a record-breaking season.

{ 0 comments }

Since the start of the 2013 season, the top 5 players in receptions consist of three future Hall of Famers — Antonio Brown, Julio Jones, and Larry Fitzgerald — and two players traded yesterday.  Those two players, Demaryius Thomas and Golden Tate, may not be bound for Canton, but they should be remembered as two of the best receivers of the ’10s.

Thomas may well wind up on as a second team member of the  All Decade team of the ’00s.  As of today, he ranks 3rd in the decade in receiving yards (behind Brown and Jones), third in receptions (behind Brown and Fitzgerald), and 8th in receiving touchdowns.  Tate has a reputation as one of the best receivers in the NFL in terms of yards after the catch: he’s averaged 6.7 yards after the catch since 2013, easily the most of any wide receiver with a significant number of receptions.

The two receivers have both made a living on short passes; on passes within 15 yards of the line of scrimmage, the duo rank 2nd and 3rd in receptions behind Brown.  And given that both players are now changing teams — Tate was traded to the Eagles for a 3rd round pick, Thomas was traded to the Texans for a 4th round pick — it’s worthwhile to see how each receiver has done under different passers.  In particular, given how both have been great on shorter passes, I used the PFR Index to see the quarterback breakdown for each receiver on passes since 2013 under 15 yards from the line of scrimmage. [continue reading…]

{ 0 comments }

Which teams are throwing the most to one receiver? Which teams are spreading it around the most? A good way to answer that is by using a Concentration Index. Let’s use Andrew Luck and the Indianapolis Colts as an example. Eric Ebron is the team’s leading receiver with 326 receiving yards, which represents 18.2% of the team’s total 1,796 receiving yards. To calculate a team’s concentration index in receiving yards, you need to square the percentage of receiving yards by each player, and sum the results. For example, 18.2% squared is 3.3%; do that for every player on Indianapolis and the total is 12.6%.

As it turns out, that’s the most diverse passing attack in the NFL. The most concentrated passing attack? That’s in Detroit:

The table below shows the concentration index for each team through six weeks, along with each team’s passing efficiency (as measured by ANY/A). Here’s how you read the top line. Detroit has the highest concentration index. The Lions have 1,404 receiving yards and have averaged 6.17 ANY/A, which ranks 20th in the NFL. Tate is the team’s leading receiver with 31% of the Lions receiving yards, and the team has a concentration index of 23%. [continue reading…]

{ 1 comment }

Let’s compare two groups of 2018 receivers.

Group A

Adam Thielen
Odell Beckham
DeAndre Hopkins
Zach Ertz
Julio Jones

Group B

Brandin Cooks
George Kittle
Mike Evans
Tyreek Hill
Cooper Kupp

Which group of receivers would you rather have going forward? I think you know the answer to that question.

The receivers in Group A are the top 5 receivers this season as measured by one simple metric: yards multiplied by targets.

The receivers in Group B are the top 5 receivers this season as measured by another simple metric: yards divided by targets, based on a the players who rank in the top 50 this season in targets.

Here’s how to read the table below. Brandin Cooks has played 5 games this year and has seen 33 targets and gained 452 receiving yards. If you multiply his yards by his targets, he has 14,916, and his Yards x Target rank is 28th. On the other hand, he has averaged 13.7 Yards per Target, which ranks 1st in the league through five weeks. [continue reading…]

{ 1 comment }

How To Get A Lot of Receiving Yards

There are a few ways to get a lot of receiving yards.

One way is to play with a good quarterback, assuming that is defined as a quarterback who averages a high number of yards per attempt. This is pretty self explanatory.

Another way, though, is to play with a quarterback who throws a lot of passes. For example, we know that Russell Wilson is a much better quarterback than Derek Carr. The stats back this up, too: Wilson has averaged 7.82 Y/A for his career; by comparison, Carr has averaged just 6.54 Y/A for his career. But Carr has averaged 36.2 pass attempts per game, while Wilson is at just 29.5. As a result, Carr has averaged 237 passing yards per game, while Wilson has averaged only 231 passing yards per game. Since every passing yard is a receiving yard, it’s actually been better to play with Carr than Wilson if your goal was to get a lot of receiving yards.

So, you might realize, if receiving yards just equals gross passing yards, then having a good quarterback is only half the equation.

Receiving Yards = (Yards/Attempt) x Attempts

So if you are a receiver, you want to play on a team that has a good passer, or passes a lot, or better yet — both! On the other hand, a wide receiver can’t control these things.  We would naturally expect that the same wide receiver would gain fewer yards if he suddenly played for a team with a worse passer and if that team passed less often.

So can we control for this?  You might think that we should focus more on percentage of team receiving yards, rather than raw receiving yards.  For example, this might mean a receiver with 1,000 receiving yards on a team that threw for 3,000 yards was “better” than a receiver with 1,200 receiving yards on a team that threw for 4,000 yards.  After all, the first receiver had 33.3% of his team’s passing game, while the second receiver had just 30% of his team’s passing game.

But there are issues with that, too.  Let’s assume that both teams threw 500 passes, so the team that threw for 3,000 yards averaged just 6.0 yards per attempt, while the team that threw for 4,000 yards averaged 8.0 yards per attempt.  A team that averages 6.0 yards per attempt is a very bad passing team, while a team that averages 8.0 yards per attempt is a very good passing team.  But here’s the question: is it “better” or “more impressive” to be responsible for 33.3% of a very bad passing game or 30.0% of a very good passing game? [continue reading…]

{ 1 comment }

Yesterday, I looked at the leaders in Gray Ink in Receiving Yards per adjusted Team Pass Attempt. There was a pretty notable name absent from that list: Larry Fitzgerald, who currently ranks 3rd on the all-time receiving yards list. So what gives? The graph below shows Fitzgerald’s relevant statistics from every season of his career.

For example, in 2004, playing for Arizona, he had 780 receiving yards and his team had 533 Team Pass Attempts (excluding sacks). The Cardinals ranked 13th Team Pass Attempts that season. Fitzgerald averaged 1.46 Receiving Yards/Team Pass Attempt, and 1.46 Receiving Yards/adjusted Team Pass Attempt (meaning he played a full season). He ranked 46th in RY/TPA and 55th in RY/aTPA. He also ranked 42nd in raw receiving yards.

[continue reading…]

{ 0 comments }

Yesterday, I wrote about how Michael Irvin was dominant in Receiving Yards per adjusted Team Pass Attempts.  From 1991 to 1996, he ranked 1st in that category three times, and 2nd in the other three seasons.  From a Gray Ink perspective, that would mean he would get 10 points each for his three first place finishes and 9 points each for his three second place finishes, for a total of 57 points.  He also ranked 10th in 1998, which would give him one more point.

The fact that I wrote about Irvin yesterday wasn’t a coincidence.  I calculated the Gray Ink for each receiver in NFL history in RY/aTPA, and Irvin’s 58 points (which turns out to be 55 points after you adjust for the number of teams in the league) was the third best in NFL history. Here are the top 75 receivers by this metric. You can read the table below as follows. Jerry Rice played from 1985 to 2004, and accumulated 92 points of Gray Ink, where a 1st-place finish in Receiving Yards/adjusted Team Pass Attempt is worth 10 points, a 2nd-place finish 9 points, a 3rd-place finish 8 points, and so on. The final column is a pro-rated value number, which lowers the value gives in seasons where there were fewer than 32 teams. This most clearly impacts older players like Don Hutson, who drops from 102 points to 66.9 points. [continue reading…]

{ 0 comments }

Michael Irvin Was Better Than You Think

Michael Irvin ranks 27th on the list of career receiving yards. At the time he retired, Irvin ranked 9th in that metric, so some of his “poor” ranking is due to the passing inflation of the last two decades.

Another reason is because he had a relatively short career. Irvin also ranks tied for 11th in receiving yards per game, and was tied for 5th when he retired. How short? His prime was from ages 25 to 32, an 8-year stretch that encompassed 86.5% of his career receiving yards.

During those years, covering the 1991 to 1998 seasons, Irvin led all players in receiving yards.  Yes, that’s all players, even Jerry Rice, although Rice missed 9 more games than Irvin due to a torn ACL.  Even still, Rice averaged 85.5 yards per game, Irvin 83.7, and the two receivers were far ahead of the rest of the NFL.  But it’s worth noting that the Cowboys were a run-heavy team during this era: Dallas ranked 24th in pass attempts during this time, while the 49ers ranked 12th.

Irvin was a dominant player on a team that wasn’t pass-happy; he was particularly dominant in games his team won, when he averaged 85 receiving yards per game.  Those Cowboys won a lot of games, and didn’t pass often, but when they did, they passed to Irvin.  And it usually worked.

Over the weekend, I wrote about the year-by-year leaders in receiving yards per team pass attempt (RY/TPA) and Receiving Yards per Adjusted Team Pass Attempt (RY/aTPA), which are two simple but effective ways to measure receiver play. RY/TPA simply takes a player’s number of receiving yards and divides it by his team’s number of pass attempts; RY/aTPA adjusts for missed games. [continue reading…]

{ 1 comment }

Yesterday, we looked at the leaders in receiving yards per team pass attempt. Today, I want to look at the leaders in receiving yards per adjusted team pass attempt.

What do I mean by adjusted team pass attempts?  Let’s look at three players from last year: Julio Jones, DeAndre Hopkins, and Antonio Brown.  Those three had 1444, 1378, and 1533 yards, respectively, in 2017. And the Falcons, Texans, and Steelers had 530, 525, and 590 pass attempts, respectively, last year. This means Jones averaged 2.72 receiving yards per team pass attempt, Hopkins 2.62, and Brown 2.60. Pretty straightforward.

Except Jones played in 16 games, Hopkins 15, and Brown 14. If we assume Hopkins therefore only saw (15/16) * 525 pass attempts — or 492 pass attempts — then Hopkins averaged 2.80 receiving yards per adjusted team pass attempt. And if we assume Brown only saw (14/16) * 590 pass attempts — or 516 pass attempts — then Brown averaged 2.97 RY/aTPA. [continue reading…]

{ 0 comments }
Previous Posts