≡ Menu

In 2008, Larry Fitzgerald had a fantastic regular season capped off by a historically great postseason; in the Super Bowl, he set the record for receiving yards in a season, including playoff games, with 1,977 yards. Of course, 2008 was decades ago in today’s era of what have you done for me lately. The table below shows Fitzgerald’s stats over the past four seasons. The final two columns show the total number of receiving yards generated by all Cardinals players and Fitzgerald’s share of that number.

YearRecYdsYPRTDARI Rec YdsPerc
200997109211.313420026%
201090113712.66326434.8%
201180141117.68395435.7%
20127179811.24338323.6%

2009 was the last season of the Kurt Warner/Anquan Boldin Cardinals. The 97 receptions and 13 touchdowns look great, although hitting those marks and not gaining 1,100 receiving yards is very unusual. Fitzgerald was only responsible for 26% of the Cardinals receiving yards that season, although one could give him a pass since he was competing with another star receiver for targets.

Can Fitzgerald rebound in 2013?

Can Fitzgerald rebound in 2013?

In 2010, Derek Anderson, John Skelton, Max Hall, and Richard Bartel were the Cardinals quarterbacks: as a group, they averaged 5.8 yards per attempt on 561 passes. Arizona’s passing attack was bad, but without Boldin, Fitzgerald gained 34.8% of the team’s receiving yards. Steve Breaston chipped in with 718 receiving yards yards while a 22-year-old Andre Roberts was third with 307 yards. In other words, Fitzgerald performed pretty much how you would expect a superstar receiver to perform on a team with a bad quarterback and a mediocre supporting cast: his raw numbers were still very good (but not great) because he ate such a huge chunk of the pie. After the 2010 season, I even wondered if he could break any of Jerry Rice’s records (spoiler: he can’t).

In 2011, Skelton, Kevin Kolb and Bartel combined for 3,954 yards on 550 passes, a 7.2 yards per attempt average (Kolb was at 7.7 Y/A). That qualifies as a pretty respectable passing game and Fitzgerald appeared to have a monster year, gaining 35.7% of the Cardinals’ receiving yards (Early Doucet was second with 689 yards and Roberts was third with 586 yards). It’s always hard splicing out cause and effect, but my takeaway is that with a more competent passing game, Fitzgerald continued to get the lion’s share of the team’s production but unlike in 2010, this led to great and not just good numbers.
[continue reading…]

{ 12 comments }

Over at Footballguys.com, I look at a different method to project receiving yards.

The number of receiving yards a player produces is the result of a large number of variables. Some of them, like the receiver’s ability, are pretty consistent from year to year. But other factors are less reliable, or less “sticky” from year to year. I thought it would be informative to look at three key variables that impact the number of yards a wide receiver gains and measure how “sticky” they are from year to year. These three variables are:

  • The number of pass attempts by his team;
  • The percentage of his team’s passes that go to him; and
  • The receiver’s average gain on passes that go to him.

We can redefine receiving yards to equal the following equation:

Receiving yards = Receiving Yards/Target x Targets/Team_Pass_Att x Team_Pass_Att.

You’ll notice that Targets and Team Pass Attempts are in both the numerator and denominator of one of the fractions, and they will cancel each other out: that’s why this formula is equivalent to receiving yards.

By breaking out receiving yards into these three variables, we can then examine the stickiness of each one, which should help our Year N+1 projections. Below are the best-fit equations for each of those variables in Year N+1:

Future Pass Attempts = 36 + (450 x Pass_Attempts/Play) + (0.255 x Offensive Plays)

Future Percentage of Targets = 6.2% + 71.3% x Past Percentage of Targets

Future Yards/Target = 5.5 + 0.29 x Past Yards/Targets

I then used those three equations to come up with a starting point for receiving yards projections for 28 wide receivers. You can read the full article here.

{ 0 comments }

After hearing that the other Steve Smith was retiring, Kyle on twitter asked me where Smith’s 2009 season ranked in the pantheon of anomalous wide receiver seasons. In case you forgot, take a look at Smith’s yearly production:

Year Age Tm G GS Rec Yds Y/R TD
2007 22 NYG 5 0 8 63 7.9 0
2008 23 NYG 16 4 57 574 10.1 1
2009* 24 NYG 16 15 107 1220 11.4 7
2010 25 NYG 9 7 48 529 11.0 3
2011* 26 PHI 9 1 11 124 11.3 1
2012 27 STL 9 0 14 131 9.4 0
Career 64 27 245 2641 10.8 12
4 yrs NYG 46 26 220 2386 10.8 11
1 yr PHI 9 1 11 124 11.3 1
1 yr STL 9 0 14 131 9.4 0

Smith had what looked like a breakout season in 2009, catching 107 passes for 1,220 yards and seven touchdowns. As it turned out, those numbers represent 44% of his career receptions, 46% of his career receiving yards, and 58% of his career touchdowns.

So how do we measure the biggest outlier seasons of all time? One way would be to compare each receiver’s best season to his second best season and see the difference. I used Adjusted Catch Yards — calculated as Receiving Yards plus five yards for every Reception and twenty yards for every Receiving Touchdown — to do that for every retired receiver and tight end in NFL history. The table below shows all receivers who gained at least 800 more Adjusted Catch Yards in their best season than in their second best season. For example, here’s how to read the Germane Crowell line. Crowell’s best season came with Detroit in 1999, when he caught 81 passes for 1,338 yards and 7 touchdowns. That’s equal to 1,883 Adjusted Catch Yards. In his second best year, he caught only 34 passes for 430 yards and three touchdowns, giving him only 660 ACY. That’s 1,223 Adjusted Catch Yards fewer than in his best season. Using this method, Steve Smith comes in with the sixth most anomalous season in NFL history.
[continue reading…]

{ 3 comments }

Longest Streaks without a 1,000-yard receiver

The last Jaguar to record 1,000 receiving yards in a season.

The last Jaguar to record 1,000 receiving yards in a season.

A couple of weeks ago, I looked at the longest team streaks without a 1,000-yard rusher. Today’s post examines the teams that went the longest stretch without boasting a 1,000-yard receiver. I’m only going to look at things starting in 1978 (with one caveat), however, as 1,000-yard seasons were much rarer before then. The Redskins and Cardinals didn’t even have a 1,000-yard receiver until 1962, when Bobby Mitchell and Sonny Randle hit those marks for Washington and St. Louis, respectively.

The Jaguars and Raiders have each gone seven straight seasons without a 1,000-yard receiver. Jimmy Smith, one of the most underrated receivers in NFL history, was the last Jacksonville player to gain 1,000 receiving yards in a season. Fortunately for Jaguars fans, there’s a good chance the streak ends in 2013. Cecil Shorts missed two full games due to injury and finished with 979 receiving yards during his breakout season last year, and should be even better this year. He also could benefit from Justin Blackmon being out for the first four games of this season. As for Oakland, the last receiver … well, see if you can remember who was the last Raider with 1,000 receiving yards in a season. Answer is at the end of this post.

The table below shows all teams since 1978 to go at least seven straight years without a 1,000-yard receiver. The one caveat from above? I’ll include pre-1978 seasons for any team that also failed to produce a 1,000-yard receiver from ’78 to ’84, too.
[continue reading…]

{ 3 comments }

Turner describing a route. I think.

Turner describing a route. I think.

With Norv Turner, you know what you’re going to get. Turner was fired in San Diego after the Chargers failed to make the playoffs in each of the last three years, but as usual, Turner was able to find a nice landing spot. He’ll be the Browns offensive coordinator in 2013, which will mark his 29th straight year in the NFL. Turner started as a receivers coach with the Rams in 1985 and hasn’t been out of work for very long ever since.

And while he has a reputation for having great running games, he also has habit of sending his receivers down the field. That’s no accident. Ernie Zampese, a longtime assistant under Don Coryell, became the Rams offensive coordinator in 1987, and Turner’s teams have been running a variation of the vertical Coryell/Zampese system ever since.

I ranked all players (minimum 500 receiving yards) in yards per reception in each year since Turner was united with Zampese in ’87. In six of those seasons, one of five different Turner receivers led the NFL in yards per reception. In addition, Turner’s top receiver (in terms of YPR) finished in the top five in that metric thirteen more times. The table below shows the rank of the highest-ranked receiver (in terms of YPR) in Turner’s offense in each of the last 26 years.
[continue reading…]

{ 2 comments }

Bambi shouldered much of the Chargers passing offense.

Bambi shouldered much of the Chargers passing offense.

Seven years ago, Doug wrote this post analyzing wide receivers by team receiving yards. That post was overdue for an update for three reasons: (1) it was written seven years ago; (2) Doug only went back to 1978, while we now can go back to 1932; and (3) I think using Adjusted Catch Yards (which gives receivers 5 additional yards for every reception and 20 additional yards for every touchdown) is better than just using receiving yards.

For every year of every receiver’s career, I computed the percentage of his team’s Adjusted Catch Yards that he accounted for. I then averaged together each receiver’s 6 best six seasons according to that metric, and ignored all wide receivers who have played in fewer than six seasons. The results are listed below for the 161 receivers to hit the 25% mark, along with the six years selected for each receiver. As always, you can use the search box to find your favorite receiver, and the table is sortable, too.
[continue reading…]

{ 10 comments }

Placing Cecil Shorts’ Production in Context

Shorts made the most of his one catch against the Colts

Shorts made the most of his one catch against the Colts.

One of the surprising success stories of the 2012 season was the breakout performance of second-year Jacksonville wide receiver Cecil Shorts. With a cap value of $729,000 in 2013, Shorts is probably the best value on the Jaguars roster. But he’s one of the more confusing players to project.

The optimistic outlook on Shorts is simple. He missed two games with a concussion and took a couple of weeks to become a key part of the Jacksonville offense (he didn’t record a catch in week two, for example): in his final 12 games, Shorts averaged over 75 yards per game and scored 6 touchdowns. That would put him on a 1200-yard, 8-touchdown pace over a full slate of 16 games as a starter.

But there are other factors to consider. Shorts was only a fourth round pick and gained just 30 yards as a rookie, so he doesn’t have much of a resume beyond 2012. And while he may have produced impressive numbers, Jacksonville ranked 29th in ANY/A last year, making Shorts the co-star (along with Justin Blackmon) of a really bad passing offense. And what’s impressive about that?

So which view should carry more weight? The productive season he had as an individual or the fact that he’s a low-pedigree player who was only responsible for 26.1% of the receiving yards on a terrible passing team?
[continue reading…]

{ 5 comments }

Jerry Rice’s records are essentially unbreakable. Over a marvelous twenty-year career, Rice caught 41 more touchdowns than Randy Moss, 44 more than Terrell Owens, and 67 more than every player other than Moss and Owens. He also holds the overall touchdowns mark, with 33 more touchdowns than Emmitt Smith, 46 more than LaDainian Tomlinson, and over 50 touchdowns more than every other player in NFL history. If you check the NFL records books, no player has finished his career with more than 16,000 receiving yards and fewer than 22,895 receiving yards: that’s how wide the gulf is between @JerryRice and the rest of the great wide receivers.

But there is one record that possibly, maybe, hey you never know could be broken. Jerry Rice is the career leader with 1,549 receptions. For some perspective, Steve Largent was the first player to reach the 800 receptions mark, and Art Monk passed Largent in 1992. Rice caught the still-active Monk in the final game of the 1995 regular season. Monk would retire after the season with 940 catches to his name; as he laced up his cleats for the last time, he was the career leader in receptions. When he came off the field that day, he had been relegated to number two. That’s because 700 miles away, Rice caught 12 passes against the Falcons, bringing his career total up to 942. Oh, and Rice also set the single-season record for receiving yards that day, too. Rice turned 34 in 1996; up until that point, only Charlie Joiner (325) had recorded more than 300 receptions after his age 33 season. Even though Rice missed nearly the entire 1997 season due to injury, he still caught 607 passes after 1995. Which is why we always assumed this record was unbreakable.

However, as teams began passing more frequently (and more conservatively) than ever before, some modern receivers have compiled massive receptions totals. Did you know that Tony Gonzalez is number two all-time in career receptions? With 1,242 catches, Gonzalez has a 140-catch lead on #3 man Marvin Harrison, but Gonzalez still trails Jerry Rice by 307 catches.

But what about Gonzalez’ statistical doppelganger, Jason Witten? Four years ago, I wrote that Witten was going to find himself in the Hall of Fame because of his massive numbers:

Jason Witten entered the NFL at age 21. That’s very young for a player at any position, let alone tight end. So how has he done?

  • Through age 22, he had more receptions and receiving yards than any other tight end.
  • Through age 23, he had more receptions and receiving yards than any other tight end.
  • Through age 25, he had more receptions and receiving yards than any other tight end.
  • Through age 26 (the 2008 season), he had more receptions and receiving yards than any other tight end.
  • With 40 receptions and 472 receiving yards in 2009, he will have more receptions and more receiving yards than any other tight end through the age of twenty-seven.

Witten hasn’t slowed down since I wrote that article. With 806 receptions, he has the most catches of any player through age 30 in history (although Larry Fitzgerald should catch him next year). I thought it would be interesting to chart the career receptions totals of Rice, Witten, and Gonzalez. The graph below shows the career receptions of each player at the end of each season, with age on the X-axis and career receptions on the Y-axis. Witten is in Cowboys blue and silver; unfortunately Chiefs fans, I chose to reserve red and gold for Rice, leaving Gonzalez in Falcons black and red.

Rice Witten Gonzalez career receptions

Even now, Gonzalez has a lead on Rice, and he’ll be 36 catches ahead of Rice after 2013 even if he doesn’t catch a single pass. Of course, Rice went (literally) off the chart in his final years, making it essentially impossible for Gonzalez to catch him.

But Witten has basically had the same career as Gonzalez but with an even larger buffer against Rice. Witten’s lead on Gonzalez grew significantly this year thanks to a 110-catch season at age 30 (the year Gonzalez had just 73 catches), but ages 31 to 33 were ridiculous years for both Gonzalez and Rice. The odds are very much against Witten getting to 1,549 catches, but becoming the second player to hit the 1400-catch mark is a realistic (and incredibly impressive) goal.

The left columns in the table below shows the number of career receptions through each age for each of Rice, Gonzalez, and Witten. The right three columns show the number of catches by each player at each age.

AgeRice (C)Gonzalez (C)Witten (C)Rice (S)Gonzalez (S)Witten (S)
21033353335
220921225987
2349168188497666
24135261252869364
25200334348657396
26264397429646381
27346468523827194
2844657061710010294
29526648696807879
306107218068473110
317088208069899
3282091680611296
3394299980612283
341050106980610870
3510571149806780
36113912428068293
371206124280667
381281124280675
391364124280683
401456124280692
411519124280663
421549124280630

Witten has a nearly 200-catch lead on Rice through age thirty. If we assume Witten can stay healthy in each of the next five years, he’ll get an even bigger buffer when he hits age 35. If we give Witten 351 catches over the next five years, he’ll be at 1157, giving him a 100-catch lead on Rice. Based on what Rice did after age 35, that’s not going to be anywhere near enough. If Witten wants a realistic shot, he’s going to need to keep pumping out 90-100 catch seasons for the next four years, at least. In any event, Witten will be able to keep this dream up for awhile: he needs just 38 catches in 2013 to end the year with the most receptions of any player through age thirty-one.

{ 8 comments }

Forgotten Stars: Hugh Taylor

Bones stretches for a touchdown

Bones stretches for a touchdown.

Only three players in NFL history have been responsible for half of their team’s receiving touchdowns over a six-year period: Don Hutson, Jerry Rice, and Hugh Taylor. You probably don’t know much about Taylor, the Washington Redskins star receiver who played from 1947 to 1954. In his first game in the NFL, he caught 8 passes for 212 yards and 3 touchdowns, giving him the record for receiving yards in a player’s first game that stood until 2003.  In his last game, he caught five passes for 106 yards and three touchdowns.  In between those games, he was a star receiver on one of the worst teams in the NFL.  Despite the short career, Taylor came in at #63 on my list of the best receivers of all time. His most impressive season came in 1952, when he was responsible for 45% of the Redskins’ receiving yards and produced the 52nd-best season ever by a wide receiver.

At 6’4, Taylor was one of the tallest receivers of his era, but at only 194 pounds, he was also very deserving of his nickname: Bones. Taylor made up for his skinny physique with a long stride that enabled him to get behind defenders.  I spoke with T.J. Troup, an NFL historian who has coached wide receivers at the college and high school levels, for his thoughts on Taylor. Troup owns a significant amount of NFL film from the late ’40s and ’50s, making him the perfect source for this subject.  He described Taylor to me as one of the best home-run threats of his day, with a playing style similar to other long-striders like Harlon Hill, Don Maynard, and Lance Alworth. The numbers certainly back that up.

The table below shows all receivers who were responsible for at least 39% of a team’s receiving touchdowns over a six-year period.  Note that several receivers would show up multiple times on this list, so for players like Hutson, I’ve limited them to their single best six-year stretch. Taylor’s stretch from ’49 to ’54 ranks second on the list:

[continue reading…]

{ 9 comments }

A closer look at Danny Amendola

Amendola in his element

Amendola in his element.

Few get the statheads talking like Danny Amendola. Bill Barnwell wrote a free-agent book on Amendola in March, where he presented Amendola in the best possible light. Barnwell noted that over the last four years, Bradford has completed 66.5% of his passes aimed at Amendola compared to just 56.8% to all other targets. Barnwell further argued that since Amendola was much more productive in St. Louis than Wes Welker was in Miami, there is a good chance Amendola sees a big, Tom Brady-induced spike when he moves to New England, too.

Scott Kacsmar takes a slightly different view. First, the pro-Amendola argument: since 2010, the Rams are 12-15-1 (.446) when Amendola plays and 4-16 (.200) when he is out. Kacsmar also shows that the Rams averaged 18.9 PPG, 5.8 yards per pass attempt, and 312 yards per game, along with a 5.9% sack rate, in games with Amendola, versus averages of just 12.6, 5.6, 296, and 8.1%, respectively, in games that St. Louis played without Amendola. On the negative side, Kacsmar focused on Amendola’s miserable 8.81 yards-per-reception average, the lowest in history by a wide receiver with at least 100 receptions (by a pretty large margin). Another reason not to be impressed with Amendola’s high catch rate is that 29% of his receptions were “failed completions” [1]These are plays where the player fails to gain a minimum percentage of yards towards a first down (45 percent on first down, 60 percent on second down and 100 percent on third/fourth down. according to Kacsmar.

Amendola is a unique player in the same sense that Darren Sproles isn’t a traditional running back or Tim Tebow isn’t a traditional quarterback. Amendola’s a wide receiver, but he doesn’t operate the way wide receivers have for much of NFL history. According to Pro Football Focus, Amendola was in the slot on 85% of his routes over the last four years; that’s an enormous number, as even Wes Welker ran routes out of the slot on “only” 73.8% of his routes over that time period.
[continue reading…]

References

References
1 These are plays where the player fails to gain a minimum percentage of yards towards a first down (45 percent on first down, 60 percent on second down and 100 percent on third/fourth down.
{ 7 comments }

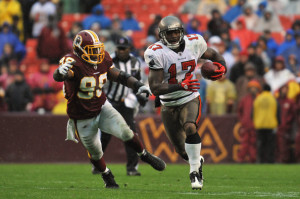
Benn against the Redskins

Benn against the Redskins.

To the casual fan, Arrelious Benn is one of many nondescript wide receivers in the NFL. The Buccaneers selected him in the second round of the 2010 Draft, he gained 862 yards in three seasons, and Tampa Bay just traded him to Philadelphia for a 7th round pick in the 2013 draft.

My curiosity with Benn dates back to his college days. He came to Illinois as a five-star recruit and he gained 676 yards and 2 touchdowns as a true freshman.   While that might not sound impressive, he gained more than twice as many receiving yards as any other player on the team, and his production earned him Big Ten Freshman of the Year honors. That 2007 Illini threw the fewest passes in the Big Ten, suppressing Benn’s numbers, but landed in the Rose Bowl based on a run-heavy attack led by Rashard Mendenhall. They were quarterbacked by Juice Williams, a running “quarterback” in name only, and coached by Ron Zook, the two men who would torpedo the Illinois offense over the next two seasons.

As a sophomore, Benn again more than doubled the production of the next best receiver on the Illini: he caught 67 passes for 1,066 yards and ran 23 times for 101 yards. Those numbers were good enough to lead the conference in receiving yards during the regular season, although Minnesota’s Eric Decker passed him in Minnesota’s Bowl game. Illinois didn’t have a Bowl game, as the team imploded and finished 5-7.
[continue reading…]

{ 3 comments }

Welker won't have any more "rare" drops in New England.

Welker won't have any more 'rare' drops in New England.

The craziness continues, with Wes Welker signing with the Denver Broncos being the big story of day two of the league year. The Patriots responded by signing Danny Amendola, the least surprising move since Brandon Lloyd joined Josh McDaniels in New England last year. Arguably the biggest move so far this week has been Mike Wallace joining Dolphins, while Greg Jennings still seems likely to move on from Green Bay. Throw in Percy Harvin to Seattle and Anquan Boldin to San Francisco, and we’re seeing a lot of movement among the top receivers this year. Which gives me an opportunity to do a quick data dump on the best receivers to ever switch teams.

In some ways, it’s hard to find a comparable receiver to Welker. He’s been so productive for so long that it’s easy to be unimpressed with the 118 catches, 1,354 yards, and six touchdowns he had last year, but no receiver had ever switched teams after catching more than 101 catches in a season. Only two receivers — Muhsin Muhammad and Yancey Thigpen — gained more receiving yards in a season than Welker did in 2012 and then played for a new team the next year.

But Welker’s amazingly unique numbers are a product of playing in a very pass-friendly environment on a team that threw 641 passes last year. To compare players across systems and eras, I came up with a wide receiver ranking system last month. That will allow us to look at the best receivers to switch teams and not just the ones from the last couple of decades. For some perspective, Welker ranked 8th among wide receivers last season, although that’s without any Tom Brady-adjustment.

The table below contains a lot of information. It shows receivers who added over 200 yards of value over average in Year N and then played for a new team in Year N+1. For each player, I’ve listed his old team, his age in Year N, some traditional statistics, the amount of value added by the receiver, and his rank among wide receivers. Then starting in the “N+1 tm” category, we see his new team, his statistics in the new season, how much value he added in Year N+1 and his rank in that season.
[continue reading…]

{ 9 comments }

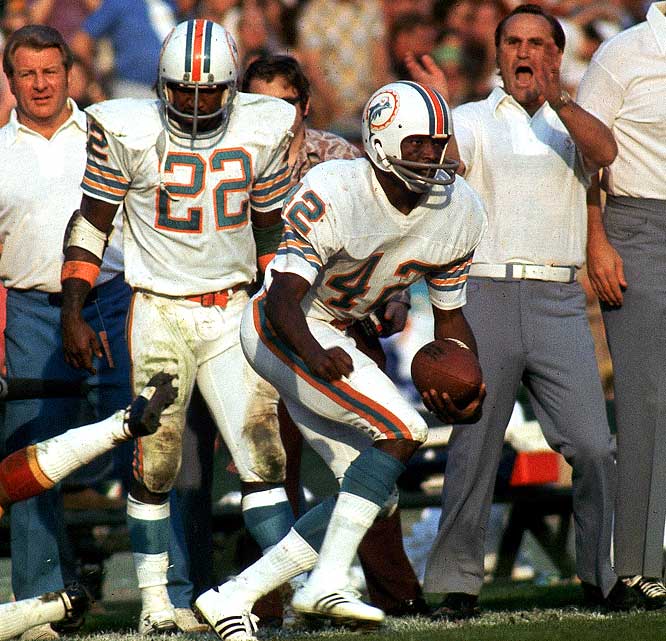
Examining Paul Warfield’s career

Warfield played for Woody Hayes, Paul Brown, Don Shula, and John McVay

Warfield played for Woody Hayes, Don Shula, and John McVay.

Paul Warfield has been confounding stat heads for years. Warfield was a rare first-ballot Hall of Fame wide receiver and one of the most athletic and talented wide receivers in history. However, his statistics look downright unimpressive to the modern eye. That’s not too surprising, though, since he played the prime of his career in football’s deadball era for one of its best teams.

I was pretty happy when I noticed that Warfield ranked 16th in my wide receiver ranking project last month; that’s much higher than most (all?) stats-based ranking systems place him, although some would argue that it would still underrate him.

One way to understand Warfield’s statistics is to see just how infrequently his teams passed. The table below shows some of the top wide receivers in football history to enter the league since 1960, including some Warfield contemporaries like Gary Garrison, Fred Biletnikoff, Harold Carmichael, and Gene A. Washington. While career numbers are interesting, you can often learn more by just looking at a player’s best seasons.

The table below shows the top 7 seasons for each wide receiver (based on the formula from this post) and how many pass attempts per game his team attempted during those seasons:
[continue reading…]

{ 12 comments }

Don Hutson and Curly Lambeau

Don Hutson is down with era adjustments.

I’ve written several posts about how to grade wide receivers and did a three-part series on one ranking system two weeks ago. Grading wide receivers requires one to adjust for era, but there are many different ways to do that.

Calvin Johnson caught 122 passes last year for 1,964 yards and five touchdowns. In 1973, Harold Carmichael had 67 receptions, 1,116 yards and nine scores. Which season was better? You might be inclined to think Johnson’s season was much better regardless of era, but both receivers led their respective leagues in both receptions and receiving yards. But let’s think about it another way.

In 1973, all the players on the 26 teams in the NFL combined for a total of 4,603 catches and 58,009 receiving yards. That means Carmichael was responsible for 1.46% of all receptions and 1.92% of all receiving yards. Of course, with only 26 teams, we need to multiply those numbers by 26/32 make for an apples-to-apples comparison of the modern environment. If we want to transport Carmichael into 2012, that means he needs to be credited with 1.18% of all receptions and 1.56% of all receiving yards accumulated last year. That would give him 128 catches and 1,970 receiving yards, and thanks to recording 1.93% of all receiving touchdowns in 2012, 14.6 touchdowns.

This analysis is actually unfair to active players, as there are more three-, four-, and five-wide receiver sets than ever before. Elroy Hirsch gained 1,495 receiving yards in 12 games — an outstanding rate of production in any era — but that translates to an absurd 2,667 receiving yards in 2012. In Don Hutson’s magical 1942 season, after multiplying by 10/32, he gained 2.3% of the league’s receptions, 2.8% of the receiving yards, and 4.9% of the touchdowns — for a 254/3501/37 stat line.
[continue reading…]

{ 6 comments }

Smith kept a low profile during his playing days.

Smith kept a low profile during his playing days.

Jacksonville’s Jimmy Smith was first eligible for the Hall of Fame in 2011. He was cut early in the process, failing to be one of the 26 semifinalists selected. A year later, he again failed to make the cut to 26, and was shut out at the same stage a few months ago, too.

To the extent that the Hall of Fame is supposed to mirror the consensus view, Smith’s absence from Canton is justified. But that’s only because he’s tragically underrated. If you take a normative view of how the Hall of Fame should operate, then the lack of traction Smith’s case has made is downright appalling.

No wide receiver of his caliber has ever been so overlooked. Even Art Monk was a finalist for the HOF every single year he was eligible until being inducted in 2008. Ditto Cris Carter, who was a finalist the first five years he was eligible before being selected for the Class of 2013. Tim Brown has been a finalist each of the first four years in which he’s been eligible. Smith, on the other hand, appears to have fallen through Canton’s cracks.

When I came up with my era-adjusted career rankings, Smith came in as the 12th best wide receiver in history. The issue with Smith has never been production but perception. Let’s go through the reasons Smith’s been overlooked.
[continue reading…]

{ 39 comments }

On Monday, I explained my methodology for ranking every wide receiver in football history, and yesterday, I presented a list of the best single seasons of all time. Today the career list of the top 150 wide receivers. As usual, I implemented a 100/95/90 formula, giving a player credit for 100% of his production in his best season, 95% of his value in his second-best season, 90% in his third year, and so on. The table below is fully sortable and lists the first and last year each person played wide receiver [1]Note that I have excluded seasons where a wide receiver played running back or tight end. This is generally not a big deal, but does hurt someone like Lenny Moore.; you can use the search feature to find the best receiver to ever play for each team (for example, typing ‘ram’ for the Rams ‘clt’ for the Colts.)
[continue reading…]

References

References
1 Note that I have excluded seasons where a wide receiver played running back or tight end. This is generally not a big deal, but does hurt someone like Lenny Moore.
{ 55 comments }

Yesterday, I explained my methodology for ranking every wide receiver in football history. Today I’m going to present a list of single-season leaders, which presents some problems.

I think the method I described yesterday does a good job adjusting for era, as receivers are only given credit for their yards above the baseline, which is different each season. But there are some other complicating factors unique to football. Seasons have had varying lengths: a receiver who plays 12 games in a 12-game season can’t be penalized the way you would penalize a receiver who only plays in 12 games now. Since older receivers are generally at a disadvantage for many reasons, I decided to simply pro-rate the value for all non-16 game seasons as if it was a 16-game season. However, I have also included downward adjustments for players in other leagues and during World War II. [1]The fine print: For players in 1943, 1944, and 1945, and for players in the AAFC, I only gave the receivers credit for 60% of the value they created. For the AFL, I gave players 60% of their value in … Continue reading

The table below lists the top 200 wide receiver seasons of all-time.
[continue reading…]

References

References
1 The fine print: For players in 1943, 1944, and 1945, and for players in the AAFC, I only gave the receivers credit for 60% of the value they created. For the AFL, I gave players 60% of their value in 1960 and 1961, 70% in 1962, 80% in 1963, 90% in 1964, and 100% in 1965 through 1969. In case it wasn’t obvious, all of these adjustments are arbitrary.
{ 12 comments }

We know how this story will end.

We know how this story will end.

Regular readers know that one of my projects this off-season is to come up with a better way to grade wide receivers. I first attempted to rank every wide receiver four years ago. That study, which I will reproduce this week, has some positives and negatives. My goal is to eventually come up with four or five different ranking systems, so consider the series this week to be the first of several ranking systems to come.

The first step in this system is to combine the three main stats — receptions, receiving yards and receiving touchdowns — into one stat: Adjusted Catch Yards. We know that a passing touchdown is worth about 20 yards, so I’m crediting a receiver with 20 yards for every touchdown reception. Next, we need to decide on an appropriate bonus for each reception.

We want to give receivers credit for receptions because, all else being equal, a receiver with more receptions is providing more value because he’s likely generating more first downs. I looked at all receivers over a 12-year period who picked up at least 30 receiving first downs. I then used the number of receptions and receiving yards those players had as inputs, and performed a regression to estimate how many first downs should be expected. The best-fit formula was:
[continue reading…]

{ 6 comments }

The predictive value of target data, part II

On Monday, I argued that target data has some predictive value. I wanted to update that post with a few observations.

Wide Receiver Targets

In the original post, I looked at year-to-year data for all players with at least 500 receiving yards in Year N and at least 8 games played for the same team in Years N and N+1. But it makes more sense to limit the sample to only wide receivers if we want to predict how wide receivers project in the next season.

There are 554 pairs of wide receiver seasons that meet the above criteria. [1]I have again pro-rated all seasons to sixteen games. The best fit formula to project future receptions based on prior receptions and prior targets is:

Year N+1 Receptions = 14.0 + 0.547 * Yr_N_Rec + 0.124 * Yr_N_Tar

The R^2 is 0.39, and while the receptions variable is statistically significant by any measure, the targets variable just barely qualifies (p = 0.044) as such. Still, this tells us that for every 8 additional targets a receiver sees in Year N, we can expect one more reception in Year N+1, holding his number of receptions equal.

If we want to project receiving yards instead of receptions, we get:

Year N+1 Receiving Yards = 180.3 + 0.434 * Yr_N_RecYd + 2.55 * Yr_N_Tar

The R^2 is 0.33, implying a slightly less strong relationships, which makes sense: yards are more variable to large outliers than receptions, so you would expect receiving yards to be slightly harder to predict. Another interesting note: the targets variable here is statistically significant at the p = 0.0003 level, and as expected, the receiving yards variable is statistically significant at all levels. Holding receiving yards equal, a receiver would need an additional 19 targets to increase his projected number of receiving yards by 50, so the practical effect may not be all that large.

Addressing the multicollinearity problem
[continue reading…]

References

References
1 I have again pro-rated all seasons to sixteen games.
{ 2 comments }

Analyzing the leaders in targets in 2012

Reggie Wayne led the NFL in targets last year, but that’s a little misleading since the Colts ranked 6th in pass attempts. As a percentage of team targets, Wayne ranked second in the league, but he was a distant number two to Brandon Marshall, who saw two out of every five Bears passes in 2013.

But that doesn’t make him the best receiver. It was easier for Marshall to receive a high number of targets because the rest of the Chicago supporting cast was weak, so Jay Cutler consistently looked Marshall’s way. Chicago ranked 25th last year in Adjusted Net Yards per Attempt, so essentially we have a player on a bad passing offense receiving a ton of targets. It’s not all that obvious how you compare a player like that to Roddy White, who deserves credit for being in a great passing offense but loses targets because of the presence of Julio Jones and Tony Gonzalez (of course, without them, would Matt Ryan start looking like Jay Cutler?)

I identified the leader in targets for each team, and then calculated the percentage of team targets each leading receiver had in 2012. The table below lists that percentage on the Y-Axis; the X-Axis represents the number of ANY/A that player’s team averaged. Someone like Marshall (represented by the first four letters of his last name and the first two letters of his first name, MarsBr) will therefore be high and to the left, while Randall Cobb is low and to the right:

2012 targets
[continue reading…]

{ 16 comments }

The predictive value of target data

Demaryius Thomas made the most of his targets in 2012.

Demaryius Thomas made the most of his targets in 2012.

In 2007, Doug Drinen and I wrote a pair of articles discussing our views on targets. I’m working on a wide receiver project this off-season, and a complete discussion of receiving statistics includes a discussion of targets.

Let me start with the prevailing few: targets are important, and if two receivers have the same production on a different number of targets, the one who produced on fewer targets is better/more valuable. Similarly, if all else is equal, the receiver with a higher catch rate — calculated as catches/target — is the better/more valuable one.

There are some problems with the prevailing view. By placing targets in the denominator of a formula, we’re implying that targets are a bad thing, or at a minimum, an opportunity wasted. But targets aren’t like pass attempts. Pro Football Focus has a stat called yards per pass route run, and that actually is the receiver version of yards per pass attempt. [1]Unfortunately, yards per pass route run is not going to help us if we want to grade receivers on a historical basis.

But targets don’t help identify the player who deserves blame: on a random incomplete pass, assume three receivers are running routes, and one of them is targeted. Absent a drop, I have a hard time saying that of the three wide receivers, the targeted one did the worst of the three. If we grade a receiver by his yards per route run, each receiver is equally penalized with one route run on the play; if we grade a receiver by yards per target, the two wide receivers that did not get open are not penalized, while the one that was targeted is penalized. That seems fundamentally wrong to me.

Here’s another problem: In a broad sense, the player with more targets (or percentage of his team’s targets) is in a very real sense a bigger part of his team’s offense. Either he’s open more often, or the quarterback is throwing in his direction even when he’s not open (whether because the coaches call more plays for him or because he’s earned the quarterback’s trust). In any event, the target itself is an indicator of quality, and penalizing a player — which is what you do when you place targets in the denominator — for an event that is highly correlated with quality is not something I’m comfortable doing.
[continue reading…]

References

References
1 Unfortunately, yards per pass route run is not going to help us if we want to grade receivers on a historical basis.
{ 12 comments }

The off-season is here.

But Football Perspective isn’t going anywhere. I prefer off-season writing to in-season writing, as football theory and history is more compelling to me than figuring out whether to rank the Lions ahead of the Bills. At the old Pro-Football-Reference Blog, we did some of our best work in the off-season, and I hope for the same results here.

Evan Silva just published a great piece detailing what each team needs in the off-season, but you’re not going to find that type of article here in the off-season. I will have some draft articles, but I don’t intend on staying topical all that often. My first big off-season project is to come up with a wide receiver ranking system.

I won’t bore you with all the details yet, but I think grading wide receivers (or for that matter, receiving tight ends) is much, much more complicated than people realize. I hope you guys are excited to participate the discussion, as I am in the early stages of this project and will go where the research takes me. One possible result I envision: the ultimate wide receiver ranking system does not exist, but a series of four or five ranking systems might give us the complete picture of a wide receiver.

Let me start with a question: which team had a better passing offense last year, Houston or Detroit? For now, try to ignore what we saw out of Matt Schaub in the post-season and just focus on the regular season results.
[continue reading…]

{ 34 comments }

I was planning on ignoring the latest Randy Moss news, using that word liberally as it applies to things said on media day. In case you missed it, Moss said yesterday that he believes he is the greatest receiver of all time. Moss is an obvious future Hall of Famer, but Jason Lisk gave Moss’ comments the appropriate treatment yesterday.

Today, though, Moss upped the ante by noting that “Jerry Rice had two Hall of Fame QBs his whole career. Give me that and see where my numbers are.” Yes, Rice was fortunate to play with Joe Montana and Steve Young, , but there is a pretty simple response to that. I wrote that response when Rice was a finalist for the Hall of Fame three years ago. You can read the full HOF profile I wrote on Rice, but I’ve reprinted Part III below:
[continue reading…]

{ 19 comments }

Even the mighty Lions couldn't stop Quan.

Yes, that's a picture of the Lions in a Super Bowl post.

Anquan Boldin is back in the Super Bowl. Four years ago, Boldin and the Cardinals lost to the Pittsburgh Steelers in Super Bowl XLIII. That season, Boldin was one of the game’s best wide receivers, catching 89 passes for 1,038 yards and scoring 11 touchdowns in just 12 games. His production was slightly less impressive in 2012 — 65/921/4 in 15 games — but he was still a valuable member of the Ravens offense.

He signed with Baltimore in the 2010 offseason, and after a few heartbreaking post-seasons, Boldin and the Ravens are back in the Super Bowl. Since he was one of the team’s starting receivers this year, that makes him the 7th wide receiver to start for two different teams that reached a Super Bowl.

How many of the first six can you name (either with or without any hints)? For each receiver, the one hint shows the two Super Bowl franchises. Let us know how you did in the comments: as always, the honor system will be strictly enforced.

Trivia hint for WR1 Show


Click 'Show' for the Answer for WR1 Show

Trivia hint for WR2 Show


Click 'Show' for the Answer for WR2 Show

Trivia hint for WR3 Show


Click 'Show' for the Answer for WR3 Show

Trivia hint for WR4 Show


Click 'Show' for the Answer for WR4 Show

Trivia hint for WR5 Show


Click 'Show' for the Answer for WR5 Show

Trivia hint for WR6 Show


Click 'Show' for the Answer for WR6 Show

{ 14 comments }

Moss makes turkeys out of the Cowboys

Moss was very good when his teams won.

Last weekend, I looked at career rushing stats in wins and losses, and yesterday, I did the same for quarterbacks. Today we will check out the splits for receivers.

I looked at all games, including playoffs, from 1960 to 2011, for all players with at least 4,000 receiving yards over that time period. The table below lists the following information for each player:

– His first year (or 1960, if he played before 1960) and his last year (or 2011, if still active)
– All the franchises he played for (which you can search for in the search box)
– His number of career wins, and his career receptions, receiving yards, yards per reception, and receiving yards per game in wins
– His number of career losses, and his career receptions, receiving yards, yards per reception, and receiving yards per game in losses

You might be surprised to see Andre Johnson at the top of the list, but his career average should decline the longer he plays; that said, 2012 didn’t drop his numbers. On the flip side, Calvin Johnson moves up into the #2 slot; part of that was due to a great season (although Detroit didn’t get many wins) and part of that was due to Randy Moss slipping. Larry Fitzgerald comes up high on the list for the same reason as both Johnsons, although it’s often easy to forget how great Fitzgerald can be thanks to his current situation.

The table is sorted by receiving yards per game in wins:

RkPlayerYearsTeamsPosWinRec_WYd_WYPR_WY/G_WLossRec_LYd_LYPR_LY/G_L
1Andre Johnson2003--2011htxWR52325473914.5891.172394511812.9971.1
2Randy Moss1998--2010min-rai-nwe-otiWR114597996016.6887.493404576314.2662
3Michael Irvin1988--1999dalWR106560913316.3186.262277408614.7565.9
4Larry Fitzgerald2004--2011crdWR59352502114.2685.171383529913.8474.6
5Calvin Johnson2007--2011detWR23113192917.0783.954265415415.6876.9
6Lance Alworth1962--1972sdg-dalFL-WR83360687219.0982.842172309417.9973.7
7Jerry Rice1985--2004sfo-rai-seaWR20710991690915.3981.7118598817313.6769.3
8Art Powell1960--1968nyj-rai-buf-minSE-WR51244416017.0581.645215347716.1777.3
9Jimmy Smith1995--2005jaxWR96512782915.2981.680390510513.0963.8
10Torry Holt1999--2009ram-jaxWR93486741615.2679.789481659613.7174.1
11Charley Hennigan1960--1966otiWR44209350116.7579.640201321315.9980.3
12Steve Smith2001--2011carWR75390589815.1278.684356516214.561.5
13Del Shofner1960--1967ram-nygE41165321319.4778.43186122414.2339.5
14Dwayne Bowe2007--2011kanWR25118194816.5177.949238297912.5260.8
15Don Maynard1960--1973nyj-crdWR-HB79298615020.6477.876305509116.6967
16Terrell Owens1996--2010sfo-phi-dal-buf-cinWR1316551012715.4677.395477655813.7569
17Marvin Harrison1996--2008cltWR125723964913.3577.281444581413.0971.8
18Sterling Sharpe1988--1994gnbWR52292393713.4875.762314442614.171.4
19DeSean Jackson2008--2011phiWR39149293419.6975.22593136414.6754.6
20Wesley Walker1977--1989nyjWR73272548520.1775.171185319517.2745
21Herman Moore1991--2001detWR63314471215.0174.877383493612.8964.1
22Charlie Brown1982--1987was-atlWR42177313417.7174.62171101414.2848.3
23Sonny Randle1960--1968crd-sfo-dalE-WR45178333018.717445155218714.1148.6
24Greg Jennings2006--2011gnbWR61279449316.173.734151224314.8566
25Reggie Wayne2001--2011cltWR122639893813.9973.363306389812.7461.9
26John Jefferson1978--1985sdg-gnb-cleWR54238395316.6173.244131209115.9647.5
27Terry Glenn1996--2007nwe-gnb-dalWR793795686157261246357414.5358.6
28Darnay Scott1994--2002cin-dalWR40171285216.6871.377237334114.143.4
29Buddy Dial1960--1966pit-dalSE-FL35112249422.2771.331110205018.6466.1
30Isaac Bruce1994--2009ram-sfoWR114529811915.3571.2110539784814.5671.3
31Gary Clark1985--1995was-crd-miaWR107484760915.7271.166273407314.9261.7
32Carl Pickens1992--2000cin-otiWR39212274612.9570.484328438313.3652.2
33Homer Jones1964--1970nyg-cleSE-WR3291224024.627047131257319.6454.7
34Marques Colston2006--2011norWR61313426013.6169.832181260814.4181.5
35Cris Carter1987--2002phi-min-miaWR132701918513.169.6101463558412.0655.3
36Al Toon1985--1992nyjWR48251333613.2969.558287355112.3761.2
37Anquan Boldin2003--2011crd-ravWR65332448213.56967405518812.8177.4
38Pete Retzlaff1960--1966phiWR-TE42155288918.6468.842181280715.5166.8
39Chad Ochocinco2001--2011cin-nweWR74350508414.5368.789419604914.4468
40Steve Largent1976--1989seaWR99419679716.2268.7106423672615.963.5
41Raymond Berry1960--1967cltE57263391114.8768.632149197813.2861.8
42Gary Garrison1966--1977sdg-otiWR-SE55192376419.668.463201355717.756.5
43Darrell Jackson2000--2008sea-sfo-denWR61282414714.716863258348813.5255.4
44Mike Quick1982--1990phiWR39142264518.6367.857216366416.9664.3
45James Lofton1978--1993gnb-rai-buf-ram-phiWR109395738718.767.8115402725418.0463.1
46Rob Moore1990--1999nyj-crdWR59269399814.8667.894374557214.959.3
47Fred Barnett1990--1997phi-miaWR59243397716.3767.438136166812.2643.9
48Kellen Winslow1979--1987sdgTE58320390812.2167.455249321312.958.4
49George Sauer1965--1970nyjSE-WR45172301917.5567.130137197714.4365.9
50Joe Horn1996--2007kan-nor-atlWR71319473914.8666.777285405514.2352.7
51Otis Taylor1965--1974kanWR-FL75265498518.8166.541146232315.9156.7
52Mark Duper1983--1992miaWR88324583918.0266.455219362516.5565.9
53Bob Hayes1965--1975dal-sfoSE-WR87268567921.1965.341126212816.8951.9
54Steve Watson1979--1987denWR63223411218.4465.339147231415.7459.3
55Roddy White2005--2011atlWR62296403213.626553256353513.8166.7
56Rod Smith1995--2006denWR121575786513.686564323438413.5768.5
57Flipper Anderson1988--1995ram-cltWR3499220422.2664.858175332318.9957.3
58Eddie Brown1985--1991cinWR53175343119.6164.751197280214.2254.9
59Wes Welker2004--2011sdg-mia-nweWR86509555410.9164.645194211010.8846.9
60Derrick Alexander1994--2002cle-rav-kan-minWR48167309218.5164.469251390915.5756.7
61Andre Reed1985--2000buf-wasWR134599862114.3964.3106437580613.2954.8
62Antonio Gates2003--2011sdgTE80375512413.6664.153257310812.0958.6
63Wes Chandler1978--1988nor-sdg-sfoWR61234389416.6463.884348541915.5764.5
64Anthony Miller1988--1997sdg-den-dalWR71272451216.5963.582332477314.3858.2
65Al Denson1964--1971den-minWR-TE2589158117.7663.24916326081653.2
66Antonio Freeman1995--2003gnb-phiWR95375597815.9462.941155209613.5251.1
67Lee Evans2004--2011buf-ravWR51174320318.4162.867211287413.6242.9
68Plaxico Burress2000--2011pit-nyg-nyjWR95385592315.3862.357202296914.752.1
69Santana Moss2001--2011nyj-wasWR74285460616.1662.288387496312.8256.4
70Brandon Marshall2006--2011den-miaWR43214267612.562.248280357112.7574.4
71Keyshawn Johnson1996--2006nyj-tam-dal-carWR92447569112.7361.982406544913.4266.5
72Joey Galloway1995--2010sea-dal-tam-nwe-wasWR85321520516.2161.2107393590415.0255.2
73Muhsin Muhammad1996--2009car-chiWR105477640713.436196413558913.5358.2
74Henry Ellard1983--1998ram-was-nweWR99343604017.6161125492807916.4264.6
75Tommy McDonald1960--1968phi-dal-ram-atl-cleWR-HB49166297917.9560.861222349315.7357.3
76Anthony Carter1985--1995min-detWR80293485316.5660.762233353515.1757
77Art Monk1980--1995was-nyj-phiWR142631860913.6460.695378517413.6954.5
78Red Phillips1960--1967ram-minE2494145515.4860.653214314714.7159.4
79Roger Carr1974--1983clt-sea-sdgWR40110242522.0560.660163268116.4544.7
80Paul Flatley1963--1970min-atlWR-FL34117206117.6260.655179274215.3249.9
81David Boston1999--2005crd-sdg-miaWR27109162614.9260.247206307314.9265.4
82Ernest Givins1986--1995oti-jaxWR75320451614.1160.280311447314.3855.9
83Dwight Clark1979--1987sfoWR81343487214.260.146216264812.2657.6
84Santonio Holmes2006--2011pit-nyjWR57211342516.2360.138152221214.5558.2
85Paul Warfield1964--1977cle-miaWR-SE115340689220.2759.947132249718.9253.1
86Laveranues Coles2000--2009nyj-was-cinWR71323425313.1759.981378463812.2757.3
87Jimmy Orr1960--1970pit-cltWR73219437219.9659.938119211917.8155.8
88Elbert Dubenion1960--1967bufWR-HB53159317219.9559.842127207516.3449.4
89Ken Burrough1970--1981nor-otiWR67222397717.9159.480204323015.8340.4
90Stephone Paige1983--1991kanWR57180336118.675963203308915.2249
91Todd Christensen1980--1988raiTE-FB66306388812.7158.941186234212.5957.1
92Louis Lipps1984--1992pit-norWR48169282716.7358.963204337616.5553.6
93Jeff Graham1991--2001pit-chi-nyj-phi-sdgWR57222334515.0758.785335506415.1259.6
94Harold Jackson1969--1983phi-ram-nwe-min-seaWR-FL100296586419.8158.684292483516.5657.6
95Tim Brown1988--2004rai-tamWR135562790714.0758.6127577760813.1959.9
96Tony Martin1990--2001mia-sdg-atlWR103369603116.3458.676267373213.9849.1
97John Stallworth1974--1987pitWR103361602316.6858.558230368716.0363.6
98Eric Martin1985--1994nor-kanWR85315496915.7758.568253339613.4249.9
99Stanley Morgan1977--1990nwe-cltWR99298578719.4258.586278525018.8861
100Alfred Jenkins1975--1983atlWR50170290317.0858.160196357118.2259.5
101Jason Witten2003--2011dalTE77381445711.757.967343374510.9255.9
102Kellen Winslow Jr.2004--2011cle-tamTE34153196712.8657.958284286910.149.5
103Braylon Edwards2005--2011cle-nyj-sfoWR48172275916.0457.557184288415.6750.6
104Cris Collinsworth1981--1988cinWR60216344615.9557.448222360616.2475.1
105Gene A. Washington1969--1979sfo-detWR-SE60178344519.3557.469210353516.8351.2
106John Gilliam1967--1977nor-crd-min-atlWR-FL69206394719.1657.270176301717.1443.1
107Chris Burford1960--1967kanSE-WR52205297114.4957.138157229214.660.3
108Max McGee1960--1967gnbE57177324418.3356.91956106719.0556.2
109Charlie Joiner1969--1986oti-cin-sdgWR114404647616.0356.8114375613216.3553.8
110Tony Hill1977--1986dalWR97335550816.4456.846190309816.3167.3
111Bernie Casey1961--1968sfo-ramFB-WR45162254715.7256.644160233114.5753
112Charley Taylor1964--1977wasWR-RB87341491814.4256.570297407113.7158.2
113Javon Walker2002--2009gnb-den-raiWR45157253716.1656.438123176014.3146.3
114Jerry Butler1979--1986bufWR38139213915.3956.347146228515.6548.6
115Carlos Carson1980--1989kan-phiWR50147280919.1156.263203344416.9754.7
116Webster Slaughter1986--1998cle-oti-kan-nyj-sdgWR76276426515.4556.184314424313.5150.5
117Hines Ward1998--2011pitWR145684812911.8856.183393499612.7160.2
118Gail Cogdill1960--1970det-atlSE-WR54172302317.585653164243114.8245.9
119Johnny Morris1960--1967chiFL-HB51189284715.0655.837141179412.7248.5
120Chris Chambers2001--2010mia-sdg-kanWR74273412715.1255.876291392813.551.7
121Cliff Branch1972--1984raiWR129401718417.9255.749170273916.1155.9
122Andre Rison1989--2000clt-atl-cle-jax-gnb-kan-raiWR92361512014.1855.792411550013.3859.8
123Reggie Rucker1970--1981dal-nyg-nwe-cleWR70235389016.5555.679215323415.0440.9
124Eddie Kennison1996--2007ram-nor-chi-den-kanWR75245416316.9955.5102306423213.8341.5
125Antonio Bryant2002--2009dal-cle-sfo-tamWR40148221714.9855.464225347215.4354.3
126Donald Driver1999--2011gnbWR115471636813.5255.476313436713.9557.5
127Marty Booker1999--2009chi-mia-atlWR57242315313.0355.385299356811.9342
128Yancey Thigpen1992--2000pit-otiWR67227370116.355.233121180014.8854.5
129Tony Gonzalez1997--2011kan-atlTE122562672311.9655.1116603677211.2358.4
130Vance Johnson1985--1995denWR70269385614.3355.151183252013.7749.4
131Curtis Conway1993--2004chi-sdg-nyj-sfoWR61232335914.4855.197369495213.4251.1
132Roy Jefferson1965--1976pit-clt-wasWR-SE78251426516.9954.772217349416.148.5
133Fred Biletnikoff1965--1978raiWR-FL136475742415.6354.646148213714.4446.5
134Lionel Taylor1960--1968den-otiWR31136169112.4354.571405515312.7272.6
135Vincent Jackson2005--2011sdgWR63194342917.6854.433107182817.0855.4
136Jim Colclough1960--1968nweE49148266618.0154.445112187416.7341.6
137Carroll Dale1960--1973ram-gnb-minWR-TE91245494920.254.473211366017.3550.1
138Dave Parks1964--1973sfo-nor-otiWR-TE31107168115.7154.267215342415.9351.1
139Shannon Sharpe1990--2003den-ravTE131534710013.354.26934337741154.7
140Ben Hawkins1966--1973phiWR2875151720.2354.257171294517.2251.7
141Eric Moulds1996--2007buf-htx-otiWR89344480313.9654100435551212.6755.1
142Isaac Curtis1973--1984cinWR79226426318.865475203302214.8940.3
143Brian Blades1988--1998seaWR66268355613.2753.978318414213.0353.1
144Lynn Swann1974--1982pitWR94302505416.7453.83280130016.2540.6
145Deion Branch2002--2011nwe-seaWR94367504813.7553.751197238312.146.7
146Sammy White1976--1985minWR68211364617.2853.661188289315.3947.4
147Kevin House1980--1987tam-ramWR3089160818.0753.670218369316.9452.8
148Haywood Jeffires1987--1996oti-norWR65272348312.8153.668304336411.0749.5
149Roy Green1979--1992crd-phiWR76239406617.0153.5104318482615.1846.4
150Ahmad Rashad1972--1982crd-buf-minWR71271376913.9153.167236329513.9649.2
151Amani Toomer1996--2008nygWR110403583114.475389307423213.7947.6
152Bobby Mitchell1960--1968cle-wasWR-HB52175275015.7152.962263419215.9467.6
153Bill Brooks1986--1996clt-buf-wasWR74278391014.0652.885332440313.2651.8
154Harold Carmichael1971--1984phi-dalWR-TE82279430615.4352.599333500115.0250.5
155Drew Pearson1973--1983dalWR121391635016.2452.550165257715.6251.5
156Lance Rentzel1965--1974min-dal-ramWR-FL66180345819.2152.44294154416.4336.8
157Irving Fryar1984--2000nwe-mia-phi-wasWR119398623015.6552.4135477684514.3550.7
158Bert Emanuel1994--2001atl-tam-mia-nwe-detWR44158230014.5652.352202268313.2851.6
159Keenan McCardell1992--2007cle-jax-tam-sdg-wasWR123495642812.9952.387443556712.5764
160Aaron Thomas1961--1970sfo-nygTE-SE3587182821.0152.255170266515.6848.5
161Mark Clayton1983--1993mia-gnbWR102336530315.785265278417815.0364.3
162Jake Reed1992--2002min-norWR72251374214.915262225366616.2959.1
163Roy E. Williams2004--2011det-dal-chiWR46161238814.8351.966237338614.2951.3
164Henry Marshall1976--1987kanWR58188298215.8651.484234363515.5343.3
165John Taylor1987--1995sfoWR94302482515.9851.33591150716.5643.1
166Ricky Sanders1986--1995was-atlWR80286410514.3551.357228288912.6750.7
167Alvin Harper1991--1997dal-tam-wasWR56139287120.6551.32976125716.5443.3
168Frank Clarke1960--1967dalE37112188716.855151149295919.8658
169Marcus Robinson1998--2006chi-rav-minWR47160239414.9650.955172244114.1944.4
170T.J. Houshmandzadeh2001--2011cin-sea-rav-raiWR57253289311.4350.881370428611.5852.9
171Drew Hill1979--1993ram-oti-atlWR103334522015.6350.7105339515215.249.1
172Michael Jackson1991--1998cle-ravWR39127196915.550.562234355615.257.4
173Willie Davis1992--1998kan-otiWR61183307316.7950.444119166914.0337.9
174Boyd Dowler1960--1971gnb-wasFL-SE102324511215.7850.140119160013.4540
175Derrick Mason1997--2011oti-rav-nyj-htxWR141542705313.015097450560912.4657.8
176Johnnie Morton1994--2005det-kan-sfoWR75267374614.0349.997368509213.8452.5
177Mark Carrier1987--1998tam-cle-carWR64212318815.0449.8102366566815.4955.6
178Danny Abramowicz1967--1974nor-sfoE3097149415.449.874255388415.2352.5
179Wayne Chrebet1995--2005nyjWR69263343513.0649.881336419912.551.8
180Dave Kocourek1960--1968sdg-mia-raiTE-FL55157272717.3749.63798150915.440.8
181Ed McCaffrey1991--2003nyg-sfo-denWR106380521213.7249.258227276412.1847.7
182Michael Westbrook1995--2002was-cinWR39135191414.1849.142144236116.456.2
183Lionel Manuel1984--1990nygWR50143244417.0948.933103174016.8952.7
184Gary Collins1962--1971cleWR80240387716.1548.54295149715.7635.6
185Robert Brooks1992--2000gnb-denWR67226324414.3548.436128168313.1546.8
186Frank Sanders1995--2003crd-ravWR48178232313.0548.480336452813.4856.6
187Jerry Porter2000--2008rai-jaxWR38116183915.8548.462197257313.0641.5
188Mel Gray1971--1982crdWR65167311318.6447.978188354518.8645.4
189Tim McGee1986--1994cin-wasWR53145252617.4247.769183273714.9639.7
190Frank Lewis1971--1983pit-bufWR86229409817.947.758190311416.3953.7
191Bernard Berrian2004--2011chi-minWR58178276115.5147.652143182712.7835.1
192Sean Dawkins1993--2001clt-nor-sea-jaxWR54173256614.8347.578290396013.6650.8
193Willie Gault1983--1993chi-raiWR98227465320.547.558127247919.5242.7
194Dallas Clark2003--2011cltTE88358417511.6647.436133155911.7243.3
195Jessie Hester1985--1995rai-atl-clt-ramWR49133231817.4347.373241354814.7248.6
196Michael Haynes1988--1997atl-norWR52155245915.8647.381280428815.3152.9
197Haven Moses1968--1981buf-denWR-SE82199385619.384790253442517.4949.2
198Jackie Smith1963--1978crd-dalTE84226395017.484777235369615.7348
199Mark Jackson1986--1994den-nyg-cltWR74205347216.9446.953159249115.6747
200Terance Mathis1990--2002nyj-atl-pitWR86299400213.3846.5114419520612.4245.7
201Bob Chandler1971--1981buf-raiWR48145223315.446.567229305813.3545.6
202Milt Morin1966--1975cleTE56165259915.7546.446117171014.6237.2
203Reggie Langhorne1985--1993cle-cltWR63205292314.2646.459229287412.5548.7
204Pat Tilley1976--1986crdWR61189283014.9746.474280418614.9556.6
205John Mackey1963--1972clt-sdgTE89253412816.3246.43377113314.7134.3
206Michael Timpson1989--1997nwe-chi-phiWR41137190013.8746.361164215413.1335.3
207Bill Schroeder1997--2004gnb-det-tamWR50150231115.4146.247159234214.7349.8
208Chris Cooley2004--2011wasTE48187221111.8246.160252263510.4643.9
209Brett Perriman1988--1997nor-det-kan-miaWR74258339013.1445.872294352211.9848.9
210Dave Casper1974--1984rai-oti-minTE70230320213.9245.744175237713.5854
211Dave Logan1976--1984cle-denWR47133214716.1445.747133216616.2946.1
212Bobby Joe Conrad1960--1969crd-dalWR-HB62191283014.8245.655192256313.3546.6
213Koren Robinson2001--2008sea-min-gnbWR51159232514.6245.646150206313.7544.8
214Bobby Engram1996--2009chi-sea-kanWR80301364112.145.5101384458611.9445.4
215Gary Ballman1962--1973pit-phi-nyg-minWR-TE3589156517.5844.768212345116.2850.8
216Nat Moore1974--1986miaWR-RB119363531514.6444.755163231214.1842
217Duriel Harris1976--1985mia-cle-dalWR68185303716.4244.744133228417.1751.9
218Jack Snow1965--1975ramWR-SE85214377317.6344.442115197817.247.1
219Freddie Scott1974--1983clt-detWR3695159216.7644.258173276615.9947.7
220Ray Butler1980--1988clt-seaWR3490150316.744.264152254316.7339.7
221Devery Henderson2005--2011norWR64150282818.8544.247104169716.3236.1
222J.J. Stokes1995--2003sfo-jax-nweWR66238291312.2444.149141181212.8537
223Charlie Sanders1968--1977detTE60174264315.1944.150151199513.2139.9
224Kevin Johnson1999--2005cle-jax-rav-detWR38133167212.574463255306312.0148.6
225Donte Stallworth2002--2011nor-phi-nwe-cle-rav-wasWR61164265616.243.555170237213.9543.1
226Freddie Solomon1975--1985mia-sfoWR83214359516.843.363191278814.644.3
227Ben Coates1991--2000nwe-ravTE70276301910.9443.170249279411.2239.9
228Vernon Davis2006--2011sfoTE42150181112.0743.145164228413.9350.8
229Rocket Ismail1993--2001rai-car-dalWR61168261715.5842.965204286514.0444.1
230Qadry Ismail1993--2002min-mia-nor-rav-cltWR83228354415.5442.758143188013.1532.4
231O.J. McDuffie1993--2000miaWR71248300512.1242.352217267212.3151.4
232Mark Bavaro1985--1994nyg-cle-phiTE77239325413.6242.340142184512.9946.1
233James Jett1993--2001raiWR55127232218.2842.253142226915.9842.8
234Brent Jones1987--1997sfoTE113366476913.0342.233111116610.535.3
235Jeremy Shockey2002--2011nyg-nor-carTE82309345011.1742.161260291811.2247.8
236Chris Calloway1990--2000pit-nyg-atl-nweWR64170269115.834272223289112.9640.2
237David Patten1997--2008nyg-cle-nwe-was-norWR77200323616.184263144173912.0827.6
238J.T. Smith1978--1990was-kan-crdWR64211267112.6641.791323417212.9245.8
239Brandon Stokley1999--2011rav-clt-den-sea-nygWR80226329514.5841.249156200512.8540.9
240Calvin Williams1990--1996phi-ravWR58184238112.9441.141141174412.3742.5
241Nate Burleson2003--2011min-sea-detWR64210262612.54160204257612.6342.9
242Ron Jessie1971--1981det-ram-bufWR74181303116.75414396143114.9133.3
243Keith Jackson1988--1996phi-mia-gnbTE87288356012.3640.947204255712.5354.4
244Jeff Chadwick1983--1992det-sea-ramWR44103179917.4740.962191275014.444.4
245Curtis Duncan1987--1993otiWR58210236811.2840.842146184112.6143.8
246Mike Sherrard1986--1996dal-sfo-nyg-denWR62162252815.640.832104147614.1946.1
247Shawn Jefferson1991--2003sdg-nwe-atl-detWR96253391415.4740.888244339013.8938.5
248Marshall Faulk1994--2005clt-ramRB9942240229.5340.68939733728.4937.9
249Jabar Gaffney2002--2011htx-nwe-den-wasWR66199268113.4740.682269322311.9839.3
250Willie Green1991--1998det-tam-car-denWR55147223315.1940.635117184415.7652.7
251Todd Heap2001--2011rav-crdTE83273336912.3440.663250279111.1644.3
252Mike Ditka1961--1972chi-phi-dalTE80239324013.5640.554184241613.1344.7
253Torrance Small1992--2001nor-ram-clt-phi-nweWR51141205314.5640.371213262412.3237
254Peerless Price1999--2007buf-atl-dalWR54159215813.574067254324412.7748.4
255Mike Renfro1978--1987oti-dalWR53140211715.1239.960190275914.5246
256Quinn Early1988--1999sdg-nor-buf-nyjWR73203291414.3539.976278379013.6349.9
257Chris Burkett1985--1993buf-nyjWR41110163514.8639.966185277214.9842
258Ike Hilliard1997--2008nyg-tamWR79258314812.239.885312353411.3341.6
259Drew Bennett2001--2008oti-ramWR44116175215.139.853205286813.9954.1
260Jerricho Cotchery2004--2011nyj-pitWR62206246111.9539.758199276113.8747.6
261Mike Pritchard1991--1999atl-den-seaWR58172229713.3539.667263304311.5745.4
262Nate Washington2005--2011pit-otiWR55139217515.6539.545137189213.8142
263Riley Odoms1972--1983denTE83220327914.939.561176237913.5239
264Sam McCullum1974--1983min-seaWR51131200315.2939.363150212814.1933.8
265Jay Novacek1985--1995crd-dalTE84298328111.0139.152186199410.7238.3
266Ozzie Newsome1978--1990cleTE102324397712.273998365437611.9944.7
267Bob Trumpy1968--1977cinTE-WR60147233115.8638.958147210314.3136.3
268Raymond Chester1970--1981rai-cltTE80199309915.5738.763172214612.4834.1
269Travis Taylor2000--2007rav-min-rai-ramWR52153201313.1638.750172216212.5743.2
270Joe Jurevicius1998--2007nyg-tam-sea-cleWR68195262913.4838.751145183212.6335.9
271Wesley Walls1989--2003sfo-nor-car-gnbTE68206260412.6438.381253276610.9334.1
272Ricky Proehl1990--2006crd-sea-chi-ram-car-cltWR112299427914.3138.2117393496212.6342.4
273Bob Tucker1970--1980nyg-minTE56161212913.223882255318712.538.9
274Steve Jordan1982--1994minTE86255326912.823881269338112.5741.7
275Leonard Thompson1975--1986detWR-HB52116197617.033880169286816.9735.9
276Charles Johnson1994--2002pit-phi-nwe-bufWR69204261612.8237.949173228313.246.6
277Jerry Smith1965--1977wasTE-WR75206284113.7937.960190234412.3439.1
278Rich Caster1970--1981nyj-oti-nor-wasTE-WR58123219717.8637.976207338516.3544.5
279Michael Jenkins2004--2011atl-minWR52144195413.5737.654184216811.7840.1
280Alge Crumpler2001--2010atl-oti-nweTE73196274013.9837.568191216811.3531.9
281Paul Coffman1979--1987gnb-kanTE49145183812.6837.562196248912.740.1
282Courtney Hawkins1992--2000tam-pitWR55170205912.1137.470204257212.6136.7
283Russ Francis1975--1988nwe-sfoTE96277358712.9537.455151214914.2339.1
284Billy Cannon1960--1970oti-rai-kanTE-RB80174298617.1637.3318194511.6730.5
285Jimmie Giles1977--1989oti-tam-det-phiTE50122186115.2537.288232330614.2537.6
286Brian Brennan1984--1992cle-cin-sdgWR61172226713.1837.262184237812.9238.4
287Eric Green1990--1999pit-mia-rav-nyjTE55167201712.0836.757200248812.4443.6
288Troy Brown1993--2007nweWR120392439211.236.681223266811.9632.9
289Gino Cappelletti1960--1970nweFL-SE63132230517.4636.670139203714.6529.1
290Justin McCareins2001--2008oti-nyjWR61145223015.3836.653118180615.3134.1
291Rick Upchurch1975--1983denWR67151243916.1536.453117193916.5736.6
292Frank Wycheck1993--2003was-otiTE86299312910.4636.46724323109.5134.5
293Heath Miller2005--2011pitTE80239286311.9835.839138149810.8638.4
294Floyd Turner1989--1998nor-clt-ravWR46129163812.735.654167238214.2644.1
295Mark Ingram1987--1996nyg-mia-gnb-phiWR65153230115.0435.447128181514.1838.6
296Ken Dilger1995--2004clt-tamTE69192243912.735.375180181910.1124.3
297Rodney Holman1982--1995cin-detTE81210281613.4134.879173220012.7227.8
298Dennis Northcutt2000--2009cle-jax-detWR49132170212.8934.797278339012.1934.9
299Pete Holohan1981--1992sdg-ram-kan-cleTE62190214911.3134.763189199510.5631.7
300Mickey Shuler1978--1991nyj-phiTE68222235210.5934.671248284511.4740.1
301Jerome Barkum1972--1983nyjTE-WR54129185514.3834.472201299014.8841.5
302Az-Zahir Hakim1998--2006ram-det-norWR57145191713.2233.655192255813.3246.5
303Brian Westbrook2002--2010phi-sfoRB8026926589.8833.24920316057.9132.8
304Larry Centers1990--2003crd-was-buf-nweFB8434127828.1633.111950741778.2435.1
305John L. Williams1986--1995sea-pitFB8129026779.23337528722227.7429.6
306Brandon Lloyd2003--2011sfo-was-chi-den-ramWR3281104912.9532.873230373516.2451.2
307Billy Johnson1974--1988oti-atl-wasWR65159211013.2732.571176207711.829.3
308Randy McMichael2002--2011mia-ram-sdgTE53160168610.5431.888257280210.931.8
309Roger Craig1983--1993sfo-rai-minRB12743140059.2931.55319515007.6928.3
310Ricky Watters1992--2001sfo-phi-seaRB9128928519.8731.36321518158.4428.8
311Ronnie Harmon1986--1997buf-sdg-oti-chiRB-WR94283293410.3731.289350361210.3240.6
312Tiki Barber1997--2006nygRB8026724979.3531.28033828178.3335.2
313Eric Metcalf1989--2002cle-atl-sdg-crd-car-was-gnbRB-WR83238256410.7730.9102317318510.0531.2
314Jim R. Mitchell1969--1979atlTE57139175912.6530.966160237514.8436
315Keith Byars1986--1998phi-mia-nwe-nyjFB-TE11939036659.430.87927224398.9730.9
316Freddie Jones1997--2004sdg-crdTE37109113110.3830.679295310110.5139.3
317Tony Nathan1979--1987miaRB8929027059.3330.44515815369.7234.1
318Tony McGee1993--2002cin-dalTE3992117812.830.289230291112.6632.7
319Jackie Harris1990--2001gnb-tam-oti-dalTE63157188111.9829.979251265010.5633.5
320Joe Morrison1960--1972nygRB-WR66147195813.3229.779224274712.2634.8
321Charle Young1973--1985phi-ram-sfo-seaTE76190225311.8629.671241300212.4642.3
322David Hill1976--1987det-ramTE71182209111.4929.576187221111.8229.1
323Billy Joe DuPree1973--1983dalTE101213293313.77294293107911.625.7
324Antwaan Randle El2002--2010pit-wasWR88184247313.4428.166220240210.9236.4
325Kelvin Martin1987--1996dal-sea-phiWR68138183913.332774238302312.740.9
326Thurman Thomas1988--2000buf-miaRB13034634119.8626.27120217198.5124.2
327Marcus Pollard1996--2008clt-det-sea-atlTE81183211311.5526.181185240212.9829.7
328LaDainian Tomlinson2001--2011sdg-nyjRB10434126837.8725.87630822657.3529.8
329Walter Payton1975--1987chiRB11327826459.5123.48623620718.7824.1
330Herschel Walker1986--1997dal-min-phi-nygRB8421119579.2723.310631129629.5227.9
331Kevin Faulk1999--2011nweRB12532828858.823.15415412287.9722.7
332Marcus Allen1982--1997rai-kanRB14534131869.34229129927559.2130.3
333Warrick Dunn1997--2008tam-atlRB9824421418.7721.89230124548.1526.7
334Earnest Byner1984--1997cle-was-ravRB11127123998.8521.610227825849.2925.3
335Tony Galbreath1976--1987nor-min-nygRB7917514708.418.69032626678.1829.6

[continue reading…]

{ 2 comments }

Three weeks ago, I set forth the argument that perhaps Calvin Johnson was not even the most productive receiver in his own division. While Megatron racked up the numbers, I argued that you have to account for the situation. The relevant situation here is that the Lions ran an incredible 1,160 plays compared to just 999 for the Bears, and Detroit attempted 740 passes while Chicago threw only 485 times.

When one team throws 255 more passes than the other, I don’t think it’s appropriate to compare the receivers based on their raw receiving yards. One thing we could look at is yards per team attempt. The table below lists the number of team attempts for each wide receiver, his raw receiving statistics, and also his yards per attempt. The table is sorted by yards per team passing attempt. And while it is not relevant when discussing Marshall and Megatron, I have also included a Pro-rated Yards per Attempt column, which pro-rates the number of team attempts for the number of games played by the receiver (this helps Percy Harvin, of course).

RkPlayerTmGTmAttRecYdsYPRTDY/APY/A
1Brandon MarshallCHI16485118150812.8113.113.11
2Andre JohnsonHOU16554112159814.342.882.88
3Calvin JohnsonDET16740122196416.152.652.65
4Michael CrabtreeSFO164368511051392.532.53
5A.J. GreenCIN1654097135013.9112.52.5
6Vincent JacksonTAM1656672138419.282.452.45
7Demaryius ThomasDEN1658894143415.3102.442.44
8Steve SmithCAR1649073117416.142.42.4
9Roddy WhiteATL1661592135114.772.22.2
10Reggie WayneIND16628106135512.852.162.16
11Brian HartlineMIA1650474108314.612.152.15
12Wes WelkerNWE16641118135411.562.112.11
13Dez BryantDAL1665892138215122.12.1
14Steve JohnsonBUF1651179104613.262.052.05
15Victor CruzNYG1653986109212.7102.032.03
16Julio JonesATL1661579119815.2101.951.95
17Sidney RiceSEA16405507481571.851.85
18Eric DeckerDEN1658885106412.5131.811.81
19Mike WilliamsTAM165666399615.891.761.76
20Greg OlsenCAR164906984312.251.721.72
21Marques ColstonNOR1667183115413.9101.721.72
22Randall CobbGNB155588095411.981.711.82
23Golden TateSEA154054568815.371.71.81
24Dwayne BoweKAN134755980113.631.692.08
25Jeremy KerleyNYJ164935682714.821.681.68
26Cecil ShortsJAX145865597917.871.671.91
27Anquan BoldinBAL155606592114.241.641.75
28Jason WittenDAL1665811010399.431.581.58
29Lance MooreNOR156716510411661.551.65
30Davone BessMIA135046177812.811.541.9
31Malcom FloydSDG145285681414.551.541.76
32Torrey SmithBAL165604985517.481.531.53
33Tony GonzalezATL16615939301081.511.51
34Justin BlackmonJAX165866486513.551.481.48
35Jimmy GrahamNOR156718598211.691.461.56
36Mike WallacePIT155746483613.181.461.55
37Miles AustinDAL166586694314.361.431.43
38Pierre GarconWAS104424463314.441.432.29
39Josh GordonCLE165665080516.151.421.42
40Heath MillerPIT155747181611.581.421.52
41Brandon LloydNWE166417491112.341.421.42
42James JonesGNB165586478412.3141.411.41
43Percy HarvinMIN94836267710.931.42.49
44Jeremy MaclinPHI156186985712.471.391.48
45Brandon LaFellCAR144904467715.441.381.58
46Nate WashingtonTEN165404674616.241.381.38
47Antonio BrownPIT135746678711.951.371.69
48T.Y. HiltonIND156285086117.271.371.46
49Jermaine GreshamCIN165406473711.551.361.36
50Jordy NelsonGNB125584974515.271.341.78
51Larry FitzgeraldARI166087179811.241.311.31
52Santana MossWAS16442415731481.31.3
53Owen DanielsHOU155546271611.561.291.38
54Hakeem NicksNYG135395369213.131.281.58
55Brandon MyersOAK166297980610.241.281.28
56Vernon DavisSFO164364154813.451.261.26
57Chris GivensSTL155574269816.631.251.34
58Andre RobertsARI156086475911.951.251.33
59Danario AlexanderSDG105283765817.871.251.99
60Donnie AveryIND16628607811331.241.24
61Brandon GibsonSTL165575169113.551.241.24
62Rob GronkowskiNWE116415579014.4111.231.79
63Leonard HankersonWAS164423854314.331.231.23
64Danny AmendolaSTL115576366610.631.21.74
65Jermichael FinleyGNB165586166710.921.21.2
66Dennis PittaBAL16560616691171.191.19
67Denarius MooreOAK156295174114.571.181.26
68Martellus BennettNYG165395562611.451.161.16
69Kendall WrightTEN15540646269.841.161.24
70Josh MorganWAS164424851010.621.151.15

Why can't we throw it like the Lions do??

Why can't we throw it like the Lions do??


As it turns out, Calvin Johnson was neither the best Johnson nor the best receiver in his division, at least as measured by this metric. I’m not convinced or even arguing that yards/attempt is the best way to rank receivers, but I do think the statistic represents an improvement on just receiving yards. Since receiving yards are so highly correlated with attempts, some adjustment needs to be made, and I plan on providing more analysis on how to grade wide receivers this off-season.
[continue reading…]

{ 3 comments }

I’ve noted a few times this year that Calvin Johnson, in his pursuit of Jerry Rice’s single-season receiving record, has quite an advantage on his side. The Lions have attempted more passes through 13 games of any team ever, and seem likely to break the pass attempts record.

Obviously it’s easier to gain more receiving yards when your team is throwing the ball nearly every play. That’s why when I came up with my Greatest WR Ever series, I looked at receiver performance per pass attempt.

I don’t have time for a nuanced analysis of wide receiver, but let’s just look at a simple statistic: receiving yards per team pass attempt. That’s what the table below shows, along with each player’s rank in receiving yards (the far left column). Brandon Marshall has 1,342 receiving yards while the Bears have only attempted 444 passes this year (including sacks). That means he’s averaging more than three yards per team pass attempt, which is incredible. Of course, it also speaks to the lack of other weapons in Chicago.

Ryds RkPlayerTmRecRydsTDTMATTYds/AttY/A Rk
2Brandon MarshallCHI101134294443.021
7Vincent JacksonTAM56114584422.592
4Andre JohnsonHOU82120934712.573
1Calvin JohnsonDET96154656182.54
6A.J. GreenCIN791151104782.415
5Demaryius ThomasDEN74119785032.386
12Steve SmithCAR6099924252.357
9Wes WelkerNWE95111645192.158
3Reggie WayneIND94122045692.149
8Roddy WhiteATL77114055352.1310
11Victor CruzNYG76100494792.111
14Brian HartlineMIA6292514422.0912
28Michael CrabtreeSFO6676153831.9913
13Julio JonesATL6399775351.8614
22Dwayne BoweKAN5980134361.8415
10Dez BryantDAL75102895671.8116
45Sidney RiceSEA4565873651.817
26Steve JohnsonBUF6177654321.818
24Davone BessMIA6177814421.7619
19Anquan BoldinBAL5882844821.7220
35Jeremy KerleyNYJ5272824351.6721
31Mike WilliamsTAM4673674421.6722
20Cecil ShortsJAX4382475001.6523
39Greg OlsenCAR5469154251.6324
25Randall CobbGNB7177774841.6125
15Marques ColstonNOR6588985591.5926
42Percy HarvinMIN6267734291.5827
23Eric DeckerDEN6479085031.5728
29Torrey SmithBAL4375374821.5629
18Tony GonzalezATL8183175351.5530
16Jason WittenDAL9288015671.5531
27Malcom FloydSDG5477555031.5432
17Lance MooreNOR5384845591.5233
32Josh GordonCLE4273254871.534
21Miles AustinDAL5581955671.4435
30Rob GronkowskiNWE53748105191.4436
34Mike WallacePIT5972885091.4337
47Hakeem NicksNYG5065234791.3638
44Jordy NelsonGNB4665864841.3639
59Brandon LaFellCAR3457744251.3640
72Golden TateSEA3749273651.3541
40Heath MillerPIT6167975091.3342
52Jermaine GreshamCIN5563654781.3343
70Vernon DavisSFO3850653831.3244
53Owen DanielsHOU5262264711.3245
49Nate WashingtonTEN3964844991.346
33Brandon MyersOAK7072845611.347
38DeSean JacksonPHI4570025411.2948
36Jimmy GrahamNOR6471085591.2749
58Chris GivensSTL3658434641.2650
{ 13 comments }

Larry Fitzgerald, innocent bystander

In the preseason, I wrote a post showing what percentage of each receiver’s receiving yards came from each of their quarterbacks. Using that same methodology, here’s an updated look at the quarterbacks responsible for Larry Fitzgerald’s career numbers entering week 14. The second receiving yards column (and second games column) shows the percentage of Fitzgerald’s receiving yards came (and games) that came from that quarterback: [1]Note: To determine quarterback games, I gave each quarterback credit for his number of pass attempts in each game divided by the team’s total number of attempts in the game.

QBRec YdsRec YdGGYd/G
Kurt Warner457244%53.539%85.5
John Skelton125812%15.611%80.6
Josh McCown121512%19.715%61.6
Kevin Kolb100810%12.99%78.4
Matt Leinart99810%14.110%70.6
Derek Anderson6096%9.57%64.2
Max Hall1521%2.12%71.7
Shaun King1121%1.81%61.4
Richard Bartel991%1.11%90.3
Tim Rattay871%0.91%97.1
Ryan Lindley621%2.72%22.7
John Navarre611%1.61%38.7

Fitzgerald ran away when he heard who his quarterback was going to be.

On Sunday, the Cardinals went into Seattle and played the type of game that leads people to wonder if a college football team could beat the worst NFL team. Coming into the game, Larry Fitzgerald had recorded a reception in 129 consecutive games, the second longest streak in football behind Tony Gonzalez. Against the Seahawks, Fitzgerald was kept off the stat sheet until seven minutes remained, and, when trailing 51-0, Ryan Lindley completed a two-yard pass to Fitzgerald to keep the streak alive. Fitzgerald, perhaps the best wide receiver of his era, has now recorded one catch in three of his last four games.

In 13 games this season, Fitzgerald has just 652 yards, an average of 50.1 yards per game. Entering week 14, Fitzgerald ranked 40th in receiving yards, and we can safely assume he is no longer ranked in the top forty.

How rare is it for an elite receiver to have such a miserable season at the age of 29? First we need to define what ‘elite’ means without asking ESPN. I came up with a quick and dirty system where I gave a receiver credit for his receiving yards over the Nth ranked receiver, where N represents the number of teams in the league in that season. For example, in 2011 Calvin Johnson receives credit for 794 yards, since he gained 1,681 yards and the 32nd receiver gained 887 yards. If you gained fewer yards than the Nth best receiver, you get zero yards for that season. The table below shows the career leaders using this formula (excluding 2012), and the column on the right pro-rates the data for non-16-game seasons.
[continue reading…]

References

References
1 Note: To determine quarterback games, I gave each quarterback credit for his number of pass attempts in each game divided by the team’s total number of attempts in the game.
{ 7 comments }

Profiling Pat Studstill

Lions wide receiver present.

On Sunday, Calvin Johnson became just the second player in NFL history to gain at least 125 receiving yards in five consecutive games. He’s also the second Lion to hit those marks.

As you’ve probably figured it out by the title, the only player with 125+ receiving yards in five straight games prior to Johnson was Patrick Lewis Studstill Jr., who had an 11-year career with the Lions, Rams, and Patriots. Studstill was a first-team All-Pro wide receiver in 1966, when he led the NFL in receiving yards. Beginning in week 5 of that season, Studstill topped 115 receiving yards in six straight weeks. Those were six highest single-game yardage totals of his career.

Studstill was a receiver and punter at the University of Houston in the late ’50s, but his senior season was a disaster. Head coach Hal Lahar was your typical coach of the era when it came to rules, and Studstill violated a major one — by getting married. Lahar benched Studstill for his entire senior year, and as a result, Studstill went undrafted. One of the Cougars assistant coaches, Red Conkright, was a former NFL player who would later become the last head coach of the Oakland Raiders before Al Davis. Conkright vouched for Studstill, who received a tryout in Detroit. Because of his versatility and speed, he was able to make the Lions roster in 1961.

Studstill didn’t see the field much during his rookie season, but did manage a 100-yard kickoff return touchdown against the Bears. An injury to Terry Barr in 1962 opened the door for Studstill to begin making a contribution on offense. In the last 9 games of the season, Sutdstill caught 31 passes for 446 yards, second on the team in both categories to Pro Bowler Gail Cogdill.
[continue reading…]

{ 12 comments }

Trivia of the Day – Saturday, October 20th

Megatron.

Calvin Johnson led the league in receiving last season with 1,681 yards. Johnson is fourth in receiving yards this season behind A.J. Green, Wes Welker, and Reggie Wayne, but Johnson is 2nd in yards per game as the Lions have had their bye week while the Bengals and Patriots have not.

If Johnson can lead the league in receiving yards again, he’d become just the third person since the merger to accomplish that feat. Which brings us to today’s trivia question.

Who was the last player to lead the league in receiving yards in consecutive seasons?

Trivia hint 1 Show


Trivia hint 2 Show


Trivia hint 3 Show


Click 'Show' for the Answer Show

{ 0 comments }
Next Posts Previous Posts