≡ Menu

Week 12 College Football SRS Ratings: Auburn Stays Alive

Entering week 12, there were 7 teams with legitimate paths to the national championship. The four undefeated teams came in with cupcake games, while two of the three one-loss teams had tough challenges. So what happened?

  • Alabama was a 23-point favorite at Mississippi State (53rd in the week 11 SRS ratings). It wasn’t pretty, but the Crimson Tide left Starkville with a 20-7 win.
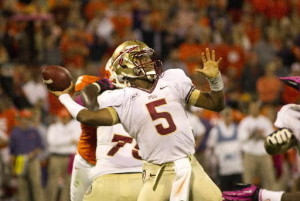
  • Florida State also simply needs to win out, and the Seminoles hosted Syracuse (69). FSU was a 37.5-point favorite, and the game wasn’t even that close. After one quarter, Jameis Winston was 10 for 10 for 170-yards, and the Seminoles were up 28-0, en route to a 59-3 win. That was the largest win of the week, and gives FSU four of the top nine single-game SRS scores of the season.
  • Behind the undefeated behemoths of the SEC and ACC are undefeated teams in two other major conferences: the Big 10 and Big 12. Ohio State was a 33.5-point favorite in Illinois (#74), while Baylor was a 27.5 point favorite against Texas Tech (#41) in Arlington. Ohio State jumped out to a 28-0 lead against Illinois, and won 60-35, but the game got a little close in the middle. It was only 35-21 in the third quarter, and 44-28 in the 4th, but Carlos Hyde and Braxton Miller (combined 40 carries for 430 yards and 5 touchdowns) were too much for the Illini to handle.
  • Baylor fell behind 14-0 early, but still managed to cover the spread after winning 63-34. After the hot start from the Red Raiders, the Bears scored 8 touchdowns in the next 36 minutes of game time. Quarterback Bryce Petty “struggled” in this game, which means he only completed 17 of 31 passes, but still picked up 335 yards and three touchdowns (to go along with two rushing scores). So far, the Bears have been up to the challenge as the meat of the schedule arrived in November, although the toughest test comes next week in Stillwater. The crazy part is that if it wasn’t for West Virginia, this Oklahoma State-Baylor game would be as hyped as any Big 12 game in recent memory: two explosive offenses, two undefeated teams, a B12 title and a possible BCSNCG berth on the line.
  • Three one loss teams were also knocking on the door. Stanford had the hardest SOS through 11 weeks of any team with no more than one loss, and the Cardinal owned the best win (as measured purely by SOS) of any team in the country. Stanford traveled to Los Angeles to face a USC team (#20) that had gone 4-1 since interim head coach Ed Orgeron took over for Lane Kiffin. Stanford was a 3.5-point favorite over the Trojans, but a strong fourth quarter gave USC the win. Kevin Hogan threw two late interceptions, and kicker Andre Heidari hit a 47-yarder in the final minute, completing the upset for Coach O and the Trojans. We can officially rule Stanford out of the BCS race, and absent any upsets, pencil in Oregon-Ohio State in the Rose Bowl.
  • Two one-loss SEC teams entered week 12 with quasi control-their-own-destiny fates. Missouri and Auburn know that winning out means an SEC championship and a win over Alabama. No one really knows if that would be enough to vault them into the BCS National Championship Game, but for idle MIZZOU, the debate will have to wait another week (the bye week comes at an opportune time, with Ole Miss and Johnny Manziel and Texas A&M coming up the next two weeks).
  • Auburn was a three-point home favorite against Georgia (#25), and got off to a hot start, outgaining Georgia 149 to 4 and grabbing a 10-0 lead after the first quarter. With 10 minutes left, the Tigers led 37-20, but three touchdowns in eight minutes — the last on a run by Aaron Murray on 4th-and-goal that just barely (if at all) got in — gave Georgia a 38-37 lead. All looked lost, until on 4th and 18, Nick Marshall threw a 73-yard touchdown to Ricardo Louis on the play of the year.

It didn’t take the straightest route, but after week 12, the national picture barely changed. The Iron Bowl in two weeks will be the de facto SEC West Championship Game, but more importantly it could be a quarterfinal matchup for the national title. The winner of Alabama/Auburn goes to the SEC Championship Game, which — if Missouri wins out — may be a de facto semifinal game. Whether a one-loss Auburn/Missouri gets in over an undefeated Baylor or Ohio State is tough to say, of course, although both of those teams could have a loss by then. And don’t worry: if either set of Tigers can upset Alabama, we will surely hear about how dominant the SEC is, which is very hard to argue.
[continue reading…]


{ 3 comments }

Non-FBS College Football Ratings Through 12 Weeks

Every week, I publish my college football ratings for FBS teams. To generate those ratings – using this methodology — my program also generates ratings for non-FBS team.  So let’s take a look at the ratings through twelve weeks for all non-FBS teams. After posting the ratings, I’m going to dip my toe into the Butler/Marist debate. As always, thanks to Dr. Peter Wolfe for providing the final scores for every college football game. [continue reading…]

{ 7 comments }

Last week, the top five was Florida State, Baylor, Oregon, Alabama, and Arizona State. Florida State won big (by 56), while Baylor and Alabama won big games (against Oklahoma and LSU) by comfortable margins. Arizona State won by a point at Utah, an underrated team (despite the record, Utah ranks 24th in the SRS). Of course, the big story of the week was Stanford (who lost to Utah earlier in the year) upsetting Oregon. Oregon understandably will drop in the rankings, but this late in the season, one game doesn’t swing the SRS nearly as much. After all, each game is given the same weight. Oregon gets credited with a 50.7 SRS score for losing in Palo Alto, which essentially says for one game, the Ducks were about the 20th best team in the country. Alabama gets 69.9 points for defeating LSU at home by 21. But while the Crimson Tide move up, and moves the Ducks down, Alabama did not pass Oregon in the SRS.

Say what? Yes, the SRS still has FSU, Baylor, and Oregon ahead of Alabama. I’ll explain more in a minute, but first, the SRS ratings through eleven weeks. As a reminder, you can read about the methodology here. As always, thanks to Dr. Peter Wolfe for providing the final scores for every college football game.
[continue reading…]

{ 1 comment }

Non-FBS College Football Ratings Through 11 Weeks

Every week, I publish my college football ratings for FBS teams. To generate those ratings – using this methodology — my program also generates ratings for non-FBS team.  So let’s take a look at the ratings through eleven weeks for all non-FBS teams. As always, thanks to Dr. Peter Wolfe for providing the final scores for every college football game. [continue reading…]

{ 0 comments }

Let’s start with the SRS ratings through nine weeks, excluding the Green Bay/Chicago Monday Night Football game:

RkTeamGMOVSOSSRSRecord
1Denver Broncos814.9-3.211.77-1
2Carolina Panthers812.3-2.89.45-3
3Green Bay Packers78.10.995-2
4Seattle Seahawks99.6-18.68-1
5San Francisco 49ers88.8-0.38.46-2
6Indianapolis Colts87.4-0.56.96-2
7Kansas City Chiefs911.2-4.36.99-0
8New Orleans Saints88.8-2.36.56-2
9Cincinnati Bengals96-0.55.56-3
10Dallas Cowboys95-0.14.95-4
11Detroit Lions82.513.55-3
12New England Patriots96.2-2.83.47-2
13Arizona Cardinals8-1.82.60.84-4
14Tennessee Titans80.8-0.20.54-4
15Baltimore Ravens80.30.20.43-5
16Miami Dolphins8-1.61.70.14-4
17San Diego Chargers83-3.1-0.14-4
18Chicago Bears70.6-1.4-0.84-3
19Philadelphia Eagles9-0.3-0.9-1.34-5
20Cleveland Browns9-3.11.8-1.34-5
21Buffalo Bills9-5.62.6-33-6
22Washington Redskins8-6.32.3-3.93-5
23St. Louis Rams9-4.80.4-4.43-6
24Atlanta Falcons8-5.30.2-52-6
25Houston Texans8-9.43.4-62-6
26Tampa Bay Buccaneers8-8.31.9-6.40-8
27Minnesota Vikings8-7.91.3-6.61-7
28New York Giants8-9.52.9-6.62-6
29New York Jets9-7.2-0.3-7.55-4
30Pittsburgh Steelers8-6.1-1.6-7.82-6
31Oakland Raiders8-7.4-0.7-8.13-5
32Jacksonville Jaguars8-21.93.7-18.10-8

[continue reading…]

{ 11 comments }

Shaw helped USC win the Battle of The Columbias Trophy. Yes, that is a real thing.

Shaw helped USC win the Battle of The Columbias Trophy. Yes, that is a real thing.

Last week, five teams emerged as the upper crust of college football. That number has dropped to four, after Missouri lost to South Carolina in typical heartbreaking style. The Tigers led 17-0 entering the fourth quarter, but that was before USC starting quarterback Connor Shaw — who had been held out due to injury — was inserted into the game. Shaw led the Gamecocks on a furious comeback to force overtime. After MIZZOU scored a touchdown on the first possession, Shaw threw his third touchdown pass on 4th-and-goal from the 16 yard line. On the second possession, USC was up first and kicked a field goal. Missouri looked to match South Carolina, but a 24-yard field goal bounced off the left upright, giving Tigers fans the gut punch loss of the season.

Elsewhere, most things went according to plan. Johnny Manziel played like a Heisman Trophy winner (25/35, 305 yards, 4 TDs, 1 INT), while Teddy Bridgewater (25/29, 344, 3, 0), Bryce Petty (20/32, 430, 3/0), and Jameis Winston (16/26, 292, 3/1) continued their dominant seasons. A couple of embattled schools pulled off impressive wins over conference rivals: Michigan State won 42-3 against Illinois, while Texas continued to put September in the rear-view mirror by stomping TCU, 30-7.

Below are the SRS ratings through nine weeks. As a reminder, you can read about the methodology here. As always, thanks to Dr. Peter Wolfe for providing the final scores for every college football game.
[continue reading…]

{ 5 comments }

Famous Jameis

Famous Jameis.

Last week, Florida State topped the SRS ratings. And that was before the Seminoles posted the single best performance of the season, winning at Clemson 51-14 on Saturday Night. They scored an 85.5 in the SRS against the Tigers, so FSU now has the top two games of the season (the team’s 63-0 shutout against Maryland had been the previous SRS leader). Freshman phenom Jameis Winston threw for 444 yards and 3 touchdowns on just 34 passes, and is vaulting to the front of Heisman leaderboards. How impressive was the win? Even if you ignore margin of victory, simply winning at Clemson stands as the most impressive road win of the season. The Tigers have an SRS of 53.5, and no team with a higher SRS score has lost at home this season. And it would be a surprise if the Seminoles didn’t finish the season undefeated.

Four of FSU’s final six regular season games come against teams outside of the top 75 in the SRS. FSU is a 29-point favorite this weekend against NC State, and should be similar favorites against Wake Forest, Syracuse, and Idaho (well, that game should be off the board). The only real challenges the rest of the way come from in-state rivals Miami and Florida, but for now, FSU seems like the best team not just in Florida, but in the country.

Of course, nothing is guaranteed in college football, a reality several teams were painfully reminded of this weekend. Louisville and Heisman/2014 No. 1 overall draft pick favorite Teddy Bridgewater lost, at home, to a sneaky good Central Florida team. If UCF can beat Houston in two weeks, the American Athletic Conference is likely theirs, along with an automatic BCS berth. Through eight weeks, the AAC has just three teams in the top half of the 125 FBS teams, so Central Florida’s path to a BCS Bowl won’t feature too many road blocks.

The one loss for the Knights was out of conference to South Carolina, a team who fell on SEC Upset Weekend. Despite a good game (and one monster hit) out of Jadeveon Clowney, the Gamecocks lost on a last-second field goal at Tennessee, 23-21.

That was one of five intraconference upsets in the SEC this weekend. Georgia lost on the road against Vanderbilt 31-27, despite the Bulldogs entering the game as 6.5-point favorites. Missouri had a higher SRS rating than Florida, but was a three-point underdog in Columbia against the Gators. The Tigers outgained Florida 500-151, and Henry Josey led the way with 18 carries for 136 yards and a score. LSU was a 9.5-point favorite in Oxford, but Zach Mettenberger threw three interceptions and Ole Miss jumped out to a 17-0 lead. The Tigers came back to tie the game, but the Rebels hit a 41-yard field goal as time expired to steal the win.

Johnny Manziel went down with an injury against Auburn, but you wouldn’t know it from his stat line: 28/38 for 454 yards, 4 TDs, 18 carries for 48 yards, 1 TD. Manziel also threw two interceptions, and missed one series with an injury, which might have made the difference in a shootout. Aggie wideout Mike Evans, who is a Vincent Jackson clone, caught 11 passes for 287 yards and four touchdowns. But Auburn, which entered College Station as 12.5-point underdogs, ultimately scored last, pulling out a 45-41 win. Tigers quarterback Nick Marshall had a great game, too, throwing for 236 passing yards and two touchdowns on 23 pass attempts, while adding 100 yards and two scores on the ground.

Only one game went according to script in the SEC, which is a pretty good way of describing just about every Alabama game ever. The Crimson Tide defeated Arkansas 52-0, in typical ruthless fashion. A.J. McCarron was 15/21 for 180 yards and 3 touchdowns, Kenyan Drake had 104 yards and two scores on 8 carries, and T.J. Yeldon had 88 yards and a score on 12 carries. Backup Derrick Henry even ran for an 80-yard touchdown in the final minutes, just because.
[continue reading…]

{ 3 comments }

Mariota and the Ducks continue to roll

Mariota and the Ducks continue to roll.

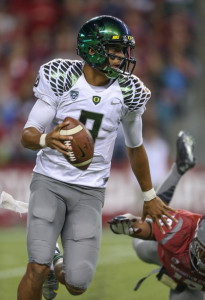
After seven weeks, the idle Seminoles remain atop the SRS Ratings. New readers can read the background about the Simple Rating System here, but the SRS simply takes margin of victory for each team (with some minor tweaks to minimize running up the score and to give credit for close wins) and adjusts that differential for strength of schedule. The top three comprises the same teams as last week, but following a big win in Washington, Oregon leapfrogged Baylor into the number two spot. Quarterback Marcus Mariota now has 17 passing touchdowns, eight rushing touchdowns, and zero interceptions. Among players with at least 150 pass attempts, he leads college football in Adjusted Yards per Attempt, with presumptive number one pick in the 2014 Draft — Louisville’s Teddy Bridgewater — three tenths of a yard behind him. (If you lower the threshold to 100 attempts, both Bryce Petty (Baylor) and Jameis Winston (Florida State) would vault Mariota.)

The 4-5-6 spots are occupied by SEC teams, with newcomer Missouri sandwiched next to SEC stalwarts Alabama and LSU. Missouri was identified as a sleeper in last week’s ratings — the Tigers actually ranked ahead of Georgia entering that game — and then pulled off one of the weekend’s big upsets by winning in Athens. But with Mizzou, the other shoe never waits very long to drop: quarterback James Franklin was injured against Georgia, and is out at least six weeks with a separated shoulder. The Tigers have averaged 45.7 points per game this year, so Missouri is very much a team built around its dynamic offense. It’s hard to imagine Missouri beating both Florida and South Carolina the next two weeks, even with both games coming at home. On the other hand, if the Tigers can do that, there’s a good chance they’ll enter the final game of the regular season with an undefeated record. That game comes against Johnny Manziel and former Big XII rival Texas A&M. If they get to that game, we’re going to just have to assume that this 2013 is Jason Lisk’s year and we’re all just living in it. His Chiefs and Tigers are a combined 12-0 right now, and none of that makes any sense.

There were two other “big upsets” this week among ranked teams. Number five Stanford lost in Utah, in a game that wasn’t as surprising as you might think. Last week, Stanford was “only” 11th and Utah was 30th in the SRS; in fact, the Cardinal only drop to #13 in the SRS this week, while the Utes jump up to #21. The other big upset was in the Red River Shootout, in a game that was hard to see coming. Texas lost to #36 (in the SRS) Ole Miss by 21 points at home earlier this year, so who saw them winning in Dallas against Oklahoma on Saturday? Right now, Baylor is the only team in the top 20 in the SRS from the Big 12, although the Bears had their own struggles against #40 KSU in week seven.

The #7 team in the SRS is Clemson, and the Tigers host Florida State next week in a matchup of two teams ranked in the top five (albeit not in the SRS). That looks to be one of the best games of the year, and is where College Gameday will be in week eight. That’s an 8PM kickoff, so plan accordingly. And now, the week seven SRS ratings. As always, this is an ever-evolving picture, but after seven weeks, you can begin to feel pretty confident in these ratings. As always, thanks to Dr. Peter Wolfe for providing the final scores for every college football game.
[continue reading…]

{ 1 comment }

Jacksonville at Denver: A “Preview”

Through five weeks, the Jaguars have been the worst team in the league and the Broncos have been the best. One could also argue that these two teams are even more extreme than the typical worst/best teams in the league, and that Denver has a larger home field advantage than your typical team. In other words, this is as large of a mismatch as we could possibly create, which jives with the historically large points spread of 28 points.

The situation is only getting uglier in Jacksonville. Blaine Gabbert continues to look like one of the worst quarterbacks to ever start 25 games in NFL history, so perhaps it’s good news that a hamstring injury will force Chad Henne into the starting lineup. And a few days after trading left tackle Eugene Monroe, 2nd overall pick Luke Joeckel went down with fractured ankle and is now lost for the season. Meanwhile, Peyton Manning and the Broncos offense look unstoppable.

I thought it would be fun to look at other times where the best and worst teams played each other. I’m going to define “best” and “worst” as the first- and last-placed teams according to the Simple Rating System, which means we’re actually going to have the benefit of hindsight here (i.e., we’ll be looking at the best/worst teams from the entire season, not as of the time when those two teams played). Since 1970, the best and worst teams have faced each other a total of 21 times, with the best team owning a perfect record.

YearTeamOppBoxscoreQBOpp QBH/RspreadPFPAMarg
2011NORIND10/23/2011Drew BreesCurtis PainterHome-1462755
2005INDSFO10/09/2005Peyton ManningAlex SmithRoad-1428325
2004NWESFO01/02/2005Tom BradyKen DorseyHome-1321714
1999STLCLE10/24/1999Kurt WarnerTim CouchHome-18.534331
1997DENSDG12/21/1997John ElwayCraig WhelihanHome-1338335
1997DENSDG11/30/1997John ElwayCraig WhelihanRoad-8.5382810
1992SFONWE10/11/1992Steve YoungHugh MillenRoad-17.5241212
1990BUFNWE11/18/1990Jim KellyMarc WilsonHome-1514014
1990BUFNWE10/28/1990Jim KellySteve GroganRoad-6271017
1989SFODAL10/15/1989Steve YoungSteve WalshRoad-14.5311417
1987SFOATL10/11/1987Joe MontanaJeff Van RaaphorstRoad-2325178
1987SFOATL12/20/1987Steve YoungChris MillerHome-1635728
1981PHIBAL11/15/1981Ron JaworskiBert JonesHome-14381325
1980PHINOR11/09/1980Ron JaworskiArchie ManningRoad-9342113
1976PITTAM12/05/1976Mike KruczekTerry HanrattyHome-2642042
1973RAMHOU10/07/1973John HadlDan PastoriniRoad031265
1972MIANWE11/12/1972Earl MorrallJim PlunkettHome052052
1972MIANWE12/03/1972Earl MorrallJim PlunkettRoad0372116
1971BALBUF10/10/1971Earl MorrallDennis ShawRoad043043
1971BALBUF12/05/1971Johnny UnitasDennis ShawHome024024
1970MINBOS12/13/1970Bob LeeJoe KappRoad0351421

In the ten times the best team in the league hosted the worst team in the league, the average score was 36-4. In the eight of those games where we have a points spread, the best team was favored by an average of 16.2 points. Let’s walk down memory lane.

2011: Saints 62, Colts 7 – Boxscore

True to form, this game featured the highest Game Script of any game from the 2011 season. The Saints held an average lead of 29.5 points in a game unfortunately placed in prime time. NBC was hoping for stories about Peyton Manning going home to New Orleans; instead, we watched Curtis Painter’s Colts fall behind 28-0 in the game’s first 20 minutes. The loss dropped the Colts to 0-7, and Indianapolis would start 0-13 before finishing 2-14. After being forced to deal with a full season of non-elite quarterback play, the football gods provided Andrew Luck to the city of Indianapolis a few months later. The Saints went 13-3 in 2011, and Drew Brees set the record for passing yards in a season, en route to winning the AP Offensive Player of the Year award.
[continue reading…]

{ 21 comments }

Last week, the Baylor Bears came in at number one in the first edition of the 2013 SRS Ratings. But the Bears ranked #1 on the strength of blowouts against bad teams; how would Baylor fare against West Virginia, who upset Oklahoma State just one week ago?

Art Briles’ squad raced out to a 56-14 lead, eventually won 73-42, and have cemented themselves as the new cool kids in town. But that doesn’t mean Baylor remained atop the SRS ratings. No, after Florida State and Jameis Winston dismantled Maryland, the Seminoles now rank number one:
[continue reading…]

{ 1 comment }

Five weeks in, the first edition of NCAA SRS ratings

Petty and Seastrunk have yet to break a sweat

Petty and Seastrunk have yet to break a sweat.

It’s still too early to put much faith in any computer ratings, but we can at least begin framing the discussion of which are the most impressive teams in college football. As always, thanks to Dr. Peter Wolfe for providing the final scores for every college football game. As a reminder, here’s the system for producing SRS ratings.

1) For each game not played at a neutral site, 3 points are given to the road team. After that adjustment, all wins and losses of between 7 and 24 points are recorded exactly as such. This means that a 24-10 road win goes down as +17 for the road team, -17 for the home team.

2) With one exception, wins of 7 or fewer points are scored as 7-point wins and losses of 7 or fewer points are scored as 7 point losses. So a 4-point home win goes down as +7 (and not a 1) and a 1-point home loss is a -7 (and not a -4). The one exception is that road losses of 3 or fewer (and home wins of 3 or fewer) are graded as ties. So a 21-20 home victory goes down as a 0 for both teams.

3) Wins/Losses of more than 24 points are scored as the average between the actual number and 24. This is to avoid giving undue credit to teams that run up the score. So a 75-point home win goes down as a 48-point win.

Once we have a rating for each team in each game, we then adjust each result for strength of schedule. This is an iterative process, where we adjust the ratings hundreds of times (to adjust for SOS, you have to adjust for the SOS of each opponent, and the SOS of each opponent’s opponent, and so on.) in Excel. Then we produce final ratings, where the SRS rating is the sum of the Margin of Victory and Strength of Schedule in every week.

After five weeks, what are the results? As usual, the table is fully searchable (type “-0”, for example, to see a list of undefeated teams, or SEC to see all SEC teams.) Right now, the number one team is Baylor, with an average (adjusted) Margin of Victory of 41.5 points per game against an average opponent that is 27.7 points better than average (average includes all football teams at all levels, so all FBS will have a positive grade). Among undefeated teams, no opponent has faced a tougher SOS than Alabama. Below shows all 125 FBS teams.
[continue reading…]

{ 8 comments }

Post-Week 3 College Football Ratings: Part I

With three weeks in the books, it’s time to unveil some college football ratings. This is part one — I plan to post Part II on Sunday afternoon.

It’s still too early to create meaningful SRS ratings, but there’s a workaround solution. You may recall that back in the summer, I created implied college football SRS ratings based on the Las Vegas spreads for 247 games. Those spreads were stale, but thanks to RJ Bell, founder of Pregame.com, I was able to get the final pre-game lines for those 247 games. I used those lines to build implied pre-season SRS ratings for 83 FBS teams, shown below:

RkTmGMOVSOSSRSConf
1Alabama1022.5-2.420.1SEC
2Oregon1121.7-5.416.3P12
3Georgia10110.311.2SEC
4Texas A&M78.62.611.2SEC
5Ohio State1016.7-5.611B10
6LSU94.14.88.8SEC
7South Carolina109.6-18.6SEC
8Texas1110-1.68.4B12
9Florida St913.2-5.18.1ACC
10Florida96.61.58.1SEC
11Stanford108.1-0.47.7P12
12Oklahoma St99.3-2.17.2B12
13Oklahoma107.3-0.17.2B12
14Clemson98.4-2.55.9ACC
15Southern Cal1110-4.55.5P12
16Notre Dame128.3-2.85.5IND
17Michigan95.9-0.95B10
18Mississippi6-2.87.14.3SEC
19Nebraska54.3-0.34B10
20Wisconsin63.50.43.9B10
21TCU91.91.53.4B12
22Arizona St103.7-12.7P12
23Virginia Tech620.42.4ACC
24Michigan St73.9-21.9B10
25Oregon St104.9-3.21.7P12
26Miami FL83.1-1.61.6ACC
27Louisville913.7-12.21.5AAC
28Kansas St82.4-1.11.3B12
29Northwestern94.1-3.40.7B10
30UCLA111.9-1.90P12
31Arizona105-5.1-0.1P12
32North Carolina5-10.7-0.3ACC
33Penn State81.6-2.2-0.6B10
34Washington100.9-1.5-0.6P12
35Baylor6-4.83.7-1.1B12
36Boise St36.2-7.5-1.3MWC
37Georgia Tech6-4.63.1-1.4ACC
38Vanderbilt5-8.16.3-1.8SEC
39Missouri4-11.89.8-2SEC
40Brigham Young80.1-2.2-2IND
41Tennessee7-8.54.9-3.6SEC
42Cincinnati24.3-8.4-4.1AAC
43Mississippi St6-11.37.2-4.1SEC
44Texas Tech3-10.56.3-4.2B12
45West Virginia8-6.31.3-5B12
46Arkansas7-11.46.1-5.3SEC
47Auburn8-8.93.1-5.8SEC
48Maryland1-2-5-7ACC
49Syracuse4-10.63.6-7.1ACC
50Central Florida2-12.55-7.5AAC
51North Carolina St3-12.24.6-7.6ACC
52Pittsburgh4-124.4-7.6ACC
53Tulsa1-157.2-7.8CUSA
54Utah7-12.14.2-7.9P12
55Iowa6-10.32.2-8B10
56San Diego St2-14.56.4-8.1MWC
57Rutgers2-6.3-1.9-8.2AAC
58Iowa St7-11.22.1-9.2B12
59Minnesota6-7.8-1.4-9.2B10
60Virginia5-14.54.8-9.7ACC
61Purdue3-15.55.3-10.2B10
62Indiana1-2211-11B10
63Boston College3-18.56.5-12ACC
64South Florida3-13.81.6-12.2AAC
65Wake Forest2-19.57-12.5ACC
66Navy2-4.5-8-12.5IND
67Air Force1-185.5-12.5MWC
68Houston1-14.51.5-13AAC
69California9-17.84.7-13.1P12
70Connecticut2-16.83.2-13.5AAC
71Washington St8-17.33.4-13.9P12
72Kentucky6-21.67.7-13.9SEC
73Nevada3-16.82-14.8MWC
74Illinois4-17.52.6-14.9B10
75Colorado St2-180-18MWC
76Temple3-19.21-18.2AAC
77UNLV3-9.5-9.9-19.4MWC
78Memphis1-211.5-19.5AAC
79Southern Miss1-18.5-1.3-19.8CUSA
80Kansas3-25.55.6-19.9B12
81Colorado7-21.31.2-20.1P12
82Central Michigan1-1-19.4-20.4MAC
83Army1-9-12.5-21.5IND

[continue reading…]

{ 7 comments }

Here is a recap of the 2012 Chicago Bears season.  Notice anything strange? Trick question!

Score
Week Day Date OT Rec Opp Tm Opp
1 Sun September 9 boxscore W 1-0 Indianapolis Colts 41 21
2 Thu September 13 boxscore L 1-1 @ Green Bay Packers 10 23
3 Sun September 23 boxscore W 2-1 St. Louis Rams 23 6
4 Mon October 1 boxscore W 3-1 @ Dallas Cowboys 34 18
5 Sun October 7 boxscore W 4-1 @ Jacksonville Jaguars 41 3
6 Bye Week
7 Mon October 22 boxscore W 5-1 Detroit Lions 13 7
8 Sun October 28 boxscore W 6-1 Carolina Panthers 23 22
9 Sun November 4 boxscore W 7-1 @ Tennessee Titans 51 20
10 Sun November 11 boxscore L 7-2 Houston Texans 6 13
11 Mon November 19 boxscore L 7-3 @ San Francisco 49ers 7 32
12 Sun November 25 boxscore W 8-3 Minnesota Vikings 28 10
13 Sun December 2 boxscore L OT 8-4 Seattle Seahawks 17 23
14 Sun December 9 boxscore L 8-5 @ Minnesota Vikings 14 21
15 Sun December 16 boxscore L 8-6 Green Bay Packers 13 21
16 Sun December 23 boxscore W 9-6 @ Arizona Cardinals 28 13
17 Sun December 30 boxscore W 10-6 @ Detroit Lions 26 24

[continue reading…]

{ 4 comments }

The Best Passing Games of 2012 (NFL)

Even Watt couldn't slow down Rodgers and... Henne.

Even Watt couldn't slow down Rodgers and... Henne.

Yesterday, I presented my Rearview ANY/A ratings for quarterbacks and defenses in 2012. Strength of schedule adjustments are important — without it, Peyton Manning‘s numbers were tops in the league, but after the adjustments, Tom Brady moved into the number one slot. To create the season rankings, I had to come up with rankings for each quarterback and each defense in every game last season, so I figured I should present those results as well.

Using the same principles from yesterday’s post, the table below shows all games where a quarterback produced over 100 Adjusted Net Yards above average. You’re probably surprised to see that Chad Henne’s performance in Houston ranks as the single best passing game of 2012. There were only 64 pass plays of 60+ yards last season, but three of them came by Henne against the Texans. That game narrowly edged out Brady’s Thanksgiving Night performance against the Jets (overshadowed by Le Buttfumble), and a separate shredding of the Texans secondary, this time courtesy of Aaron Rodgers. You can click on the boxscore below to see the full PFR boxscore of each game. As always, the table is fully searchable and sortable, and you can click the arrows at the bottom to see more rows.
[continue reading…]

{ 6 comments }

Every year at Footballguys.com, I publish an article called Rearview QB, which adjusts quarterback (and defense) fantasy numbers for strength of schedule. I’ve also done the same thing using ANY/A instead of fantasy points, and today I revive that concept for the 2012 season.

Let’s start with the basics. Adjusted Net Yards per Attempt is defined as (Passing Yards + 20 * Passing Touchdowns – 45 * Interceptions – Sack Yards Lost) divided by (Pass Attempts plus Sacks). ANY/A is my favorite explanatory passing statistic — it is very good at telling you the amount of value provided (or not provided) by a passer in a given game, season, or career.

Let’s start with some basic information. The league average ANY/A in 2012 was 5.93. Peyton Manning averaged 7.89 ANY/A last year, the highest rate in the league among the 39 passers with at least 75 attempts. Since the Broncos star had 583 pass attempts and 21 sacks in 2012, that means he was producing 1.96 ANY/A over league average on 604 dropbacks. That means Manning is credited with 1,185 Adjusted Net Yards above average, a metric I simply call “VALUE” in the table below. Manning led the league in that category, with Tom Brady, Drew Brees, Aaron Rodgers, and Matt Ryan rounding out the top five. Remember, the ANY/A and VALUE results aren’t supposed to surprise you, so it makes sense that the best quarterbacks finish near the top in this category every year.
[continue reading…]

{ 21 comments }

Vegas likes Alabama a lot more than it likes LSU

Vegas likes Alabama a lot more than it likes LSU.

The Simple Rating System is a set of computer rankings focused on only two variables: strength of schedule and margin of victory. I published weekly college football SRS ratings each week last season, and you can read more about the SRS there. Last month, Jason Lisk of the Big Lead took the Las Vegas point spread for each NFL game to come up with a set of power rankings; I stole Lisk’s idea and used the same point spreads to create implied SRS ratings for every NFL team. The idea is that if the 49ers are a 10.5-point neutral site favorite over the Jaguars, that’s one data point that implies that Las Vegas views San Francisco as 10.5 points better than Jacksonville. By taking every data point, and using Excel to iterate the ratings hundreds of times, you can create a set of implied team ratings.

Last week, the Golden Nugget released the point spreads for 248 college football games. By using the same process, those point spreads can help us determine the implied ratings that Las Vegas has assigned to each team.

We don’t have a full slate of games, but we do have at least 1 game for 83 different teams. Theoretically, this is different than using actual game results: one game can be enough to come up with Vegas’ implied rating for the team. That’s because once we’re confident in Oklahoma’s rating, Tulsa being 18-point underdogs in Norman gives us a good estimate for how Vegas views Tulsa. I assigned 3 points to the road team in each game in coming up with the implied SRS ratings. For example, Arizona is an 11-point favorite on the road against California. So for that game, we assume Vegas believes the Wildcats are 14 points better than the Golden Bears; if we do this for each of the other 247 games, and then iterate the results hundreds of times, we can come up with a set of power ratings.

Unsurprisingly, Alabama comes out as the highest-rated team. The Crimson Tide are being rated as 19.6 points better than “average,” although average isn’t really a concept with much meaning here. The SRS rating has little meaning in the abstract, but is useful to get a sense of the Crimson Tide’s rating relative to the rest of the teams. If Alabama is 10 points better in the SRS than a team, that means Alabama would be projected as a 10-point favorite on a neutral site. In the table below, I’ve included the number of games for which we have point spreads for each team on the far left. The “MOV” column shows the home field-adjusted average point spread for that team, the “SOS” column shows the average rating of each team’s opponent (for only the number of games for which we have lines), and the “SRS” column shows the school’s SRS rating.
[continue reading…]

{ 3 comments }

Implied SRS Ratings of each NFL Team

On Wednesday, Jason Lisk came up with a set of power rankings based on the point spread for nearly every game this season (spreads for the games in the final week of the season have not yet been released).

We can use the SRS to come up with the implied ratings for each team (this is what Lisk did, although I don’t think he used the SRS). So how do we come up with the SRS ratings? The point spread in each game provides an implied strength margin (“ISM”) between the two teams: When the Jaguars are 14-point underdogs in Denver, that implies that Denver is 11 points better than Jacksonville. If we treat each ISM like we would margin of victory, then we can use the SRS to come up with team ratings. For those who need a primer on what the SRS is, you can read about it here; the rest of you can skip to the ratings:
[continue reading…]

{ 12 comments }

The Saints would dig Football Perspective

The Saints would dig Football Perspective.

Last week, Chase had a great post where he looked at what percentage of the points scored by a team in any given game is a function of the team, and what percentage is a function of the opponent. The answer, according to Chase’s method, was 58 percent for the offense and 42 percent for the defense (note that, in the context of posts like these, “offense” means “scoring ability, including defensive & special-teams scores”, and “defense” means “the ability to prevent the opponent from scoring”). Today I’m going to use a handy R extension to look at Chase’s question from a slightly different perspective, and see if it corroborates what he found.

My premise begins with every regular-season game played in the NFL since 1978. Why 1978? I’d love to tell you it was because that was the year the modern game truly emerged thanks to the liberalization of passing rules (which, incidentally, is true), but really it was because that was the most convenient dataset I had on hand with which to run this kind of study. Anyway, I took all of those games, and specifically focused on the number of points scored by each team in each game. I also came armed with offensive and defensive team SRS ratings for every season, which give me a good sense of the quality of both the team’s offense and their opponent’s defense in any given matchup.

If you know anything about me, you probably guessed that I want to run a regression here. My dependent variable is going to be the number of points scored by a team in a game, but I can’t just use raw SRS ratings as the independent variables. I need to add them to the league’s average number of points per game during the season in question to account for changing league PPG conditions, lest I falsely attribute some of the variation in scoring to the wrong side of the ball simply due to a change in scoring environment. This means for a given game, I now have the actual number points scored by a team, the number of points they’d be expected to score against an average team according to SRS, and the number of points their opponents would be expected to allow vs. an average team according to SRS.
[continue reading…]

{ 2 comments }

Yesterday, I ranked every quarterback in college football last season. Today, I’ll do the same for every quarterback since 2005. If you read yesterday’s article, you can skip the next three paragraphs, which explain the system I used.

These guys were great in college.

These guys were great in college.

I start by calculating each quarterback’s Adjusted Net Yards per Attempt, done by starting with passing yards per attempt, adding 20 yards for each touchdown and subtracting 45 yards for each interception, and subtracting sack yards lost from the numerator and adding sacks to the denominator. Because the NCAA treats sack stats as rushing data, and because the game logs I have (courtesy of cfbstats.com) only show separate sack data on the team level, some estimation is involved in coming up with player sacks. Each quarterback is assigned X% of the sacks his team’s offense suffered in each game, with X equaling the number of pass attempts thrown by that player divided by his team’s total number of pass attempts.

Once I have calculate the ANY/A for each player, I then adjusted their ratings for strength of schedule. This involves an iterative process I described here and is virtually identical to how I calculate SRS ratings in college football on the team level. You adjust each quarterback’s ANY/A (weighted by number of pass attempts) for the qualify of the defense, which is adjusted by the quality of the quarterbacks it faced, which is adjusted by the quality of all the defenses all of those quarterbacks faced, and so on. After awhile, the ratings converge, and you come up with final, SOS-adjusted ANY/A ratings.
[continue reading…]

{ 4 comments }

The Chiefs play the Baylor game on an endless loop for the other 31 teams.

The Chiefs play the Baylor game on an endless loop for the other 31 teams.

A few weeks ago, I discovered cfbstats.com, which has made available for download an incredible amount of college football statistics from the last eight seasons. Thanks to them, I plan to apply some of the same techniques I’ve used on NFL numbers over the years to college statistics. If you’re a fan of college football, you’re probably already reading talented writers like Bill Connelly and Brian Fremeau, but hopefully I can bring something new to the table for you to enjoy.

There are many differences between college and professional football, but many of the same stats still matter. For quarterbacks, Adjusted Net Yards per Attempt is still the king of the basic stats [1]For the uninitiated, ANY/A is calculated by starting with passing yards per attempt, adding 20 yards for each touchdown and subtracting 45 yards for each interception, and subtracting sack yards lost … Continue reading, and it is arguably even more important in college where teams play at varying different paces.

There’s a small problem, however, if you want to calculate ANY/A at the college level: the NCAA counts sacks as rush attempts and sack yards lost as negative rushing yards. I manually overrode [2]Unfortunately, some estimation was involved. The player game logs at cfbstats do not identify quarterback sacks, but the team game logs do. So for each quarterback, we know how many passes he threw … Continue reading that decision in my data set, so going forward, all rushing and passing data will include sack data in the preferred manner (keep this in mind when you compare the statistics I present to the “official” ones).
[continue reading…]

References

References
1 For the uninitiated, ANY/A is calculated by starting with passing yards per attempt, adding 20 yards for each touchdown and subtracting 45 yards for each interception, and subtracting sack yards lost from the numerator and adding sacks to the denominator.
2 Unfortunately, some estimation was involved. The player game logs at cfbstats do not identify quarterback sacks, but the team game logs do. So for each quarterback, we know how many passes he threw in the game and how many times his team was sacked. For quarterbacks who threw 100% of their team’s passes in a game, this is easy. However, for quarterbacks who threw fewer than 100% of their team’s passes, they were assigned a pro-rata number of their team’s sacks.
{ 10 comments }

Does pre-season strength of schedule matter?

NFL.com posted an article yesterday looking at the strength of schedule for each team in 2013. We have known each team’s opponents since the end of the regular season, and while the full schedule won’t come out until April, it’s simple to calculate a team’s strength of schedule for 2013. Usually, the media reports this by looking at the win-loss record of each opponent from the prior season. Here are the projected SOSs for each team next season:

TeamSOSOpponent record
Carolina Panthers0.543138-116-2
Detroit Lions0.539138-118-0
New Orleans Saints0.539137-117-2
St. Louis Rams0.539137-117-2
Baltimore Ravens0.535137-119-0
Green Bay Packers0.533136-119-1
Arizona Cardinals0.52131-121-4
Miami Dolphins0.52133-123-0
San Francisco 49ers0.52132-122-2
Minnesota Vikings0.516132-124-0
Seattle Seahawks0.516130-122-4
Cincinnati Bengals0.508130-126-0
Jacksonville Jaguars0.508129-125-2
New England Patriots0.508130-126-0
Atlanta Falcons0.504128-126-0
Chicago Bears0.502128-127-1
Tampa Bay Buccaneers0.5127-127-2
Washington Redskins0.498127-128-1
New York Jets0.496127-129-0
Philadelphia Eagles0.496127-129-0
Cleveland Browns0.492126-130-0
Pittsburgh Steelers0.496126-130-0
Tennessee Titans0.488124-130-2
New York Giants0.48123-133-0
Dallas Cowboys0.48121-134-1
Buffalo Bills0.473121-135-0
Houston Texans0.473120-134-2
Kansas City Chiefs0.473121-135-0
Oakland Raiders0.469120-136-0
Indianapolis Colts0.461117-137-2
San Diego Chargers0.457117-139-0
Denver Broncos0.43110-146-0

[continue reading…]

{ 9 comments }

Super Bowl History

Now that the Super Bowl matchup is set, I thought I’d start the two-week period with some Super Bow history. The table below lists some information from each of the first 46 Super Bowls. With Joe Flacco and Colin Kaepernick facing off, that ends five-year streak where at least one of the two quarterbacks in the Super Bowl had previously won (or been in) a Super Bowl:

YearSBWinnerPFLoserPALocationSTQBOpp QBMVP
2011XLVINew York Giants21New England Patriots17IndianapolisINEli ManningTom BradyEli Manning
2010XLVGreen Bay Packers31Pittsburgh Steelers25ArlingtonTXAaron RodgersBen RoethlisbergerAaron Rodgers
2009XLIVNew Orleans Saints31Indianapolis Colts17MiamiFLDrew BreesPeyton ManningDrew Brees
2008XLIIIPittsburgh Steelers27Arizona Cardinals23TampaFLBen RoethlisbergerKurt WarnerSantonio Holmes
2007XLIINew York Giants17New England Patriots14GlendaleAZEli ManningTom BradyEli Manning
2006XLIIndianapolis Colts29Chicago Bears17MiamiFLPeyton ManningRex GrossmanPeyton Manning
2005XLPittsburgh Steelers21Seattle Seahawks10DetroitMIBen RoethlisbergerMatt HasselbeckHines Ward
2004XXIXNew England Patriots24Philadelphia Eagles21JacksonvilleFLTom BradyDonovan McNabbDeion Branch
2003XXXVIIINew England Patriots32Carolina Panthers29HoustonTXTom BradyJake DelhommeTom Brady
2002XXXVIITampa Bay Buccaneers48Oakland Raiders21San DiegoCABrad JohnsonRich GannonDexter Jackson
2001XXXVINew England Patriots20St. Louis Rams17New OrleansLATom BradyKurt WarnerTom Brady
2000XXXVBaltimore Ravens34New York Giants7TampaFLTrent DilferKerry CollinsRay Lewis
1999XXXIVSt. Louis Rams23Tennessee Titans16AtlantaGAKurt WarnerSteve McNairKurt Warner
1998XXXIIIDenver Broncos34Atlanta Falcons19MiamiFLJohn ElwayChris ChandlerJohn Elway
1997XXXIIDenver Broncos31Green Bay Packers24San DiegoCAJohn ElwayBrett FavreTerrell Davis
1996XXXIGreen Bay Packers35New England Patriots21New OrleansLABrett FavreDrew BledsoeDesmond Howard
1995XXXDallas Cowboys27Pittsburgh Steelers17TempeAZTroy AikmanNeil O'DonnellLarry Brown
1994XXIXSan Francisco 49ers49San Diego Chargers26MiamiFLSteve YoungStan HumphriesSteve Young
1993XXVIIIDallas Cowboys30Buffalo Bills13AtlantaGATroy AikmanJim KellyEmmitt Smith
1992XXVIIDallas Cowboys52Buffalo Bills17PasadenaCATroy AikmanJim KellyTroy Aikman
1991XXVIWashington Redskins37Buffalo Bills24MinneapolisMNMark RypienJim KellyMark Rypien
1990XXVNew York Giants20Buffalo Bills19TampaFLJeff HostetlerJim KellyOttis Anderson
1989XXIVSan Francisco 49ers55Denver Broncos10New OrleansLAJoe MontanaJohn ElwayJoe Montana
1988XXIIISan Francisco 49ers20Cincinnati Bengals16MiamiFLJoe MontanaBoomer EsiasonJerry Rice
1987XXIIWashington Redskins42Denver Broncos10San DiegoCADoug WilliamsJohn ElwayDoug Williams
1986XXINew York Giants39Denver Broncos20PasadenaCAPhil SimmsJohn ElwayPhil Simms
1985XXChicago Bears46New England Patriots10New OrleansLAJim McMahonTony EasonRichard Dent
1984XIXSan Francisco 49ers38Miami Dolphins16StanfordCAJoe MontanaDan MarinoJoe Montana
1983XVIIILos Angeles Raiders38Washington Redskins9TampaFLJim PlunkettJoe TheismannMarcus Allen
1982XVIIWashington Redskins27Miami Dolphins17PasadenaCAJoe TheismannDavid WoodleyJohn Riggins
1981XVISan Francisco 49ers26Cincinnati Bengals21PontiacMIJoe MontanaKen AndersonJoe Montana
1980XVOakland Raiders27Philadelphia Eagles10New OrleansLAJim PlunkettRon JaworskiJim Plunkett
1979XIVPittsburgh Steelers31Los Angeles Rams19PasadenaCATerry BradshawVince FerragamoTerry Bradshaw
1978XIIIPittsburgh Steelers35Dallas Cowboys31MiamiFLTerry BradshawRoger StaubachTerry Bradshaw
1977XIIDallas Cowboys27Denver Broncos10New OrleansLARoger StaubachCraig MortonRandy White [1]Co-MVP with Harvey Martin
1976XIOakland Raiders32Minnesota Vikings14PasadenaCAKen StablerFran TarkentonFred Biletnikoff
1975XPittsburgh Steelers21Dallas Cowboys17MiamiFLTerry BradshawRoger StaubachLynn Swann
1974IXPittsburgh Steelers16Minnesota Vikings6New OrleansLATerry BradshawFran TarkentonFranco Harris
1973VIIIMiami Dolphins24Minnesota Vikings7HoustonTXBob GrieseFran TarkentonLarry Csonka
1972VIIMiami Dolphins14Washington Redskins7Los AngelesCABob GrieseBilly KilmerJake Scott
1971VIDallas Cowboys24Miami Dolphins3New OrleansLARoger StaubachBob GrieseRoger Staubach
1970VBaltimore Colts16Dallas Cowboys13MiamiFLJohnny UnitasCraig MortonChuck Howley
1969IVKansas City Chiefs23Minnesota Vikings7New OrleansLALen DawsonJoe KappLen Dawson
1968IIINew York Jets16Baltimore Colts7MiamiFLJoe NamathEarl MorrallJoe Namath
1967IIGreen Bay Packers33Oakland Raiders14MiamiFLBart StarrDaryle LamonicaBart Starr
1966IGreen Bay Packers35Kansas City Chiefs10Los AngelesCABart StarrLen DawsonBart Starr

[continue reading…]

References

References
1 Co-MVP with Harvey Martin
{ 9 comments }

Presented without comment, the most current Simple Ratings, weighted for recency:

RkTeampfr_idMean (SRS)Std. ErrorUpperLower
1Seattle Seahawkssea13.573.2219.927.23
2New England Patriotsnwe12.393.3518.985.81
3San Francisco 49erssfo10.233.3316.803.66
4Denver Broncosden9.543.3416.122.96
5Green Bay Packersgnb7.083.2813.540.62
6Atlanta Falconsatl6.603.3113.110.08
7New York Giantsnyg5.943.4312.70-0.82
8Chicago Bearschi5.763.4312.50-0.99
9Baltimore Ravensrav4.053.2410.42-2.33
10Washington Redskinswas3.523.3310.08-3.04
11Minnesota Vikingsmin3.303.379.94-3.34
12Cincinnati Bengalscin2.833.319.36-3.69
13New Orleans Saintsnor2.063.428.80-4.68
14Carolina Pantherscar1.503.428.23-5.23
15Houston Texanshtx1.483.247.85-4.90
16St Louis Ramsram0.753.437.50-6.00
17Dallas Cowboysdal-0.243.436.51-6.99
18Pittsburgh Steelerspit-0.783.435.98-7.53
19Tampa Bay Buccaneerstam-1.053.415.67-7.78
20Miami Dolphinsmia-2.843.443.93-9.62
21San Diego Chargerssdg-2.913.423.82-9.64
22Detroit Lionsdet-3.513.423.22-10.24
23Arizona Cardinalscrd-4.473.442.30-11.23
24Indianapolis Coltsclt-5.063.301.45-11.56
25Cleveland Brownscle-5.403.441.37-12.17
26Buffalo Billsbuf-6.703.440.07-13.46
27New York Jetsnyj-7.353.43-0.60-14.09
28Philadelphia Eaglesphi-9.883.43-3.12-16.65
29Oakland Raidersrai-10.523.42-3.78-17.26
30Tennessee Titansoti-10.603.45-3.81-17.38
31Jacksonville Jaguarsjax-13.943.43-7.19-20.69
32Kansas City Chiefskan-14.403.43-7.65-21.16

“Upper” and “Lower” are the 95% confidence intervals around each estimate. Roughly speaking, this means we can be 95% confident that, say, the 49ers’ “true” SRS rating is between 3.66 and 16.80.

{ 1 comment }

Yesterday, I provided my preview of the NFC Championship Game, and I’ll do the same for the AFC tomorrow. But today, here’s a listing of every conference championship game the since the NFL merger. The table below shows each game from the perspective of the winning team and includes a linkable boxscore for each game. The table also includes the Offensive SRS and Defensive SRS grades for each team and each opponent, along with the total SRS difference between the two teams. The final column shows the Vegas spread. You can search for all AFC or NFC games, or all games with BUF or DAL, for example. If you type in “NYG” you will see the five NFC Championship Games the Giants were in: not only was New York 5-0, but they were underdogs in four of those games. As always, the table is also fully sortable.
[continue reading…]

{ 3 comments }

Checkdowns: Deja vu for the Falcons?

Mike Smith's team either just converted a 4th-and-1 or won another one-point game.

Mike Smith's goal in 2013 is to face a bad #6 seed for a change.

Much has been written this season arguing that the Falcons are not as good as their 13-3 record. Conversely, the Seahawks have emerged as a favorite among some in our advanced statistical community: Brian Burke ranks Seattle as the third most efficient team, Aaron Schatz ranks them number one, and Pro-Football-Reference ranks Seattle second in the SRS behind only the Patriots.

Here’s a quick way to summarize the Falcons-Seahawks game on Sunday: Atlanta won two more games than Seattle this season but the SRS says that the Falcons are 5.7 points worse than the Seahawks. That’s based on the fact that (1) Seattle has outscored opponents its by 2.9 more points per game than Atlanta outscored its opponents this year, and (2) Seattle faced a schedule that was 2.8 points per game harder than Atlanta’s schedule.

How often does it happen that a home team in the playoffs won 2+ more games than its opponent but was at least 5 points worse than that opponent in the SRS? This is just the second time such a matchup has occurred in the last 10 years… and the first involved the 2010 Falcons. In fact, this scenario has only unfolded five times since 1970:

YearBoxscoreTmOppRdSRS TMSRS OPPSRS DIFFWIN TMWIN OPPWIN DIFFPFPAW/L
2012BoxscoreATLSEAD6.512.2-5.713112
2010BoxscoreATLGBD611-5131032148L
1999BoxscoreTENBUFW17.2-6.2131122216W
1982BoxscoreRAINYJD5.310.7-5.48621417L
1976BoxscoreRAIPITC8.515.3-6.813103247W

[continue reading…]

{ 1 comment }

This is mostly a huge end-of-regular-season data dump, but I’ll explain a little before the table…

PFR’s Simple Rating System can be broken into offensive and defensive components, which represent the number of points per game the team scored/allowed per game compared to the league average, after adjusting for the strength of opposing offenses and defenses faced. If you want to derive an expected winning percentage from that, you have to “back out” to total points scored/allowed again. To do that, you just add OSRS (or subtract DSRS) to the league’s average PPG, then multiply by the number of games the team played. This will give you adjusted points scored/allowed totals for the season.

To get that into a winning percentage-like form, you then need to plug those totals into the Pythagorean Formula. It usually takes the form of

(Pts Scored ^ x) / (Pts Scored ^ x + Pts Allowed ^ x)

where x was determined to be around 2.4 for the NFL in the 1990s, when current Houston Rockets (yep, basketball) GM Daryl Morey researched it for STATS, Inc. Last year, Football Outsiders decided to employ a “floating” exponent that varies with the scoring environment in which a team played, recognizing that a single point is more important to winning in lower-scoring environments. To that end, they used what’s known as the “Pythagenport” method of determining the exponent, which is

1.5 * log10((PF + PA) / G)

I was poking around in the data the other day, though, and found that the so-called “Pythagenpat” variant actually correlates slightly better with teams’ actual won-lost records since the NFL-AFL merger. That formula suggests for each team an exponent of

((PF + PA) / G) ^ 0.2466

This gives you a 1.204 RMSE vs. wins since 1970, a very slight improvement over the 1.205 RMSE you get using FO’s formula.

At any rate, I applied the Pythagenpat exponent to each team’s schedule-adjusted points scored/allowed totals since 1970, and tweaked the pythagorean win/loss totals up/down at the league-season level to match actual league-wide win/loss totals. The result was a definitive set of pythagorean ratings for every team since the merger:

YearTmpfr_idDivisionGWLTWPctPtsPtsOOSRSDSRSadj_PFadj_PAadj_Pyth
2012Buffalo BillsbufAFC East1661000.375344435-0.9-5.8349.84456.840.3331
2012Miami DolphinsmiaAFC East167900.438288317-5.52.9276.24317.640.4174
2012New England PatriotsnweAFC East1612400.75055733112.20.5559.44356.040.7747
2012New York JetsnyjAFC East1661000.375281375-5.1-0.9282.64378.440.3267
2012Baltimore RavensravAFC North1610600.6253983441.91.0394.64348.040.5819
2012Cincinnati BengalscinAFC North1610600.6253913201.20.9383.44349.640.5606
2012Cleveland BrownscleAFC North1651100.313302368-4.6-0.7290.64375.240.3467
2012Pittsburgh SteelerspitAFC North168800.500336314-2.82.1319.44330.440.4806
2012Houston TexanshtxAFC South1612400.7504163311.81.7393.04336.840.5993
2012Indianapolis ColtscltAFC South1611500.688357387-1.9-2.8333.84408.840.3740
2012Jacksonville JaguarsjaxAFC South1621400.125255444-8.1-4.9234.64442.440.1700
2012Tennessee TitansotiAFC South1661000.375330471-2.6-7.4322.64482.440.2595
2012Denver BroncosdenAFC West1613300.8134812896.33.8465.04303.240.7539
2012Kansas City ChiefskanAFC West1621400.125211425-10.3-3.7199.44423.240.1368
2012Oakland RaidersraiAFC West1641200.250290443-4.6-6.2290.64463.240.2322
2012San Diego ChargerssdgAFC West167900.438350350-2.0-0.4332.24370.440.4329
2012Dallas CowboysdalNFC East168800.5003764001.4-1.2386.64383.240.5074
2012New York GiantsnygNFC East169700.5634293444.02.2428.24328.840.6662
2012Philadelphia EaglesphiNFC East1641200.250280444-5.3-3.6279.44421.640.2619
2012Washington RedskinswasNFC East1610600.6254363884.6-1.2437.84383.240.5887
2012Chicago BearschiNFC North1610600.6253752771.06.0380.24268.040.7066
2012Detroit LionsdetNFC North1641200.2503724372.1-4.4397.84434.440.4436
2012Green Bay PackersgnbNFC North1611500.6884333364.92.4442.64325.640.6911
2012Minnesota VikingsminNFC North1610600.6253793481.61.8389.84335.240.5971
2012Atlanta FalconsatlNFC South1613300.8134192992.04.5396.24292.040.6855
2012Carolina PantherscarNFC South167900.438357363-0.51.3356.24343.240.5252
2012New Orleans SaintsnorNFC South167900.4384614546.5-5.1468.24445.640.5351
2012Tampa Bay BuccaneerstamNFC South167900.4383893941.3-1.3385.04384.840.5020
2012Arizona CardinalscrdNFC West1651100.313250357-4.81.6287.44338.440.4022
2012San Francisco 49erssfoNFC West1611410.7193972733.56.7420.24256.840.7772
2012Seattle SeahawksseaNFC West1611500.6884122454.57.7436.24240.840.8186
2012St. Louis RamsramNFC West167810.469299348-2.12.4330.64325.640.5112
2011Buffalo BillsbufAFC East1661000.3753724341.2-4.5374.03426.930.4200
2011Miami DolphinsmiaAFC East1661000.375329313-2.23.2319.63303.730.5374
2011New England PatriotsnweAFC East1613300.8135133429.4-0.1505.23356.530.7234
2011New York JetsnyjAFC East168800.5003773631.2-0.3374.03359.730.5310
2011Baltimore RavensravAFC North1612400.7503782662.63.5396.43298.930.6776
2011Cincinnati BengalscinAFC North169700.5633443230.7-0.2366.03358.130.5199
2011Cleveland BrownscleAFC North1641200.250218307-7.21.8239.63326.130.3284
2011Pittsburgh SteelerspitAFC North1612400.750325227-0.86.0342.03258.930.6698
2011Houston TexanshtxAFC South1610600.6253812781.43.2377.23303.730.6393
2011Indianapolis ColtscltAFC South1621400.125243430-6.0-5.3258.83439.730.2127
2011Jacksonville JaguarsjaxAFC South1651100.313243329-7.11.4241.23332.530.3212
2011Tennessee TitansotiAFC South169700.563325317-2.21.2319.63335.730.4753
2011Denver BroncosdenAFC West168800.500309390-3.6-1.7297.23382.130.3527
2011Kansas City ChiefskanAFC West167900.438212338-10.22.1191.63321.330.2347
2011Oakland RaidersraiAFC West168800.5003594330.2-5.1358.03436.530.3790
2011San Diego ChargerssdgAFC West168800.5004063772.7-1.8398.03383.730.5298
2011Dallas CowboysdalNFC East168800.5003693470.70.9366.03340.530.5518
2011New York GiantsnygNFC East169700.5633944003.1-1.5404.43378.930.5484
2011Philadelphia EaglesphiNFC East168800.5003963283.11.7404.43327.730.6377
2011Washington RedskinswasNFC East1651100.313288367-4.30.2286.03351.730.3804
2011Chicago BearschiNFC North168800.500353341-1.53.1330.83305.330.5555
2011Detroit LionsdetNFC North1610600.6254743876.9-0.8465.23367.730.6569
2011Green Bay PackersgnbNFC North1615100.93856035911.5-0.1538.83356.530.7589
2011Minnesota VikingsminNFC North1631300.188340449-1.6-4.1329.23420.530.3530
2011Atlanta FalconsatlNFC South1610600.6254023501.81.7383.63327.730.6050
2011Carolina PantherscarNFC South1661000.3754064292.6-3.9396.43417.330.4722
2011New Orleans SaintsnorNFC South1613300.81354733910.60.8524.43342.130.7642
2011Tampa Bay BuccaneerstamNFC South1641200.250287494-4.0-6.6290.83460.530.2397
2011Arizona CardinalscrdNFC West168800.500312348-1.7-0.5327.63362.930.4416
2011San Francisco 49erssfoNFC West1613300.8133802291.76.6382.03249.330.7479
2011Seattle SeahawksseaNFC West167900.438321315-0.51.3346.83334.130.5295
2011St. Louis RamsramNFC West1621400.125193407-8.4-2.1220.43388.530.2053
2010Buffalo BillsbufAFC East1641200.250283425-1.5-3.1328.74402.040.3740
2010Miami DolphinsmiaAFC East167900.438273333-2.83.1307.94302.840.5106
2010New England PatriotsnweAFC East1614200.87551831312.62.8554.34307.640.8287
2010New York JetsnyjAFC East1611500.6883673042.24.2387.94285.240.6846
2010Baltimore RavensravAFC North1612400.7503572700.95.5367.14264.440.6929
2010Cincinnati BengalscinAFC North1641200.2503223950.4-1.9359.14382.840.4593
2010Cleveland BrownscleAFC North1651100.313271332-3.42.0298.34320.440.4565
2010Pittsburgh SteelerspitAFC North1612400.7503752322.57.7392.74229.240.7908
2010Houston TexanshtxAFC South1661000.3753904271.8-3.7381.54411.640.4508
2010Indianapolis ColtscltAFC South1610600.6254353883.7-0.9411.94366.840.5753
2010Jacksonville JaguarsjaxAFC South168800.500353419-1.2-3.3333.54405.240.3777
2010Tennessee TitansotiAFC South1661000.375356339-0.91.9338.34322.040.5312
2010Denver BroncosdenAFC West1641200.250344471-1.1-7.8335.14477.240.2831
2010Kansas City ChiefskanAFC West1610600.625366326-1.50.8328.74339.640.4799
2010Oakland RaidersraiAFC West168800.5004103712.3-2.2389.54387.640.5035
2010San Diego ChargerssdgAFC West169700.5634413223.21.6403.94326.840.6330
2010Dallas CowboysdalNFC East1661000.3753944362.5-4.7392.74427.640.4444
2010New York GiantsnygNFC East1610600.6253943471.70.4379.94346.040.5599
2010Philadelphia EaglesphiNFC East1610600.6254393775.4-1.2439.14371.640.6085
2010Washington RedskinswasNFC East1661000.375302377-3.4-0.5298.34360.440.3843
2010Chicago BearschiNFC North1611500.688334286-0.64.7343.14277.240.6288
2010Detroit LionsdetNFC North1661000.3753623692.4-0.5391.14360.440.5530
2010Green Bay PackersgnbNFC North1610600.6253882403.17.9402.34226.040.8065
2010Minnesota VikingsminNFC North1661000.375281348-3.31.7299.94325.240.4505
2010Atlanta FalconsatlNFC South1613300.8134142883.82.2413.54317.240.6641
2010Carolina PantherscarNFC South1621400.125196408-9.1-4.1207.14418.040.1505
2010New Orleans SaintsnorNFC South1611500.6883843071.50.8376.74339.640.5661
2010Tampa Bay BuccaneerstamNFC South1610600.625341318-1.00.4336.74346.040.4832
2010Arizona CardinalscrdNFC West1651100.313289434-5.6-7.1263.14466.040.1879
2010San Francisco 49erssfoNFC West1661000.375305346-4.7-1.1277.54370.040.3285
2010Seattle SeahawksseaNFC West167900.438310407-3.9-5.5290.34440.440.2559
2010St. Louis RamsramNFC West167900.438289328-6.3-0.4251.94358.840.2960
2009Buffalo BillsbufAFC East1661000.375258326-4.52.7271.47300.270.4395
2009Miami DolphinsmiaAFC East167900.4383603902.9-1.2389.87362.670.5466
2009New England PatriotsnweAFC East1610600.6254272856.74.5450.67271.470.7853
2009New York JetsnyjAFC East169700.5633482361.17.5361.07223.470.7623
2009Baltimore RavensravAFC North169700.5633912612.64.9385.07265.070.7173
2009Cincinnati BengalscinAFC North1610600.625305291-2.53.2303.47292.270.5230
2009Cleveland BrownscleAFC North1651100.313245375-6.0-2.4247.47381.870.2549
2009Pittsburgh SteelerspitAFC North169700.5633683241.00.7359.47332.270.5497
2009Houston TexanshtxAFC South169700.5633883332.7-0.7386.67354.670.5554
2009Indianapolis ColtscltAFC South1614200.8754163074.41.5413.87319.470.6604
2009Jacksonville JaguarsjaxAFC South167900.438290380-3.8-2.6282.67385.070.3153
2009Tennessee TitansotiAFC South168800.5003544020.9-3.6357.87401.070.4268
2009Denver BroncosdenAFC West168800.500326324-1.01.3327.47322.670.5092
2009Kansas City ChiefskanAFC West1641200.250294424-2.5-5.9303.47437.870.2801
2009Oakland RaidersraiAFC West1651100.313197379-8.7-1.6204.27369.070.1932
2009San Diego ChargerssdgAFC West1613300.8134543206.40.2445.87340.270.6696
2009Dallas CowboysdalNFC East1611500.6883612500.46.7349.87236.270.7220
2009New York GiantsnygNFC East168800.5004024274.6-4.5417.07415.470.5026
2009Philadelphia EaglesphiNFC East1611500.6884293375.80.2436.27340.270.6564
2009Washington RedskinswasNFC East1641200.250266336-5.51.0255.47327.470.3538
2009Chicago BearschiNFC North167900.438327375-1.9-2.0313.07375.470.3871
2009Detroit LionsdetNFC North1621400.125262494-5.2-9.2260.27490.670.1628
2009Green Bay PackersgnbNFC North1611500.6884612976.31.1444.27325.870.6912
2009Minnesota VikingsminNFC North1612400.7504703126.60.6449.07333.870.6844
2009Atlanta FalconsatlNFC South169700.5633633252.72.3386.67306.670.6427
2009Carolina PantherscarNFC South168800.500315308-0.64.5333.87271.470.6241
2009New Orleans SaintsnorNFC South1613300.81351034111.2-0.5522.67351.470.7435
2009Tampa Bay BuccaneerstamNFC South1631300.188244400-4.6-1.1269.87361.070.3273
2009Arizona CardinalscrdNFC West1610600.6253753250.1-0.4345.07349.870.4913
2009San Francisco 49erssfoNFC West168800.500330281-2.93.0297.07295.470.5033
2009Seattle SeahawksseaNFC West1651100.313280390-5.0-4.4263.47413.870.2429
2009St. Louis RamsramNFC West1611500.063175436-11.7-5.8156.27436.270.0758
2008Buffalo BillsbufAFC East167900.438336342-2.8-0.6307.67362.070.3972
2008Miami DolphinsmiaAFC East1611500.688345317-2.41.8314.07323.670.4794
2008New England PatriotsnweAFC East1611500.6884103092.31.6389.27326.870.6078
2008New York JetsnyjAFC East169700.5634053562.2-1.9387.67382.870.5062
2008Baltimore RavensravAFC North1611500.6883852444.25.6419.67262.870.7631
2008Cincinnati BengalscinAFC North1641110.281204364-6.9-0.1242.07354.070.2814
2008Cleveland BrownscleAFC North1641200.250232350-5.20.6269.27342.870.3539
2008Pittsburgh SteelerspitAFC North1612400.7503472231.68.2378.07221.270.7854
2008Houston TexanshtxAFC South168800.5003663942.8-3.2397.27403.670.4876
2008Indianapolis ColtscltAFC South1612400.7503772982.63.9394.07290.070.6823
2008Jacksonville JaguarsjaxAFC South1651100.313302367-2.1-0.4318.87358.870.4242
2008Tennessee TitansotiAFC South1613300.8133752341.57.5376.47232.470.7635
2008Denver BroncosdenAFC West168800.5003704480.7-6.5363.67456.470.3524
2008Kansas City ChiefskanAFC West1621400.125291440-3.9-5.3290.07437.270.2569
2008Oakland RaidersraiAFC West1651100.313263388-6.5-1.0248.47368.470.2730
2008San Diego ChargerssdgAFC West168800.5004393475.00.0432.47352.470.6285
2008Dallas CowboysdalNFC East169700.5633623651.7-1.2379.67371.670.5118
2008New York GiantsnygNFC East1612400.7504272945.52.8440.47307.670.7143
2008Philadelphia EaglesphiNFC East169610.5944162894.73.2427.67301.270.7087
2008Washington RedskinswasNFC East168800.500265296-5.84.1259.67286.870.4389
2008Chicago BearschiNFC North169700.5633753501.11.0370.07336.470.5583
2008Detroit LionsdetNFC North1601600.000268517-4.0-9.1288.47498.070.1916
2008Green Bay PackersgnbNFC North1661000.3754193804.1-1.2418.07371.670.5744
2008Minnesota VikingsminNFC North1610600.6253793331.12.9370.07306.070.6153
2008Atlanta FalconsatlNFC South1611500.6883913251.32.5373.27312.470.6085
2008Carolina PantherscarNFC South1612400.7504143292.82.9397.27306.070.6580
2008New Orleans SaintsnorNFC South168800.5004633936.8-2.8461.27397.270.5965
2008Tampa Bay BuccaneerstamNFC South169700.563361323-0.62.9342.87306.070.5683
2008Arizona CardinalscrdNFC West169700.5634274264.1-6.0418.07448.470.4512
2008San Francisco 49erssfoNFC West167900.438339381-2.9-2.4306.07390.870.3478
2008Seattle SeahawksseaNFC West1641200.250294392-4.9-2.8274.07397.270.2804
2008St. Louis RamsramNFC West1621400.125232465-8.1-7.0222.87464.470.1332
2007Buffalo BillsbufAFC East167900.438252354-5.61.5257.55322.950.3735
2007Miami DolphinsmiaAFC East1611500.063267437-4.1-4.2281.55414.150.2805
2007New England PatriotsnweAFC East1616001.00058927415.94.2601.55279.750.8940
2007New York JetsnyjAFC East1641200.250268355-4.00.3283.15342.150.3926
2007Baltimore RavensravAFC North1651100.313275384-5.0-1.8267.15375.750.3072
2007Cincinnati BengalscinAFC North167900.4383803851.6-4.0372.75410.950.4440
2007Cleveland BrownscleAFC North1610600.6254023822.2-3.3382.35399.750.4783
2007Pittsburgh SteelerspitAFC North1610600.6253932690.94.3361.55278.150.6646
2007Houston TexanshtxAFC South168800.5003793842.5-2.5387.15386.950.5076
2007Indianapolis ColtscltAFC South1613300.8134502626.65.4452.75260.550.8110
2007Jacksonville JaguarsjaxAFC South1611500.6884113044.82.0423.95314.950.6897
2007Tennessee TitansotiAFC South1610600.625301297-2.93.6300.75289.350.5308
2007Denver BroncosdenAFC West167900.438320409-0.2-3.8343.95407.750.3991
2007Kansas City ChiefskanAFC West1641200.250226335-7.41.9228.75316.550.3226
2007Oakland RaidersraiAFC West1641200.250283398-3.5-2.5291.15386.950.3355
2007San Diego ChargerssdgAFC West1611500.6884122844.34.5415.95274.950.7476
2007Dallas CowboysdalNFC East1613300.8134553257.81.7471.95319.750.7421
2007New York GiantsnygNFC East1610600.6253733512.80.4391.95340.550.5966
2007Philadelphia EaglesphiNFC East168800.5003363000.15.1348.75265.350.6692
2007Washington RedskinswasNFC East169700.5633343100.24.3350.35278.150.6462
2007Chicago BearschiNFC North167900.438334348-0.21.4343.95324.550.5437
2007Detroit LionsdetNFC North167900.4383464441.4-5.0369.55426.950.4138
2007Green Bay PackersgnbNFC North1613300.8134352915.73.3438.35294.150.7431
2007Minnesota VikingsminNFC North168800.5003653111.42.4369.55308.550.6190
2007Atlanta FalconsatlNFC South1641200.250259414-5.8-4.8254.35423.750.2239
2007Carolina PantherscarNFC South167900.438267347-5.7-0.1255.95348.550.3268
2007New Orleans SaintsnorNFC South167900.4383793881.9-4.5377.55418.950.4396
2007Tampa Bay BuccaneerstamNFC South169700.563334270-2.33.6310.35289.350.5500
2007Arizona CardinalscrdNFC West168800.5004043991.9-5.9377.55441.350.4057
2007San Francisco 49erssfoNFC West1651100.313219364-9.9-2.0188.75378.950.1643
2007Seattle SeahawksseaNFC West1610600.6253932910.80.9359.95332.550.5573
2007St. Louis RamsramNFC West1631300.188263438-6.5-6.5243.15450.950.1803
2006Buffalo BillsbufAFC East167900.438300311-0.22.4327.33292.080.5747
2006Miami DolphinsmiaAFC East1661000.375260283-3.34.0277.73266.480.5296
2006New England PatriotsnweAFC East1612400.7503852374.35.9399.33236.080.7913
2006New York JetsnyjAFC East1610600.6253162950.41.7336.93303.280.5699
2006Baltimore RavensravAFC North1613300.8133532011.57.8354.53205.680.7922
2006Cincinnati BengalscinAFC North168800.5003733314.00.0394.53330.480.6165
2006Cleveland BrownscleAFC North1641200.250238356-4.5-1.3258.53351.280.3253
2006Pittsburgh SteelerspitAFC North168800.5003533153.00.4378.53324.080.6024
2006Houston TexanshtxAFC South1661000.375267366-3.2-1.3279.33351.280.3669
2006Indianapolis ColtscltAFC South1612400.7504273606.9-1.1440.93348.080.6548
2006Jacksonville JaguarsjaxAFC South168800.5003712742.64.9372.13252.080.7284
2006Tennessee TitansotiAFC South168800.5003244001.0-2.3346.53367.280.4680
2006Denver BroncosdenAFC West169700.563319305-0.82.1317.73296.880.5466
2006Kansas City ChiefskanAFC West169700.5633313150.40.6336.93320.880.5355
2006Oakland RaidersraiAFC West1621400.125168332-10.30.7165.73319.280.1843
2006San Diego ChargerssdgAFC West1614200.87549230310.00.2490.53327.280.7491
2006Dallas CowboysdalNFC East169700.5634253505.0-1.3410.53351.280.6047
2006New York GiantsnygNFC East168800.5003553621.2-1.1349.73348.080.5080
2006Philadelphia EaglesphiNFC East1610600.6253983283.20.2381.73327.280.6017
2006Washington RedskinswasNFC East1651100.313307376-2.1-2.0296.93362.480.3828
2006Chicago BearschiNFC North1613300.8134272554.93.0408.93282.480.7233
2006Detroit LionsdetNFC North1631300.188305398-1.8-4.6301.73404.080.3273
2006Green Bay PackersgnbNFC North168800.500301366-2.3-2.1293.73364.080.3739
2006Minnesota VikingsminNFC North1661000.375282327-3.7-0.4271.33336.880.3754
2006Atlanta FalconsatlNFC South167900.438292328-2.8-0.2285.73333.680.4106
2006Carolina PantherscarNFC South168800.500270305-4.21.5263.33306.480.4145
2006New Orleans SaintsnorNFC South1610600.6254133224.9-0.9408.93344.880.6134
2006Tampa Bay BuccaneerstamNFC South1641200.250211353-7.2-0.8215.33343.280.2510
2006Arizona CardinalscrdNFC West1651100.313314389-2.6-4.3288.93399.280.3112
2006San Francisco 49erssfoNFC West167900.438298412-3.5-5.2274.53413.680.2668
2006Seattle SeahawksseaNFC West169700.563335341-1.6-1.9304.93360.880.4009
2006St. Louis RamsramNFC West168800.5003673810.8-4.7343.33405.680.3989
2005Buffalo BillsbufAFC East1651100.313271367-4.0-1.8265.68358.630.3255
2005Miami DolphinsmiaAFC East169700.563318317-1.10.3312.08325.030.4774
2005New England PatriotsnweAFC East1610600.6253793383.7-0.5388.88337.830.5918
2005New York JetsnyjAFC East1641200.250240355-5.2-1.2246.48349.030.3023
2005Baltimore RavensravAFC North1661000.375265299-3.51.7273.68302.630.4420
2005Cincinnati BengalscinAFC North1611500.6884213506.5-2.7433.68373.030.6003
2005Cleveland BrownscleAFC North1661000.375232301-6.01.7233.68302.630.3536
2005Pittsburgh SteelerspitAFC North1611500.6883892583.84.0390.48265.830.7259
2005Houston TexanshtxAFC South1621400.125260431-4.4-5.7259.28421.030.2301
2005Indianapolis ColtscltAFC South1614200.8754392475.65.2419.28246.630.7935
2005Jacksonville JaguarsjaxAFC South1612400.7503612691.13.7347.28270.630.6514
2005Tennessee TitansotiAFC South1641200.250299421-2.0-5.5297.68417.830.2988
2005Denver BroncosdenAFC West1613300.8133952585.05.8409.68237.030.7987
2005Kansas City ChiefskanAFC West1610600.6254033255.11.9411.28299.430.6944
2005Oakland RaidersraiAFC West1641200.250290383-1.2-1.6310.48355.430.4186
2005San Diego ChargerssdgAFC West169700.5634183127.12.9443.28283.430.7614
2005Dallas CowboysdalNFC East169700.563325308-0.13.2328.08278.630.6014
2005New York GiantsnygNFC East1611500.6884223145.81.7422.48302.630.7041
2005Philadelphia EaglesphiNFC East1661000.375310388-0.6-1.7320.08357.030.4342
2005Washington RedskinswasNFC East1610600.6253592932.63.4371.28275.430.6803
2005Chicago BearschiNFC North1611500.688260202-5.26.6246.48224.230.5568
2005Detroit LionsdetNFC North1651100.313254345-4.3-2.4260.88368.230.3015
2005Green Bay PackersgnbNFC North1641200.250298344-1.5-2.2305.68365.030.3929
2005Minnesota VikingsminNFC North169700.563306344-1.4-2.1307.28363.430.3987
2005Atlanta FalconsatlNFC South168800.5003513411.1-2.3347.28366.630.4681
2005Carolina PantherscarNFC South1611500.6883912593.02.1377.68296.230.6507
2005New Orleans SaintsnorNFC South1631300.188235398-6.2-4.9230.48408.230.1974
2005Tampa Bay BuccaneerstamNFC South1611500.688300274-2.81.8284.88301.030.4691
2005Arizona CardinalscrdNFC West1651100.313311387-2.0-3.0297.68377.830.3569
2005San Francisco 49erssfoNFC West1641200.250239428-5.6-5.5240.08417.830.2027
2005Seattle SeahawksseaNFC West1613300.8134522715.83.4422.48275.430.7501
2005St. Louis RamsramNFC West1661000.3753634291.3-6.4350.48432.230.3691
2004Buffalo BillsbufAFC East169700.5633952844.63.5417.40287.800.7239
2004Miami DolphinsmiaAFC East1641200.250275354-2.70.5300.60335.800.4354
2004New England PatriotsnweAFC East1614200.8754372606.36.5444.60239.800.8298
2004New York JetsnyjAFC East1610600.6253332610.56.0351.80247.800.7056
2004Baltimore RavensravAFC North169700.563317268-0.66.8334.20235.000.7041
2004Cincinnati BengalscinAFC North168800.5003743724.3-1.6412.60369.400.5753
2004Cleveland BrownscleAFC North1641200.250276390-1.5-1.9319.80374.200.4054
2004Pittsburgh SteelerspitAFC North1615100.9383722513.45.6398.20254.200.7576
2004Houston TexanshtxAFC South167900.438309339-2.41.8305.40315.000.4846
2004Indianapolis ColtscltAFC South1612400.75052235111.7-0.3531.00348.600.7595
2004Jacksonville JaguarsjaxAFC South169700.563261280-5.76.4252.60241.400.5300
2004Tennessee TitansotiAFC South1651100.3133444390.3-4.6348.60417.400.3888
2004Denver BroncosdenAFC West1610600.6253813041.64.3369.40275.000.6794
2004Kansas City ChiefskanAFC West167900.43848343510.0-4.7503.80419.000.6263
2004Oakland RaidersraiAFC West1651100.313320442-0.6-3.7334.20403.000.3856
2004San Diego ChargerssdgAFC West1612400.7504463136.13.0441.40295.800.7404
2004Dallas CowboysdalNFC East1661000.375293405-3.0-4.8295.80420.600.2930
2004New York GiantsnygNFC East1661000.375303347-2.3-1.6307.00369.400.3893
2004Philadelphia EaglesphiNFC East1613300.8133862602.03.5375.80287.800.6648
2004Washington RedskinswasNFC East1661000.375240265-7.44.0225.40279.800.3797
2004Chicago BearschiNFC North1651100.313231331-8.50.3207.80339.000.2407
2004Detroit LionsdetNFC North1661000.375296350-3.8-1.4283.00366.200.3484
2004Green Bay PackersgnbNFC North1610600.6254243804.3-4.0412.60407.800.5114
2004Minnesota VikingsminNFC North168800.5004053953.0-4.7391.80419.000.4596
2004Atlanta FalconsatlNFC South1611500.688340337-1.8-0.4315.00350.200.4376
2004Carolina PantherscarNFC South167900.438355339-0.80.1331.00342.200.4827
2004New Orleans SaintsnorNFC South168800.500348405-1.2-4.3324.60412.600.3541
2004Tampa Bay BuccaneerstamNFC South1651100.313301304-4.01.3279.80323.000.4167
2004Arizona CardinalscrdNFC West1661000.375284322-5.00.2263.80340.600.3521
2004San Francisco 49erssfoNFC West1621400.125259452-5.1-8.6262.20481.400.1765
2004Seattle SeahawksseaNFC West169700.5633713730.4-3.3350.20396.600.4241
2004St. Louis RamsramNFC West168800.500319392-2.2-3.8308.60404.600.3375
2003Buffalo BillsbufAFC East1661000.375243279-5.04.0253.26269.360.4670
2003Miami DolphinsmiaAFC East1610600.625311261-0.74.1322.06267.760.6138
2003New England PatriotsnweAFC East1614200.8753482382.14.9366.86254.960.7137
2003New York JetsnyjAFC East1661000.375283299-1.91.3302.86312.560.4840
2003Baltimore RavensravAFC North1610600.6253912813.33.0386.06285.360.6846
2003Cincinnati BengalscinAFC North168800.5003463841.1-3.5350.86389.360.4367
2003Cleveland BrownscleAFC North1651100.313254322-5.32.4248.46294.960.4024
2003Pittsburgh SteelerspitAFC North1661000.375300327-2.51.4293.26310.960.4675
2003Houston TexanshtxAFC South1651100.313255380-4.4-1.5262.86357.360.3227
2003Indianapolis ColtscltAFC South1612400.7504473368.2-1.2464.46352.560.6775
2003Jacksonville JaguarsjaxAFC South1651100.313276331-3.30.9280.46318.960.4254
2003Tennessee TitansotiAFC South1612400.7504353247.0-0.5445.26341.360.6703
2003Denver BroncosdenAFC West1610600.6253813012.43.1371.66283.760.6658
2003Kansas City ChiefskanAFC West1613300.8134843329.2-0.9480.46347.760.7050
2003Oakland RaidersraiAFC West1641200.250270379-4.2-1.3266.06354.160.3341
2003San Diego ChargerssdgAFC West1641200.250313441-0.6-6.2323.66432.560.3241
2003Dallas CowboysdalNFC East1610600.625289260-3.22.7282.06290.160.4863
2003New York GiantsnygNFC East1641200.250243387-4.8-3.7256.46392.560.2605
2003Philadelphia EaglesphiNFC East1612400.7503742872.91.5379.66309.360.6300
2003Washington RedskinswasNFC East1651100.313287372-1.9-3.8302.86394.160.3422
2003Chicago BearschiNFC North167900.438283346-4.20.7266.06322.160.3891
2003Detroit LionsdetNFC North1651100.313270379-4.3-1.6264.46358.960.3233
2003Green Bay PackersgnbNFC North1610600.6254423076.21.9432.46302.960.7173
2003Minnesota VikingsminNFC North169700.5634163534.0-1.1397.26350.960.5826
2003Atlanta FalconsatlNFC South1651100.313299422-2.0-5.4301.26419.760.3031
2003Carolina PantherscarNFC South1611500.688325304-1.50.6309.26323.760.4750
2003New Orleans SaintsnorNFC South168800.5003403260.1-0.4334.86339.760.4942
2003Tampa Bay BuccaneerstamNFC South167900.438301264-2.94.5286.86261.360.5587
2003Arizona CardinalscrdNFC West1641200.250225452-6.3-6.2232.46432.560.1774
2003San Francisco 49erssfoNFC West167900.4383843373.00.1381.26331.760.5911
2003Seattle SeahawksseaNFC West1610600.6254043273.60.5390.86325.360.6183
2003St. Louis RamsramNFC West1612400.7504473286.0-0.2429.26336.560.6562
2002Buffalo BillsbufAFC East168800.5003793972.1-2.3380.43383.580.4952
2002Miami DolphinsmiaAFC East169700.5633783011.74.4374.03276.380.6807
2002New England PatriotsnweAFC East169700.5633813462.11.9380.43316.380.6154
2002New York JetsnyjAFC East169700.5633593360.92.3361.23309.980.5955
2002Baltimore RavensravAFC North167900.438316354-1.5-0.6322.83356.380.4386
2002Cincinnati BengalscinAFC North1621400.125279456-3.6-6.9289.23457.180.2355
2002Cleveland BrownscleAFC North169700.563344320-0.41.7340.43319.580.5400
2002Pittsburgh SteelerspitAFC North1610510.6563903453.1-0.4396.43353.180.5746
2002Houston TexanshtxAFC South1641200.250213356-8.4-1.1212.43364.380.2137
2002Indianapolis ColtscltAFC South1610600.6253493130.40.7353.23335.580.5329
2002Jacksonville JaguarsjaxAFC South1661000.375328315-1.31.1326.03329.180.4946
2002Tennessee TitansotiAFC South1611500.6883673241.60.1372.43345.180.5490
2002Denver BroncosdenAFC West169700.5633923443.01.9394.83316.380.6381
2002Kansas City ChiefskanAFC West168800.5004673998.4-2.3481.23383.580.6478
2002Oakland RaidersraiAFC West1611500.6884503046.34.3447.63277.980.7727
2002San Diego ChargerssdgAFC West168800.500333367-1.00.2330.83343.580.4768
2002Dallas CowboysdalNFC East1651100.313217329-8.2-0.3215.63351.580.2359
2002New York GiantsnygNFC East1610600.625320279-2.23.0311.63298.780.5264
2002Philadelphia EaglesphiNFC East1612400.7504152414.53.8418.83285.980.7258
2002Washington RedskinswasNFC East167900.438307365-2.2-2.2311.63381.980.3745
2002Chicago BearschiNFC North1641200.250281379-4.4-0.9276.43361.180.3405
2002Detroit LionsdetNFC North1631300.188306451-2.5-6.7306.83453.980.2665
2002Green Bay PackersgnbNFC North1612400.7503983282.41.2385.23327.580.6025
2002Minnesota VikingsminNFC North1661000.3753904423.1-6.1396.43444.380.4253
2002Atlanta FalconsatlNFC South169610.5944023143.51.5402.83322.780.6388
2002Carolina PantherscarNFC South167900.438258302-6.02.8250.83301.980.3913
2002New Orleans SaintsnorNFC South169700.5634323885.8-3.3439.63399.580.5636
2002Tampa Bay BuccaneerstamNFC South1612400.750346196-1.09.8330.83189.980.7880
2002Arizona CardinalscrdNFC West1651100.313262417-5.4-4.5260.43418.780.2326
2002San Francisco 49erssfoNFC West1610600.6253673510.7-0.1358.03348.380.5180
2002Seattle SeahawksseaNFC West167900.4383553690.0-1.2346.83365.980.4664
2002St. Louis RamsramNFC West167900.438316369-1.6-1.8321.23375.580.4028
2001Baltimore RavensravAFC Central1610600.625303265-0.84.0310.61259.410.6059
2001Cincinnati BengalscinAFC Central1661000.375226309-4.51.0251.41307.410.3804
2001Cleveland BrownscleAFC Central167900.438285319-0.90.1309.01321.810.4738
2001Jacksonville JaguarsjaxAFC Central1661000.375294286-1.12.0305.81291.410.5283
2001Pittsburgh SteelerspitAFC Central1613300.8133522121.55.8347.41230.610.7284
2001Tennessee TitansotiAFC Central167900.4383363882.4-4.4361.81393.810.4443
2001Buffalo BillsbufAFC East1631300.188265420-3.9-5.7261.01414.610.2367
2001Indianapolis ColtscltAFC East1661000.3754134866.1-9.8421.01480.210.4109
2001Miami DolphinsmiaAFC East1611500.688344290-0.33.1318.61273.810.5902
2001New England PatriotsnweAFC East1611500.6883712721.23.1342.61273.810.6334
2001New York JetsnyjAFC East1610600.625308295-2.02.8291.41278.610.5260
2001Denver BroncosdenAFC West168800.5003403390.5-1.0331.41339.410.4839
2001Kansas City ChiefskanAFC West1661000.375320344-0.2-1.0320.21339.410.4625
2001Oakland RaidersraiAFC West1610600.6253993274.0-0.4387.41329.810.6002
2001San Diego ChargerssdgAFC West1651100.3133323210.3-0.6328.21333.010.4898
2001Seattle SeahawksseaAFC West169700.563301324-1.4-0.4301.01329.810.4426
2001Chicago BearschiNFC Central1613300.8133382030.87.1336.21209.810.7540
2001Detroit LionsdetNFC Central1621400.125270424-2.0-5.2291.41406.610.2993
2001Green Bay PackersgnbNFC Central1612400.7503902664.02.6387.41281.810.6887
2001Minnesota VikingsminNFC Central1651100.313290390-0.8-3.9310.61385.810.3648
2001Tampa Bay BuccaneerstamNFC Central169700.5633242800.73.3334.61270.610.6260
2001Arizona CardinalscrdNFC East167900.438295343-1.5-2.6299.41365.010.3772
2001Dallas CowboysdalNFC East1651100.313246338-4.5-1.5251.41347.410.3110
2001New York GiantsnygNFC East167900.438294321-1.80.0294.61323.410.4417
2001Philadelphia EaglesphiNFC East1611500.6883432080.96.8337.81214.610.7466
2001Washington RedskinswasNFC East168800.500256303-4.00.4259.41317.010.3799
2001Atlanta FalconsatlNFC West167900.438291377-2.7-2.0280.21355.410.3557
2001Carolina PantherscarNFC West1611500.063253410-4.6-4.4249.81393.810.2427
2001New Orleans SaintsnorNFC West167900.438333409-0.1-4.7321.81398.610.3654
2001San Francisco 49erssfoNFC West1612400.7504092824.22.7390.61280.210.6962
2001St. Louis RamsramNFC West1614200.87550327310.42.9489.81277.010.8134
2000Baltimore RavensravAFC Central1612400.7503331650.08.0330.72202.830.7587
2000Cincinnati BengalscinAFC Central1641200.250185359-8.1-2.4201.12369.230.1847
2000Cleveland BrownscleAFC Central1631300.188161419-9.1-5.5185.12418.830.1165
2000Jacksonville JaguarsjaxAFC Central167900.4383673273.2-2.1381.92364.430.5274
2000Pittsburgh SteelerspitAFC Central169700.5633212550.63.3340.32278.030.6191
2000Tennessee TitansotiAFC Central1613300.8133461911.56.8354.72222.030.7537
2000Buffalo BillsbufAFC East168800.5003153500.5-0.5338.72338.830.4970
2000Indianapolis ColtscltAFC East1610600.6254293267.10.8444.32318.030.7013
2000Miami DolphinsmiaAFC East1611500.6883232260.07.1330.72217.230.7291
2000New England PatriotsnweAFC East1651100.313276338-2.70.2287.52327.630.4176
2000New York JetsnyjAFC East169700.5633213211.42.2353.12295.630.6061
2000Denver BroncosdenAFC West1611500.6884853697.8-2.7455.52374.030.6247
2000Kansas City ChiefskanAFC West167900.4383553540.10.6332.32321.230.5183
2000Oakland RaidersraiAFC West1612400.7504792998.01.8458.72302.030.7442
2000San Diego ChargerssdgAFC West1611500.063269440-3.7-4.4271.52401.230.2697
2000Seattle SeahawksseaAFC West1661000.375320405-1.4-2.3308.32367.630.3882
2000Chicago BearschiNFC Central1651100.313216355-6.40.1228.32329.230.2907
2000Detroit LionsdetNFC Central169700.563307307-0.11.5329.12306.830.5405
2000Green Bay PackersgnbNFC Central169700.5633533231.80.7359.52319.630.5707
2000Minnesota VikingsminNFC Central1611500.6883973714.3-2.3399.52367.630.5510
2000Tampa Bay BuccaneerstamNFC Central1610600.6253882693.43.9385.12268.430.7083
2000Arizona CardinalscrdNFC East1631300.188210443-7.2-8.1215.52460.430.1261
2000Dallas CowboysdalNFC East1651100.313294361-1.5-3.0306.72378.830.3669
2000New York GiantsnygNFC East1612400.750328246-1.33.8309.92270.030.5799
2000Philadelphia EaglesphiNFC East1611500.6883512451.02.1346.72297.230.5918
2000Washington RedskinswasNFC East168800.500281269-2.93.8284.32270.030.5280
2000Atlanta FalconsatlNFC West1641200.250252413-5.7-2.9239.52377.230.2436
2000Carolina PantherscarNFC West167900.438310310-3.62.5273.12290.830.4594
2000New Orleans SaintsnorNFC West1610600.625354305-1.22.1311.52297.230.5259
2000San Francisco 49erssfoNFC West1661000.3753884221.7-5.5357.92418.830.3962
2000St. Louis RamsramNFC West1610600.62554047112.6-9.5532.32482.830.5646
1999Baltimore RavensravAFC Central168800.500324277-1.62.5307.43293.080.5251
1999Cincinnati BengalscinAFC Central1641200.250283460-3.3-8.2280.23464.280.2099
1999Cleveland BrownscleAFC Central1621400.125217437-7.6-6.5211.43437.080.1367
1999Jacksonville JaguarsjaxAFC Central1614200.8753962171.35.1353.83251.480.6937
1999Pittsburgh SteelerspitAFC Central1661000.375317320-2.2-0.2297.83336.280.4213
1999Tennessee TitansotiAFC Central1613300.8133923242.0-1.0365.03349.080.5244
1999Buffalo BillsbufAFC East1611500.688320229-0.27.4329.83214.680.7319
1999Indianapolis ColtscltAFC East1613300.8134233336.6-0.5438.63341.080.6543
1999Miami DolphinsmiaAFC East169700.5633263361.20.7352.23321.880.5524
1999New England PatriotsnweAFC East168800.500299284-1.03.2317.03281.880.5672
1999New York JetsnyjAFC East168800.5003083090.22.9336.23286.680.5930
1999Denver BroncosdenAFC West1661000.3753143181.02.4349.03294.680.5997
1999Kansas City ChiefskanAFC West169700.5633903225.51.3421.03312.280.6789
1999Oakland RaidersraiAFC West168800.5003903295.71.0424.23317.080.6751
1999San Diego ChargerssdgAFC West168800.500269316-3.92.9270.63286.680.4614
1999Seattle SeahawksseaAFC West169700.5633382981.92.6363.43291.480.6303
1999Chicago BearschiNFC Central1661000.375272341-3.01.0285.03317.080.4312
1999Detroit LionsdetNFC Central168800.5003223230.11.8334.63304.280.5547
1999Green Bay PackersgnbNFC Central168800.5003573412.5-0.9373.03347.480.5412
1999Minnesota VikingsminNFC Central1610600.6253993355.2-0.8416.23345.880.6137
1999Tampa Bay BuccaneerstamNFC Central1611500.688270235-4.16.7267.43225.880.5930
1999Arizona CardinalscrdNFC East1661000.375245382-5.5-3.2245.03384.280.2433
1999Dallas CowboysdalNFC East168800.500352276-0.33.4328.23278.680.5949
1999New York GiantsnygNFC East167900.438299358-1.8-1.2304.23352.280.4054
1999Philadelphia EaglesphiNFC East1651100.313272357-3.3-0.9280.23347.480.3661
1999Washington RedskinswasNFC East1610600.6254433776.8-3.9441.83395.480.5689
1999Atlanta FalconsatlNFC West1651100.313285380-4.0-3.0269.03381.080.2916
1999Carolina PantherscarNFC West168800.5004213812.9-4.0379.43397.080.4664
1999New Orleans SaintsnorNFC West1631300.188260434-5.3-6.9248.23443.480.1831
1999San Francisco 49erssfoNFC West1641200.250295453-4.5-6.8261.03441.880.2038
1999St. Louis RamsramNFC West1613300.8135262428.73.2472.23281.880.7875
1998Baltimore RavensravAFC Central1661000.375269335-5.2-0.2257.35343.590.3389
1998Cincinnati BengalscinAFC Central1631300.188268452-4.5-6.5268.55444.390.2253
1998Jacksonville JaguarsjaxAFC Central1611500.6883923383.1-0.6390.15349.990.5780
1998Pittsburgh SteelerspitAFC Central167900.438263303-5.11.3258.95319.590.3838
1998Tennessee OilersotiAFC Central168800.500330320-0.50.5332.55332.390.5088
1998Buffalo BillsbufAFC East1610600.6254003334.40.7410.95329.190.6475
1998Indianapolis ColtscltAFC East1631300.188310444-0.1-5.3338.95425.190.3656
1998Miami DolphinsmiaAFC East1610600.625321265-0.76.5329.35236.390.6983
1998New England PatriotsnweAFC East169700.5633373291.12.8358.15295.590.6261
1998New York JetsnyjAFC East1612400.7504162665.45.8426.95247.590.8060
1998Denver BroncosdenAFC West1614200.8755013099.5-0.6492.55349.990.7211
1998Kansas City ChiefskanAFC West167900.438327363-0.7-2.4329.35378.790.4204
1998Oakland RaidersraiAFC West168800.500288356-4.1-1.5274.95364.390.3405
1998San Diego ChargerssdgAFC West1651100.313241342-7.7-0.7217.35351.590.2472
1998Seattle SeahawksseaAFC West168800.5003723100.90.6354.95330.790.5529
1998Chicago BearschiNFC Central1641200.250276368-3.4-0.3286.15345.190.3945
1998Detroit LionsdetNFC Central1651100.313306378-1.9-1.5310.15364.390.4085
1998Green Bay PackersgnbNFC Central1611500.6884083194.30.7409.35329.190.6451
1998Minnesota VikingsminNFC Central1615100.93855629613.21.6551.75314.790.8264
1998Tampa Bay BuccaneerstamNFC Central168800.500314295-2.33.5303.75284.390.5485
1998Arizona CardinalscrdNFC East169700.563325378-1.6-5.8314.95433.190.3137
1998Dallas CowboysdalNFC East1610600.6253812750.92.6354.95298.790.6144
1998New York GiantsnygNFC East168800.500287309-4.31.1271.75322.790.4051
1998Philadelphia EaglesphiNFC East1631300.188161344-12.3-0.5143.75348.390.1215
1998Washington RedskinswasNFC East1661000.375319421-1.5-6.0316.55436.390.3122
1998Atlanta FalconsatlNFC West1614200.8754422897.03.0452.55292.390.7637
1998Carolina PantherscarNFC West1641200.2503364131.0-2.4356.55378.790.4697
1998New Orleans SaintsnorNFC West1661000.375305359-1.51.6316.55314.790.5120
1998San Francisco 49erssfoNFC West1612400.7504793288.81.8481.35311.590.7660
1998St. Louis RamsramNFC West1641200.250285378-2.30.0303.75340.390.4382
1997Baltimore RavensravAFC Central166910.406326345-0.4-0.2325.61335.050.4824
1997Cincinnati BengalscinAFC Central167900.4383554051.8-4.0360.81395.850.4406
1997Jacksonville JaguarsjaxAFC Central1611500.6883943184.41.0402.41315.850.6503
1997Pittsburgh SteelerspitAFC Central1611500.6883723072.72.6375.21290.250.6559
1997Tennessee OilersotiAFC Central168800.500333310-0.31.9327.21301.450.5508
1997Buffalo BillsbufAFC East1661000.375255367-4.0-0.5268.01339.850.3587
1997Indianapolis ColtscltAFC East1631300.188313401-0.6-3.8322.41392.650.3771
1997Miami DolphinsmiaAFC East169700.5633393271.00.3348.01327.050.5393
1997New England PatriotsnweAFC East1610600.6253692892.33.0368.81283.850.6581
1997New York JetsnyjAFC East169700.5633482870.12.8333.61287.050.5919
1997Denver BroncosdenAFC West1612400.7504722878.12.6461.61290.250.7686
1997Kansas City ChiefskanAFC West1613300.8133752321.86.6360.81226.250.7570
1997Oakland RaidersraiAFC West1641200.250324419-0.1-5.0330.41411.850.3621
1997San Diego ChargerssdgAFC West1641200.250266425-4.1-4.8266.41408.650.2545
1997Seattle SeahawksseaAFC West168800.5003653621.8-1.7360.81359.050.5034
1997Chicago BearschiNFC Central1641200.250263421-3.1-5.3282.41416.650.2718
1997Detroit LionsdetNFC Central169700.5633793063.00.9380.01317.450.6124
1997Green Bay PackersgnbNFC Central1613300.8134222825.32.4416.81293.450.7101
1997Minnesota VikingsminNFC Central169700.5633543591.7-1.8359.21360.650.4978
1997Tampa Bay BuccaneerstamNFC Central1610600.625299263-2.45.1293.61250.250.5945
1997Arizona CardinalscrdNFC East1641200.250283379-2.6-3.8290.41392.650.3187
1997Dallas CowboysdalNFC East1661000.375304314-1.71.0304.81315.850.4784
1997New York GiantsnygNFC East1610510.656307265-1.83.3303.21279.050.5505
1997Philadelphia EaglesphiNFC East166910.406317372-0.7-2.3320.81368.650.4133
1997Washington RedskinswasNFC East168710.531327289-0.61.8322.41303.050.5385
1997Atlanta FalconsatlNFC West167900.438320361-1.2-2.9312.81378.250.3824
1997Carolina PantherscarNFC West167900.438265314-4.40.8261.61319.050.3823
1997New Orleans SaintsnorNFC West1661000.375237327-6.8-0.6223.21341.450.2646
1997San Francisco 49erssfoNFC West1613300.8133752652.42.7370.41288.650.6514
1997St. Louis RamsramNFC West1651100.313299359-1.8-2.2303.21367.050.3826
1996Baltimore RavensravAFC Central1641200.2503714413.9-6.8389.18435.630.4254
1996Cincinnati BengalscinAFC Central168800.5003723692.5-2.6366.78368.430.4964
1996Houston OilersotiAFC Central168800.5003453190.10.8328.38314.030.5271
1996Jacksonville JaguarsjaxAFC Central169700.563325335-1.60.1301.18325.230.4520
1996Pittsburgh SteelerspitAFC Central1610600.6253442570.05.1326.78245.230.6661
1996Buffalo BillsbufAFC East1610600.625319266-1.03.9310.78264.430.5958
1996Indianapolis ColtscltAFC East169700.563317334-1.80.2297.98323.630.4486
1996Miami DolphinsmiaAFC East168800.5003393250.6-0.4336.38333.230.5052
1996New England PatriotsnweAFC East1611500.6884183134.90.2405.18323.630.6395
1996New York JetsnyjAFC East1611500.063279454-2.5-7.6286.78448.430.2400
1996Denver BroncosdenAFC West1613300.8133912753.73.9385.98264.430.7190
1996Kansas City ChiefskanAFC West169700.563297300-0.72.5315.58286.830.5575
1996Oakland RaidersraiAFC West167900.4383402930.32.1331.58293.230.5746
1996San Diego ChargerssdgAFC West168800.5003103760.4-2.1333.18360.430.4497
1996Seattle SeahawksseaAFC West167900.4383173761.0-2.6342.78368.430.4535
1996Chicago BearschiNFC Central167900.438283305-1.41.2304.38307.630.4928
1996Detroit LionsdetNFC Central1651100.313302368-0.4-2.5320.38366.830.4146
1996Green Bay PackersgnbNFC Central1613300.8134562108.76.6465.98221.230.8673
1996Minnesota VikingsminNFC Central169700.563298315-0.90.7312.38315.630.4929
1996Tampa Bay BuccaneerstamNFC Central1661000.375221293-5.92.9232.38280.430.3906
1996Arizona CardinalscrdNFC East167900.438300397-1.7-5.8299.58419.630.2964
1996Dallas CowboysdalNFC East1610600.625286250-2.95.3280.38242.030.5853
1996New York GiantsnygNFC East1661000.375242297-5.71.5235.58302.830.3542
1996Philadelphia EaglesphiNFC East1610600.6253633412.1-1.6360.38352.430.5135
1996Washington RedskinswasNFC East169700.5633643122.3-0.4363.58333.230.5544
1996Atlanta FalconsatlNFC West1631300.188309461-0.2-8.9323.58469.230.2736
1996Carolina PantherscarNFC West1612400.7503672181.45.6349.18237.230.7183
1996New Orleans SaintsnorNFC West1631300.188229339-7.1-1.0213.18342.830.2417
1996San Francisco 49erssfoNFC West1612400.7503982573.74.3385.98258.030.7307
1996St. Louis RamsramNFC West1661000.375303409-1.7-4.6299.58400.430.3231
1995Cincinnati BengalscinAFC Central167900.4383493740.1-1.9345.35374.040.4529
1995Cleveland BrownscleAFC Central1651100.313289356-3.2-0.6292.55353.240.3885
1995Houston OilersotiAFC Central167900.438348324-0.10.9342.15329.240.5279
1995Jacksonville JaguarsjaxAFC Central1641200.250275404-4.4-3.7273.35402.840.2774
1995Pittsburgh SteelerspitAFC Central1611500.6884073273.41.2398.15324.440.6318
1995Buffalo BillsbufAFC East1610600.625350335-0.5-0.4335.75350.040.4774
1995Indianapolis ColtscltAFC East169700.563331316-1.70.4316.55337.240.4643
1995Miami DolphinsmiaAFC East169700.5633983323.1-0.4393.35350.040.5783
1995New England PatriotsnweAFC East1661000.375294377-2.8-2.6298.95385.240.3489
1995New York JetsnyjAFC East1631300.188233384-7.9-3.3217.35396.440.1896
1995Denver BroncosdenAFC West168800.5003883453.3-0.2396.55346.840.5892
1995Kansas City ChiefskanAFC West1613300.8133582410.86.9356.55233.240.7412
1995Oakland RaidersraiAFC West168800.5003483321.11.0361.35327.640.5653
1995San Diego ChargerssdgAFC West169700.563321323-0.62.1334.15310.040.5502
1995Seattle SeahawksseaAFC West168800.5003633661.6-2.2369.35378.840.4874
1995Chicago BearschiNFC Central169700.5633923603.1-0.8393.35356.440.5670
1995Detroit LionsdetNFC Central1610600.6254363365.91.0438.15327.640.6839
1995Green Bay PackersgnbNFC Central1611500.6884043143.52.5399.75303.640.6717
1995Minnesota VikingsminNFC Central168800.5004123855.1-1.4425.35366.040.6007
1995Tampa Bay BuccaneerstamNFC Central167900.438238335-6.91.9233.35313.240.3348
1995Arizona CardinalscrdNFC East1641200.250275422-3.5-4.0287.75407.640.2963
1995Dallas CowboysdalNFC East1612400.7504352916.23.5442.95287.640.7554
1995New York GiantsnygNFC East1651100.313290340-2.61.1302.15326.040.4568
1995Philadelphia EaglesphiNFC East1610600.625318338-1.90.2313.35340.440.4522
1995Washington RedskinswasNFC East1661000.375326359-0.8-1.2330.95362.840.4457
1995Atlanta FalconsatlNFC West169700.5633623490.9-0.9358.15358.040.5039
1995Carolina PantherscarNFC West167900.438289325-4.10.3278.15338.840.3846
1995New Orleans SaintsnorNFC West167900.438319348-1.7-0.4316.55350.040.4410
1995San Francisco 49erssfoNFC West1611500.6884572586.55.3447.75258.840.8050
1995St. Louis RamsramNFC West167900.438309418-1.8-4.6314.95417.240.3307
1994Cincinnati BengalscinAFC Central1631300.188276406-1.6-5.4298.56410.450.3110
1994Cleveland BrownscleAFC Central1611500.6883402041.26.1343.36226.450.7352
1994Houston OilersotiAFC Central1621400.125226352-4.7-2.6248.96365.650.2831
1994Pittsburgh SteelerspitAFC Central1612400.750316234-0.25.0320.96244.050.6625
1994Buffalo BillsbufAFC East167900.4383403561.5-1.8348.16352.850.4948
1994Indianapolis ColtscltAFC East168800.500307320-1.3-0.2303.36327.250.4565
1994Miami DolphinsmiaAFC East1610600.6253893274.5-0.3396.16328.850.6203
1994New England PatriotsnweAFC East1610600.6253513121.91.3354.56303.250.5997
1994New York JetsnyjAFC East1661000.375264320-3.71.5264.96300.050.4289
1994Denver BroncosdenAFC West167900.4383473961.3-4.6344.96397.650.4127
1994Kansas City ChiefskanAFC West169700.563319298-1.32.1303.36290.450.5297
1994Los Angeles RaidersraiAFC West169700.563303327-1.90.3293.76319.250.4523
1994San Diego ChargerssdgAFC West1611500.6883813062.90.7370.56312.850.6085
1994Seattle SeahawksseaAFC West1661000.375287323-2.8-0.6279.36333.650.3959
1994Chicago BearschiNFC Central169700.563271307-3.21.3272.96303.250.4399
1994Detroit LionsdetNFC Central169700.5633573422.8-0.4368.96330.450.5728
1994Green Bay PackersgnbNFC Central169700.5633822873.82.2384.96288.850.6764
1994Minnesota VikingsminNFC Central1610600.6253563142.40.8362.56311.250.5980
1994Tampa Bay BuccaneerstamNFC Central1661000.375251351-5.4-0.8237.76336.850.3043
1994Arizona CardinalscrdNFC East168800.500235267-5.63.3234.56271.250.4189
1994Dallas CowboysdalNFC East1612400.7504142485.64.5413.76252.050.7793
1994New York GiantsnygNFC East169700.563279305-2.71.0280.96308.050.4475
1994Philadelphia EaglesphiNFC East167900.438308308-0.41.0317.76308.050.5224
1994Washington RedskinswasNFC East1631300.1883204120.3-6.4328.96426.450.3414
1994Atlanta FalconsatlNFC West167900.438317385-1.2-3.1304.96373.650.3780
1994Los Angeles RamsramNFC West1641200.250286365-3.2-2.1272.96357.650.3421
1994New Orleans SaintsnorNFC West167900.4383484071.0-4.6340.16397.650.4042
1994San Francisco 49erssfoNFC West1613300.8135052969.91.7482.56296.850.7834
1993Cincinnati BengalscinAFC Central1631300.188187319-7.4-1.0180.78315.180.2164
1993Cleveland BrownscleAFC Central167900.438304307-0.6-0.6289.58308.780.4625
1993Houston OilersotiAFC Central1612400.7503682384.13.1364.78249.580.7193
1993Pittsburgh SteelerspitAFC Central169700.5633082810.11.5300.78275.180.5552
1993Buffalo BillsbufAFC East1612400.7503292421.83.0327.98251.180.6578
1993Indianapolis ColtscltAFC East1641200.250189378-6.2-5.1199.98380.780.1750
1993Miami DolphinsmiaAFC East169700.5633493513.9-4.3361.58367.980.4903
1993New England PatriotsnweAFC East1651100.313238286-4.00.3235.18294.380.3716
1993New York JetsnyjAFC East168800.500270247-2.12.9265.58252.780.5307
1993Denver BroncosdenAFC West169700.5633732844.60.4372.78292.780.6485
1993Kansas City ChiefskanAFC West1611500.6883282911.91.0329.58283.180.5937
1993Los Angeles RaidersraiAFC West1610600.6253063261.1-1.7316.78326.380.4830
1993San Diego ChargerssdgAFC West168800.5003222901.11.1316.78281.580.5730
1993Seattle SeahawksseaAFC West1661000.375280314-0.8-0.5286.38307.180.4589
1993Chicago BearschiNFC Central167900.438234230-4.64.3225.58230.380.4896
1993Detroit LionsdetNFC Central1610600.625298292-0.30.0294.38299.180.4917
1993Green Bay PackersgnbNFC Central169700.5633402822.70.5342.38291.180.6006
1993Minnesota VikingsminNFC Central169700.563277290-1.31.2278.38279.980.4981
1993Tampa Bay BuccaneerstamNFC Central1651100.313237376-3.3-4.3246.38367.980.2732
1993Dallas CowboysdalNFC East1612400.7503762294.94.7377.58223.980.7835
1993New York GiantsnygNFC East1611500.688288205-0.85.4286.38212.780.6684
1993Philadelphia EaglesphiNFC East168800.5002933150.7-0.3310.38303.980.5144
1993Phoenix CardinalscrdNFC East167900.4383262691.92.1329.58265.580.6303
1993Washington RedskinswasNFC East1641200.250230345-3.8-2.7238.38342.380.2952
1993Atlanta FalconsatlNFC West1661000.3753163850.8-5.2311.98382.380.3755
1993Los Angeles RamsramNFC West1651100.313221367-5.0-3.4219.18353.580.2411
1993New Orleans SaintsnorNFC West168800.5003173430.7-2.1310.38332.780.4584
1993San Francisco 49erssfoNFC West1610600.6254732959.9-0.3457.58303.980.7443
1992Cincinnati BengalscinAFC Central1651100.313274364-0.9-5.7285.28390.940.3152
1992Cleveland BrownscleAFC Central167900.438272275-2.01.0267.68283.740.4689
1992Houston OilersotiAFC Central1610600.6253522583.02.6347.68258.140.6784
1992Pittsburgh SteelerspitAFC Central1611500.688299225-0.44.0293.28235.740.6303
1992Buffalo BillsbufAFC East1611500.6883812834.7-0.4374.88306.140.6287
1992Indianapolis ColtscltAFC East169700.563216302-6.0-1.0203.68315.740.2660
1992Miami DolphinsmiaAFC East1611500.6883402812.1-0.6333.28309.340.5499
1992New England PatriotsnweAFC East1621400.125205363-6.5-4.5195.68371.740.1792
1992New York JetsnyjAFC East1641200.250220315-6.0-0.9203.68314.140.2685
1992Denver BroncosdenAFC West168800.500262329-1.4-1.9277.28330.140.3984
1992Kansas City ChiefskanAFC West1610600.6253482823.7-0.2358.88302.940.6082
1992Los Angeles RaidersraiAFC West167900.438249281-3.21.5248.48275.740.4425
1992San Diego ChargerssdgAFC West1611500.6883352411.81.3328.48278.940.6026
1992Seattle SeahawksseaAFC West1621400.125140312-9.8-0.2142.88302.940.1572
1992Chicago BearschiNFC Central1651100.313295361-0.2-3.3296.48352.540.3975
1992Detroit LionsdetNFC Central1651100.313273332-0.7-1.1288.48317.340.4456
1992Green Bay PackersgnbNFC Central169700.563276296-2.61.0258.08283.740.4475
1992Minnesota VikingsminNFC Central1611500.6883742494.43.3370.08246.940.7339
1992Tampa Bay BuccaneerstamNFC Central1651100.313267365-2.0-3.9267.68362.140.3251
1992Dallas CowboysdalNFC East1613300.8134092436.43.5402.08243.740.7803
1992New York GiantsnygNFC East1661000.3753063671.6-3.4325.28354.140.4504
1992Philadelphia EaglesphiNFC East1611500.6883542454.84.1376.48234.140.7661
1992Phoenix CardinalscrdNFC East1641200.250243332-2.9-0.1253.28301.340.4011
1992Washington RedskinswasNFC East169700.5633002550.73.8310.88238.940.6561
1992Atlanta FalconsatlNFC West1661000.3753274142.3-6.4336.48402.140.3910
1992Los Angeles RamsramNFC West1661000.3753133831.1-4.0317.28363.740.4184
1992New Orleans SaintsnorNFC West1612400.7503302020.77.1310.88186.140.7717
1992San Francisco 49erssfoNFC West1614200.8754312367.34.5416.48227.740.8215
1991Cincinnati BengalscinAFC Central1631300.188263435-1.8-6.9275.04414.190.2645
1991Cleveland BrownscleAFC Central1661000.375293298-0.70.4292.64297.390.4927
1991Houston OilersotiAFC Central1611500.6883862514.93.4382.24249.390.7446
1991Pittsburgh SteelerspitAFC Central167900.438292344-0.8-2.2291.04338.990.4092
1991Buffalo BillsbufAFC East1613300.8134583187.6-4.1425.44369.390.5939
1991Indianapolis ColtscltAFC East1611500.063143381-11.5-5.7119.84394.990.0594
1991Miami DolphinsmiaAFC East168800.5003433490.7-4.8315.04380.590.3849
1991New England PatriotsnweAFC East1661000.375211305-7.9-0.8177.44316.590.2085
1991New York JetsnyjAFC East168800.500314293-1.2-1.2284.64322.990.4256
1991Denver BroncosdenAFC West1612400.7503042350.33.1308.64254.190.6171
1991Kansas City ChiefskanAFC West1610600.6253222521.84.5332.64231.790.7071
1991Los Angeles RaidersraiAFC West169700.5632982970.31.1308.64286.190.5484
1991San Diego ChargerssdgAFC West1641200.250274342-0.6-1.7294.24330.990.4303
1991Seattle SeahawksseaAFC West167900.438276261-1.52.7279.84260.590.5448
1991Chicago BearschiNFC Central1611500.688299269-1.22.0284.64271.790.5301
1991Detroit LionsdetNFC Central1612400.7503392950.90.0318.24303.790.5311
1991Green Bay PackersgnbNFC Central1641200.250273313-3.3-1.4251.04326.190.3491
1991Minnesota VikingsminNFC Central168800.500301306-0.2-1.8300.64332.590.4402
1991Tampa Bay BuccaneerstamNFC Central1631300.188199365-7.0-4.2191.84370.990.1723
1991Dallas CowboysdalNFC East1611500.6883423103.70.8363.04290.990.6371
1991New York GiantsnygNFC East168800.500281297-0.61.5294.24279.790.5329
1991Philadelphia EaglesphiNFC East1610600.625285244-0.35.0299.04223.790.6673
1991Phoenix CardinalscrdNFC East1641200.250196344-4.9-0.5225.44311.790.3187
1991Washington RedskinswasNFC East1614200.87548522411.74.9491.04225.390.8820
1991Atlanta FalconsatlNFC West1610600.6253613384.7-1.3379.04324.590.5998
1991Los Angeles RamsramNFC West1631300.188234390-2.6-3.4262.24358.190.3193
1991New Orleans SaintsnorNFC West1611500.6883412112.86.3348.64202.990.7874
1991San Francisco 49erssfoNFC West1610600.6253932396.64.3409.44234.990.8016
1990Cincinnati BengalscinAFC Central169700.5633603521.9-3.0352.42369.910.4632
1990Cleveland BrownscleAFC Central1631300.188228462-5.2-7.8238.82446.710.1647
1990Houston OilersotiAFC Central169700.5634053074.90.3400.42317.110.6389
1990Pittsburgh SteelerspitAFC Central169700.563292240-3.45.0267.62241.910.5532
1990Buffalo BillsbufAFC East1613300.8134282635.72.9413.22275.510.7301
1990Indianapolis ColtscltAFC East167900.438281353-2.7-1.2278.82341.110.3725
1990Miami DolphinsmiaAFC East1612400.7503362420.54.2330.02254.710.6465
1990New England PatriotsnweAFC East1611500.063181446-7.5-7.1202.02435.510.1236
1990New York JetsnyjAFC East1661000.375295345-2.0-2.6290.02363.510.3569
1990Denver BroncosdenAFC West1651100.3133313742.1-2.9355.62368.310.4718
1990Kansas City ChiefskanAFC West1611500.6883692572.74.1365.22256.310.6996
1990Los Angeles RaidersraiAFC West1612400.7503372682.24.4357.22251.510.6970
1990San Diego ChargerssdgAFC West1661000.375315281-0.12.5320.42281.910.5719
1990Seattle SeahawksseaAFC West169700.563306286-0.53.3314.02269.110.5867
1990Chicago BearschiNFC Central1611500.6883482800.13.3323.62269.110.6047
1990Detroit LionsdetNFC Central1661000.3753734134.2-5.9389.22416.310.4501
1990Green Bay PackersgnbNFC Central1661000.375271347-3.7-0.4262.82328.310.3619
1990Minnesota VikingsminNFC Central1661000.3753513262.6-0.2363.62325.110.5645
1990Tampa Bay BuccaneerstamNFC Central1661000.375264367-4.0-3.2258.02373.110.2806
1990Dallas CowboysdalNFC East167900.438244308-4.81.1245.22304.310.3679
1990New York GiantsnygNFC East1613300.8133352110.07.6322.02200.310.7484
1990Philadelphia EaglesphiNFC East1610600.6253962994.51.1394.02304.310.6524
1990Phoenix CardinalscrdNFC East1651100.313268396-1.9-4.8291.62398.710.3060
1990Washington RedskinswasNFC East1610600.6253813014.60.8395.62309.110.6461
1990Atlanta FalconsatlNFC West1651100.3133483650.9-3.1336.42371.510.4314
1990Los Angeles RamsramNFC West1651100.3133454122.3-6.5358.82425.910.3841
1990New Orleans SaintsnorNFC West168800.500274275-4.73.4246.82267.510.4470
1990San Francisco 49erssfoNFC West1614200.8753532391.24.6341.22248.310.6785
1989Cincinnati BengalscinAFC Central168800.5004042854.62.4403.26291.430.6940
1989Cleveland BrownscleAFC Central169610.594334254-0.24.6326.46256.230.6420
1989Houston OilersotiAFC Central169700.5633654122.8-5.3374.46414.630.4329
1989Pittsburgh SteelerspitAFC Central169700.563265326-4.30.6260.86320.230.3773
1989Buffalo BillsbufAFC East169700.5634093173.80.5390.46321.830.6199
1989Indianapolis ColtscltAFC East168800.500298301-2.72.2286.46294.630.4821
1989Miami DolphinsmiaAFC East168800.500331379-0.6-4.2320.06397.030.3649
1989New England PatriotsnweAFC East1651100.313297391-3.0-4.0281.66393.830.2999
1989New York JetsnyjAFC East1641200.250253411-4.9-5.2251.26413.030.2226
1989Denver BroncosdenAFC West1611500.6883622263.75.7388.86238.630.7688
1989Kansas City ChiefskanAFC West168710.531318286-0.12.1328.06296.230.5618
1989Los Angeles RaidersraiAFC West168800.5003152970.01.9329.66299.430.5583
1989San Diego ChargerssdgAFC West1661000.375266290-2.92.1283.26296.230.4720
1989Seattle SeahawksseaAFC West167900.438241327-3.60.8272.06317.030.4071
1989Chicago BearschiNFC Central1661000.3753583771.8-1.8358.46358.630.4988
1989Detroit LionsdetNFC Central167900.438312364-1.7-1.8302.46358.630.3941
1989Green Bay PackersgnbNFC Central1610600.6253623561.0-2.0345.66361.830.4701
1989Minnesota VikingsminNFC Central1610600.6253512750.24.1332.86264.230.6364
1989Tampa Bay BuccaneerstamNFC Central1651100.313320419-0.4-4.7323.26405.030.3585
1989Dallas CowboysdalNFC East1611500.063204393-7.6-2.8208.06374.630.1927
1989New York GiantsnygNFC East1612400.7503482521.94.6360.06256.230.6970
1989Philadelphia EaglesphiNFC East1611500.6883422741.93.2360.06278.630.6531
1989Phoenix CardinalscrdNFC East1651100.313258377-4.0-3.1265.66379.430.2909
1989Washington RedskinswasNFC East1610600.6253863083.80.2390.46326.630.6112
1989Atlanta FalconsatlNFC West1631300.188279437-3.2-5.9278.46424.230.2545
1989Los Angeles RamsramNFC West1611500.6884263445.7-1.1420.86347.430.6211
1989New Orleans SaintsnorNFC West169700.5633863012.32.2366.46294.630.6324
1989San Francisco 49erssfoNFC West1614200.8754422535.84.9422.46251.430.7858
1988Cincinnati BengalscinAFC Central1612400.7504483297.1-1.0437.65339.990.6622
1988Cleveland BrownscleAFC Central1610600.625304288-3.54.0268.05259.990.5215
1988Houston OilersotiAFC Central1610600.6254243655.3-2.3408.85360.790.5840
1988Pittsburgh SteelerspitAFC Central1651100.3133364210.1-5.5325.65411.990.3567
1988Buffalo BillsbufAFC East1612400.7503292370.06.4324.05221.590.7159
1988Indianapolis ColtscltAFC East169700.5633543152.90.3370.45319.190.5965
1988Miami DolphinsmiaAFC East1661000.3753193801.0-3.9340.05386.390.4223
1988New England PatriotsnweAFC East169700.563250284-4.54.4252.05253.590.4999
1988New York JetsnyjAFC East168710.5313723543.7-2.4383.25362.390.5395
1988Denver BroncosdenAFC West168800.5003273520.1-3.4325.65378.390.4092
1988Kansas City ChiefskanAFC West1641110.281254320-6.00.3228.05319.190.3128
1988Los Angeles RaidersraiAFC West167900.438325369-0.3-3.3319.25376.790.3999
1988San Diego ChargerssdgAFC West1661000.375231332-7.1-0.2210.45327.190.2627
1988Seattle SeahawksseaAFC West169700.5633393291.2-2.0343.25355.990.4803
1988Chicago BearschiNFC Central1612400.7503122150.06.6324.05218.390.7227
1988Detroit LionsdetNFC Central1641200.250220313-5.01.0244.05307.990.3677
1988Green Bay PackersgnbNFC Central1641200.250240315-3.90.6261.65314.390.3942
1988Minnesota VikingsminNFC Central1611500.6884062336.54.3428.05255.190.7902
1988Tampa Bay BuccaneerstamNFC Central1651100.313261350-1.9-2.2293.65359.190.3803
1988Dallas CowboysdalNFC East1631300.188265381-3.8-2.3263.25360.790.3182
1988New York GiantsnygNFC East1610600.6253593041.50.7348.05312.790.5699
1988Philadelphia EaglesphiNFC East1610600.6253793192.31.1360.85306.390.6046
1988Phoenix CardinalscrdNFC East167900.4383443980.5-3.7332.05383.190.4131
1988Washington RedskinswasNFC East167900.4383453871.2-3.4343.25378.390.4414
1988Atlanta FalconsatlNFC West1651100.313244315-5.00.5244.05315.990.3531
1988Los Angeles RamsramNFC West1610600.6254072935.60.9413.65309.590.6808
1988New Orleans SaintsnorNFC West1610600.625312283-1.02.6308.05282.390.5562
1988San Francisco 49erssfoNFC West1610600.6253692943.11.7373.65296.790.6442
1987Cincinnati BengalscinAFC Central1541100.267285370-1.8-1.9296.96352.520.3952
1987Cleveland BrownscleAFC Central1510500.6673902395.45.6404.96240.020.7916
1987Houston OilersotiAFC Central159600.6003453493.3-1.1373.46340.520.5616
1987Pittsburgh SteelerspitAFC Central158700.533285299-2.13.0292.46279.020.5309
1987Buffalo BillsbufAFC East157800.467270305-2.72.3283.46289.520.4891
1987Indianapolis ColtscltAFC East159600.600300238-1.35.4304.46243.020.6356
1987Miami DolphinsmiaAFC East158700.5333623353.2-1.1371.96340.520.5590
1987New England PatriotsnweAFC East158700.5333202930.42.5329.96286.520.5894
1987New York JetsnyjAFC East156900.4003343601.2-2.8341.96366.020.4582
1987Denver BroncosdenAFC West1510410.7003792883.10.8370.46312.020.6103
1987Kansas City ChiefskanAFC West1541100.267273388-3.2-4.7275.96394.520.2886
1987Los Angeles RaidersraiAFC West1551000.333301289-1.81.6296.96300.020.4957
1987San Diego ChargerssdgAFC West158700.533253317-4.20.6260.96315.020.3884
1987Seattle SeahawksseaAFC West159600.6003713142.3-0.5358.46331.520.5521
1987Chicago BearschiNFC Central1511400.7333562821.42.2344.96291.020.6076
1987Detroit LionsdetNFC Central1541100.267269384-4.5-5.3256.46403.520.2421
1987Green Bay PackersgnbNFC Central155910.367255300-5.41.8242.96297.020.3829
1987Minnesota VikingsminNFC Central158700.533336335-0.2-2.6320.96363.020.4238
1987Tampa Bay BuccaneerstamNFC Central1541100.267286360-3.0-2.6278.96363.020.3417
1987Dallas CowboysdalNFC East157800.467340348-0.2-1.7320.96349.520.4479
1987New York GiantsnygNFC East156900.400280312-2.92.1280.46292.520.4763
1987Philadelphia EaglesphiNFC East157800.4673373801.2-3.4341.96375.020.4425
1987St. Louis CardinalscrdNFC East157800.4673623682.3-3.0358.46369.020.4832
1987Washington RedskinswasNFC East1511400.7333792851.92.0352.46294.020.6147
1987Atlanta FalconsatlNFC West1531200.200205436-7.9-5.9205.46412.520.1509
1987Los Angeles RamsramNFC West156900.400317361-0.5-1.1316.46340.520.4557
1987New Orleans SaintsnorNFC West1512300.8004222836.93.4427.46273.020.7628
1987San Francisco 49erssfoNFC West1513200.8674592539.14.5460.46256.520.8223
1986Cincinnati BengalscinAFC Central1610600.6254093945.7-4.2419.46395.460.5357
1986Cleveland BrownscleAFC Central1612400.7503913102.90.7374.66317.060.6011
1986Houston OilersotiAFC Central1651100.313274329-4.40.4257.86321.860.3658
1986Pittsburgh SteelerspitAFC Central1661000.375307336-1.30.3307.46323.460.4657
1986Buffalo BillsbufAFC East1641200.250287348-5.0-0.8248.26341.060.3129
1986Indianapolis ColtscltAFC East1631300.188229400-6.6-3.8222.66389.060.1995
1986Miami DolphinsmiaAFC East168800.5004304056.2-5.7427.46419.460.5096
1986New England PatriotsnweAFC East1611500.6884123074.41.3398.66307.460.6565
1986New York JetsnyjAFC East1610600.6253643862.0-3.3360.26381.060.4609
1986Denver BroncosdenAFC West1611500.6883783273.41.8382.66299.460.6469
1986Kansas City ChiefskanAFC West1610600.6253583261.2-0.1347.46329.860.5297
1986Los Angeles RaidersraiAFC West168800.5003233460.00.2328.26325.060.5031
1986San Diego ChargerssdgAFC West1641200.2503353961.2-3.1347.46377.860.4435
1986Seattle SeahawksseaAFC West1610600.6253662932.44.0366.66264.260.6892
1986Chicago BearschiNFC Central1614200.875352187-0.17.7326.66205.060.7481
1986Detroit LionsdetNFC Central1651100.313277326-3.8-0.5267.46336.260.3605
1986Green Bay PackersgnbNFC Central1641200.250254418-4.0-5.6264.26417.860.2364
1986Minnesota VikingsminNFC Central169700.5633982734.02.5392.26288.260.6820
1986Tampa Bay BuccaneerstamNFC Central1621400.125239473-4.6-10.8254.66501.060.1449
1986Dallas CowboysdalNFC East167900.4383463373.0-0.9376.26342.660.5565
1986New York GiantsnygNFC East1614200.8753712363.25.8379.46235.460.7608
1986Philadelphia EaglesphiNFC East1651010.344256312-2.91.4281.86305.860.4475
1986St. Louis CardinalscrdNFC East1641110.281218351-6.5-1.6224.26353.860.2459
1986Washington RedskinswasNFC East1612400.7503682963.52.1384.26294.660.6583
1986Atlanta FalconsatlNFC West167810.469280280-2.82.3283.46291.460.4802
1986Los Angeles RamsramNFC West1610600.625309267-1.12.9310.66281.860.5560
1986New Orleans SaintsnorNFC West167900.438288287-2.52.5288.26288.260.4970
1986San Francisco 49erssfoNFC West1610510.6563742472.64.4369.86257.860.7062
1985Cincinnati BengalscinAFC Central167900.4384414376.2-6.9443.61454.920.4848
1985Cleveland BrownscleAFC Central168800.500287294-4.73.4269.21290.120.4570
1985Houston OilersotiAFC Central1651100.313284412-4.9-4.0266.01408.520.2554
1985Pittsburgh SteelerspitAFC Central167900.4383793550.6-1.1354.01362.120.4873
1985Buffalo BillsbufAFC East1621400.125200381-9.5-0.2192.41347.720.1981
1985Indianapolis ColtscltAFC East1651100.313320386-0.3-2.4339.61382.920.4256
1985Miami DolphinsmiaAFC East1612400.7504283206.10.9442.01330.120.6829
1985New England PatriotsnweAFC East1611500.6883622902.03.8376.41283.720.6716
1985New York JetsnyjAFC East1611500.6883932643.85.2405.21261.320.7521
1985Denver BroncosdenAFC West1611500.6883803291.81.9373.21314.120.6090
1985Kansas City ChiefskanAFC West1661000.375317360-2.00.4312.41338.120.4526
1985Los Angeles RaidersraiAFC West1612400.7503543080.73.7355.61285.320.6352
1985San Diego ChargerssdgAFC West168800.5004674358.3-7.2477.21459.720.5272
1985Seattle SeahawksseaAFC West168800.5003493030.34.1349.21278.920.6372
1985Chicago BearschiNFC Central1615100.9384561986.59.4448.41194.120.8908
1985Detroit LionsdetNFC Central167900.438307366-1.60.0318.81344.520.4534
1985Green Bay PackersgnbNFC Central168800.5003373550.10.1346.01342.920.5074
1985Minnesota VikingsminNFC Central167900.4383463590.1-1.3346.01365.320.4672
1985Tampa Bay BuccaneerstamNFC Central1621400.125294448-1.9-5.5314.01432.520.3063
1985Dallas CowboysdalNFC East1610600.6253573330.6-0.3354.01349.320.5103
1985New York GiantsnygNFC East1610600.6253992832.11.8378.01315.720.6139
1985Philadelphia EaglesphiNFC East167900.438286310-4.81.3267.61323.720.3879
1985St. Louis CardinalscrdNFC East1651100.313278414-4.5-5.6272.41434.120.2358
1985Washington RedskinswasNFC East1610600.625297312-3.41.5290.01320.520.4407
1985Atlanta FalconsatlNFC West1641200.250282452-2.1-6.8310.81453.320.2748
1985Los Angeles RamsramNFC West1611500.688340277-1.03.6328.41286.920.5841
1985New Orleans SaintsnorNFC West1651100.313294401-3.0-3.9296.41406.920.3106
1985San Francisco 49erssfoNFC West1610600.6254112634.64.2418.01277.320.7406
1984Cincinnati BengalscinAFC Central168800.500339339-0.1-1.0337.70355.360.4676
1984Cleveland BrownscleAFC Central1651100.313250297-6.12.3241.70302.560.3689
1984Houston OilersotiAFC Central1631300.188240437-5.9-6.0244.90435.360.1897
1984Pittsburgh SteelerspitAFC Central169700.5633873102.40.9377.70324.960.5942
1984Buffalo BillsbufAFC East1621400.125250454-5.3-6.7254.50446.560.1932
1984Indianapolis ColtscltAFC East1641200.250239414-7.4-3.7220.90398.560.1892
1984Miami DolphinsmiaAFC East1614200.8755132989.11.5484.90315.360.7554
1984New England PatriotsnweAFC East169700.5633623521.0-1.1355.30356.960.4968
1984New York JetsnyjAFC East167900.438332364-1.8-2.7310.50382.560.3706
1984Denver BroncosdenAFC West1613300.8133532411.06.7355.30232.160.7376
1984Kansas City ChiefskanAFC West168800.500314324-0.81.6326.50313.760.5245
1984Los Angeles RaidersraiAFC West1611500.6883682782.14.8372.90262.560.7045
1984San Diego ChargerssdgAFC West167900.4383944134.8-4.0416.10403.360.5203
1984Seattle SeahawksseaAFC West1612400.7504182825.43.5425.70283.360.7380
1984Chicago BearschiNFC Central1610600.625325248-1.76.4312.10236.960.6587
1984Detroit LionsdetNFC Central1641110.281283408-2.9-3.4292.90393.760.3211
1984Green Bay PackersgnbNFC Central168800.5003903092.92.1385.70305.760.6427
1984Minnesota VikingsminNFC Central1631300.188276484-2.7-8.2296.10470.560.2308
1984Tampa Bay BuccaneerstamNFC Central1661000.375335380-0.2-3.4336.10393.760.3996
1984Dallas CowboysdalNFC East169700.563308308-1.42.4316.90300.960.5315
1984New York GiantsnygNFC East169700.563299301-2.23.1304.10289.760.5292
1984Philadelphia EaglesphiNFC East166910.406278320-4.31.9270.50308.960.4199
1984St. Louis CardinalscrdNFC East169700.5634233456.2-0.9438.50353.760.6367
1984Washington RedskinswasNFC East1611500.6884263105.01.3419.30318.560.6695
1984Atlanta FalconsatlNFC West1641200.250281382-3.7-2.9280.10385.760.3092
1984Los Angeles RamsramNFC West1610600.6253463161.01.3355.30318.560.5680
1984New Orleans SaintsnorNFC West167900.438298361-1.7-1.2312.10358.560.4135
1984San Francisco 49erssfoNFC West1615100.9384752277.45.4457.70252.960.8190
1983Cincinnati BengalscinAFC Central167900.438346302-1.21.7330.11322.110.5211
1983Cleveland BrownscleAFC Central169700.563356342-0.9-1.3334.91370.110.4426
1983Houston OilersotiAFC Central1621400.125288460-3.7-7.9290.11475.710.2227
1983Pittsburgh SteelerspitAFC Central1610600.625355303-1.21.1330.11331.710.5028
1983Baltimore ColtscltAFC East167900.438264354-4.1-2.7283.71392.510.3122
1983Buffalo BillsbufAFC East168800.500283351-3.4-0.4294.91355.710.3911
1983Miami DolphinsmiaAFC East1612400.7503892502.65.2390.91266.110.7292
1983New England PatriotsnweAFC East168800.500274289-4.73.7274.11290.110.4717
1983New York JetsnyjAFC East167900.438313331-1.90.7318.91338.110.4694
1983Denver BroncosdenAFC West169700.563302327-4.11.3283.71328.510.4167
1983Kansas City ChiefskanAFC West1661000.3753863671.70.3376.51344.510.5624
1983Los Angeles RaidersraiAFC West1612400.7504423385.11.7430.91322.110.6855
1983San Diego ChargerssdgAFC West1661000.3753584621.1-5.7366.91440.510.3879
1983Seattle SeahawksseaAFC West169700.5634033973.4-2.0403.71381.310.5430
1983Chicago BearschiNFC Central168800.500311301-2.51.5309.31325.310.4746
1983Detroit LionsdetNFC Central169700.563347286-1.23.3330.11296.510.5717
1983Green Bay PackersgnbNFC Central168800.5004294395.2-7.1432.51462.910.4601
1983Minnesota VikingsminNFC Central168800.500316348-2.9-0.1302.91350.910.4150
1983Tampa Bay BuccaneerstamNFC Central1621400.125241380-7.5-1.6229.31374.910.2366
1983Dallas CowboysdalNFC East1612400.7504793608.6-0.1486.91350.910.7104
1983New York GiantsnygNFC East1631210.219267347-5.53.4261.31294.910.4338
1983Philadelphia EaglesphiNFC East1651100.313233322-6.73.6242.11291.710.3969
1983St. Louis CardinalscrdNFC East168710.5313744282.5-3.6389.31406.910.4769
1983Washington RedskinswasNFC East1614200.87554133211.72.2536.51314.110.8121
1983Atlanta FalconsatlNFC West167900.4383703892.9-2.1395.71382.910.5272
1983Los Angeles RamsramNFC West169700.5633613442.00.9381.31334.910.5879
1983New Orleans SaintsnorNFC West168800.500319337-1.11.1331.71331.710.5058
1983San Francisco 49erssfoNFC West1610600.6254322935.73.0440.51301.310.7326
1982Cincinnati BengalscinAFC Central97200.7782321773.60.3213.86178.760.6166
1982Cleveland BrownscleAFC Central94500.444140182-4.91.6137.36167.060.3903
1982Houston OilersotiAFC Central91800.111136245-4.0-7.2145.46246.260.2132
1982Pittsburgh SteelerspitAFC Central96300.6672041463.51.9212.96164.360.6620
1982Baltimore ColtscltAFC East90810.056113236-6.0-2.6127.46204.860.2443
1982Buffalo BillsbufAFC East94500.444150154-1.93.4164.36150.860.5561
1982Miami DolphinsmiaAFC East97200.7781981312.75.8205.76129.260.7614
1982New England PatriotsnweAFC East95400.556143157-3.51.4149.96168.860.4338
1982New York JetsnyjAFC East96300.6672451668.91.8261.56165.260.7714
1982Denver BroncosdenAFC West92700.222148226-6.1-3.8126.56215.660.2178
1982Kansas City ChiefskanAFC West93600.333176184-1.81.7165.26166.160.5015
1982Los Angeles RaidersraiAFC West98100.8892602006.1-0.8236.36188.660.6466
1982San Diego ChargerssdgAFC West96300.66728822110.7-5.2277.76228.260.6343
1982Seattle SeahawksseaAFC West94500.444127147-7.52.0113.96163.460.3063
1982Chicago BearschiNFC Central93600.333141174-4.1-1.2144.56192.260.3374
1982Detroit LionsdetNFC Central94500.444181176-0.41.6177.86167.060.5432
1982Green Bay PackersgnbNFC Central95310.6112261694.71.6223.76167.060.6819
1982Minnesota VikingsminNFC Central95400.5561871982.1-1.0200.36190.460.5369
1982Tampa Bay BuccaneerstamNFC Central95400.556158178-0.51.2176.96170.660.5271
1982Dallas CowboysdalNFC East96300.6672261455.12.9227.36155.360.7279
1982New York GiantsnygNFC East94500.444164160-2.12.8162.56156.260.5286
1982Philadelphia EaglesphiNFC East93600.3331911952.6-2.1204.86200.360.5190
1982St. Louis CardinalscrdNFC East95400.556135170-4.11.4144.56168.860.4127
1982Washington RedskinswasNFC East98100.8891901282.25.1201.26135.560.7290
1982Atlanta FalconsatlNFC West95400.556183199-0.6-3.4176.06212.060.3893
1982Los Angeles RamsramNFC West92700.2222002500.8-8.0188.66253.460.3210
1982New Orleans SaintsnorNFC West94500.444129160-5.81.8129.26165.260.3636
1982San Francisco 49erssfoNFC West93600.3332092060.2-2.9183.26207.560.4266
1981Cincinnati BengalscinAFC Central1612400.7504213044.51.0402.73314.790.6482
1981Cleveland BrownscleAFC Central1651100.313276375-4.1-2.4265.13369.190.3016
1981Houston OilersotiAFC Central167900.438281355-3.1-1.6281.13356.390.3529
1981Pittsburgh SteelerspitAFC Central168800.5003562971.21.5349.93306.790.5774
1981Baltimore ColtscltAFC East1621400.125259533-3.8-12.0269.93522.790.1464
1981Buffalo BillsbufAFC East1610600.625311276-2.53.9290.73268.390.5438
1981Miami DolphinsmiaAFC East1611410.7193452750.12.8332.33285.990.5873
1981New England PatriotsnweAFC East1621400.125322370-0.6-3.1321.13380.390.3900
1981New York JetsnyjAFC East1610510.6563552870.21.7333.93303.590.5547
1981Denver BroncosdenAFC West1610600.625321289-1.62.9305.13284.390.5386
1981Kansas City ChiefskanAFC West169700.5633432900.42.8337.13285.990.5960
1981Oakland RaidersraiAFC West167900.438273343-3.60.0273.13330.790.3808
1981San Diego ChargerssdgAFC West1610600.6254783909.2-4.7477.93405.990.6039
1981Seattle SeahawksseaAFC West1661000.375322388-0.1-3.2329.13381.990.4021
1981Chicago BearschiNFC Central1661000.375253324-4.41.5260.33306.790.3982
1981Detroit LionsdetNFC Central168800.5003973224.80.5407.53322.790.6411
1981Green Bay PackersgnbNFC Central168800.5003243610.7-2.3341.93367.590.4500
1981Minnesota VikingsminNFC Central167900.4383253690.0-2.1330.73364.390.4348
1981Tampa Bay BuccaneerstamNFC Central169700.563315268-1.44.4308.33260.390.5964
1981Dallas CowboysdalNFC East1612400.7503672772.93.2377.13279.590.6746
1981New York GiantsnygNFC East169700.563295257-2.25.5295.53242.790.6108
1981Philadelphia EaglesphiNFC East1610600.6253682212.06.7362.73223.590.7601
1981St. Louis CardinalscrdNFC East167900.4383154080.1-4.8332.33407.590.3675
1981Washington RedskinswasNFC East168800.5003473492.2-1.2365.93349.990.5243
1981Atlanta FalconsatlNFC West167900.4384263556.5-2.6434.73372.390.5963
1981Los Angeles RamsramNFC West1661000.375303351-1.4-1.0308.33346.790.4230
1981New Orleans SaintsnorNFC West1641200.250207378-7.2-2.3215.53367.590.2108
1981San Francisco 49erssfoNFC West1613300.8133572501.34.9351.53252.390.6883
1980Cincinnati BengalscinAFC Central1661000.375244312-4.50.8255.61314.810.3766
1980Cleveland BrownscleAFC Central1611500.6883573101.70.1354.81326.010.5529
1980Houston OilersotiAFC Central1611500.688295251-2.74.4284.41257.210.5593
1980Pittsburgh SteelerspitAFC Central169700.5633523132.4-0.1366.01329.210.5665
1980Baltimore ColtscltAFC East167900.4383553872.8-4.3372.41396.410.4593
1980Buffalo BillsbufAFC East1611500.688320260-1.65.5302.01239.610.6342
1980Miami DolphinsmiaAFC East168800.500266305-4.63.1254.01278.010.4464
1980New England PatriotsnweAFC East1610600.6254413256.8-0.3436.41332.410.6695
1980New York JetsnyjAFC East1641200.250302395-1.5-3.6303.61385.210.3536
1980Denver BroncosdenAFC West168800.500310323-1.11.6310.01302.010.5158
1980Kansas City ChiefskanAFC West168800.500319336-0.80.3314.81322.810.4842
1980Oakland RaidersraiAFC West1611500.6883643062.91.3374.01306.810.6221
1980San Diego ChargerssdgAFC West1611500.6884183276.5-0.4431.61334.010.6602
1980Seattle SeahawksseaAFC West1641200.250291408-1.6-3.7302.01386.810.3482
1980Chicago BearschiNFC Central167900.438304264-1.22.6308.41286.010.5456
1980Detroit LionsdetNFC Central169700.563334272-0.82.5314.81287.610.5548
1980Green Bay PackersgnbNFC Central1651010.344231371-5.8-3.2234.81378.810.2356
1980Minnesota VikingsminNFC Central169700.5633173080.0-0.3327.61332.410.4906
1980Tampa Bay BuccaneerstamNFC Central1651010.344271341-3.5-1.6271.61353.210.3431
1980Dallas CowboysdalNFC East1612400.7504543117.80.1452.41326.010.7011
1980New York GiantsnygNFC East1641200.250249425-4.3-5.5258.81415.610.2327
1980Philadelphia EaglesphiNFC East1612400.7503842222.96.8374.01218.810.7866
1980St. Louis CardinalscrdNFC East1651100.313299350-1.7-0.7300.41338.810.4256
1980Washington RedskinswasNFC East1661000.375261293-4.43.3257.21274.810.4606
1980Atlanta FalconsatlNFC West1612400.7504052724.53.4399.61273.210.7221
1980Los Angeles RamsramNFC West1611500.6884242894.42.1398.01294.010.6826
1980New Orleans SaintsnorNFC West1611500.063291487-1.1-9.4310.01478.010.2435
1980San Francisco 49erssfoNFC West1661000.375320415-1.2-5.1308.41409.210.3266
1979Cincinnati BengalscinAFC Central1641200.2503374213.1-4.4370.75391.320.4667
1979Cleveland BrownscleAFC Central169700.5633593522.90.1367.55319.320.5896
1979Houston OilersotiAFC Central1611500.6883623312.91.4367.55298.520.6292
1979Pittsburgh SteelerspitAFC Central1612400.7504162626.85.1429.95239.320.8149
1979Baltimore ColtscltAFC East1651100.313271351-2.0-1.5289.15344.920.3941
1979Buffalo BillsbufAFC East167900.438268279-3.33.1268.35271.320.4951
1979Miami DolphinsmiaAFC East1610600.6253412570.34.0325.95256.920.6422
1979New England PatriotsnweAFC East169700.5634113266.1-1.1418.75338.520.6359
1979New York JetsnyjAFC East168800.5003373831.1-4.0338.75384.920.4206
1979Denver BroncosdenAFC West1610600.625289262-1.65.7295.55229.720.6464
1979Kansas City ChiefskanAFC West167900.438238262-4.05.4257.15234.520.5550
1979Oakland RaidersraiAFC West169700.5633653373.80.0381.95320.920.6105
1979San Diego ChargerssdgAFC West1612400.7504112466.05.7417.15229.720.8170
1979Seattle SeahawksseaAFC West169700.5633783724.9-2.3399.55357.720.5727
1979Chicago BearschiNFC Central1610600.625306249-2.22.1285.95287.320.4988
1979Detroit LionsdetNFC Central1621400.125219365-6.6-4.4215.55391.320.1899
1979Green Bay PackersgnbNFC Central1651100.313246316-5.3-1.5236.35344.920.2873
1979Minnesota VikingsminNFC Central167900.438259337-4.5-3.1249.15370.520.2750
1979Tampa Bay BuccaneerstamNFC Central1610600.625273237-4.61.8247.55292.120.4044
1979Dallas CowboysdalNFC East1611500.6883713133.00.3369.15316.120.5983
1979New York GiantsnygNFC East1661000.375237323-5.4-0.8234.75333.720.3014
1979Philadelphia EaglesphiNFC East1611500.6883392820.32.4325.95282.520.5884
1979St. Louis CardinalscrdNFC East1651100.313307358-0.7-2.0309.95352.920.4211
1979Washington RedskinswasNFC East1610600.6253482950.91.5335.55296.920.5768
1979Atlanta FalconsatlNFC West1661000.375300388-1.9-4.7290.75396.120.3157
1979Los Angeles RamsramNFC West169700.563323309-1.20.6301.95311.320.4829
1979New Orleans SaintsnorNFC West168800.5003703602.3-3.5357.95376.920.4685
1979San Francisco 49erssfoNFC West1621400.125308416-1.3-6.1300.35418.520.3015
1978Cincinnati BengalscinAFC Central1641200.250252284-2.71.3250.06272.520.4499
1978Cleveland BrownscleAFC Central168800.5003343562.5-4.5333.26365.320.4425
1978Houston OilersotiAFC Central1610600.625283298-0.60.2283.66290.120.4869
1978Pittsburgh SteelerspitAFC Central1614200.8753561952.65.6334.86203.720.7660
1978Baltimore ColtscltAFC East1651100.313239421-2.8-6.0248.46389.320.2476
1978Buffalo BillsbufAFC East1651100.313302354-0.1-3.2291.66344.520.3987
1978Miami DolphinsmiaAFC East1611500.6883722544.23.3360.46240.520.7295
1978New England PatriotsnweAFC East1611500.6883582863.61.4350.86270.920.6547
1978New York JetsnyjAFC East168800.5003593644.4-3.3363.66346.120.5320
1978Denver BroncosdenAFC West1610600.625282198-1.96.9262.86182.920.6955
1978Kansas City ChiefskanAFC West1641200.250243327-3.0-1.4245.26315.720.3533
1978Oakland RaidersraiAFC West169700.5633112831.61.1318.86275.720.5882
1978San Diego ChargerssdgAFC West169700.5633553094.6-0.9366.86307.720.6093
1978Seattle SeahawksseaAFC West169700.5633453583.4-3.7347.66352.520.4917
1978Chicago BearschiNFC Central167900.438253274-2.70.3250.06288.520.4162
1978Detroit LionsdetNFC Central167900.438290300-0.1-1.7291.66320.520.4429
1978Green Bay PackersgnbNFC Central168710.531249269-2.21.6258.06267.720.4788
1978Minnesota VikingsminNFC Central168710.5312943061.0-1.1309.26310.920.4972
1978Tampa Bay BuccaneerstamNFC Central1651100.313241259-4.10.8227.66280.520.3805
1978Dallas CowboysdalNFC East1612400.7503842085.85.2386.06210.120.8158
1978New York GiantsnygNFC East1661000.375264298-1.1-1.3275.66314.120.4217
1978Philadelphia EaglesphiNFC East169700.563270250-1.13.4275.66238.920.5839
1978St. Louis CardinalscrdNFC East1661000.375248296-2.60.0251.66293.320.4101
1978Washington RedskinswasNFC East168800.500273283-1.10.7275.66282.120.4866
1978Atlanta FalconsatlNFC West169700.563240290-3.7-0.9234.06307.720.3430
1978Los Angeles RamsramNFC West1612400.7503162451.31.9314.06262.920.6065
1978New Orleans SaintsnorNFC West167900.438281298-0.5-1.2285.26312.520.4450
1978San Francisco 49erssfoNFC West1621400.125219350-4.6-4.5219.66365.320.2257
1977Cincinnati BengalscinAFC Central148600.5712382350.61.6248.86218.060.5811
1977Cleveland BrownscleAFC Central146800.4292692672.40.1274.06239.060.5856
1977Houston OilersotiAFC Central148600.5712992304.42.3302.06208.260.7148
1977Pittsburgh SteelerspitAFC Central149500.6432832433.92.3295.06208.260.7023
1977Baltimore ColtscltAFC East1410400.7142952213.61.5290.86219.460.6679
1977Buffalo BillsbufAFC East1431100.214160313-4.3-3.7180.26292.260.2437
1977Miami DolphinsmiaAFC East1410400.7143131974.43.5302.06191.460.7531
1977New England PatriotsnweAFC East149500.6432782172.51.5275.46219.460.6369
1977New York JetsnyjAFC East1431100.214191300-3.8-2.0187.26268.460.3027
1977Denver BroncosdenAFC West1412200.8572741481.99.4267.06108.860.8862
1977Kansas City ChiefskanAFC West1421200.1432253490.9-5.8253.06321.660.3578
1977Oakland RaidersraiAFC West1411300.7863512308.81.6363.66218.060.7861
1977San Diego ChargerssdgAFC West147700.500222205-1.45.2220.86167.660.6548
1977Seattle SeahawksseaAFC West145900.3572823734.2-8.6299.26360.860.3846
1977Chicago BearschiNFC Central149500.6432552530.0-3.6240.46290.860.3888
1977Detroit LionsdetNFC Central146800.429183252-4.4-3.0178.86282.460.2565
1977Green Bay PackersgnbNFC Central1441000.286134219-9.10.4113.06234.860.1693
1977Minnesota VikingsminNFC Central149500.643231227-1.0-0.6226.46248.860.4473
1977Tampa Bay BuccaneerstamNFC Central1421200.143103223-11.10.385.06236.260.1020
1977Dallas CowboysdalNFC East1412200.8573452127.60.2346.86237.660.7242
1977New York GiantsnygNFC East145900.357181265-4.0-2.2184.46271.260.2903
1977Philadelphia EaglesphiNFC East145900.357220207-2.51.9205.46213.860.4802
1977St. Louis CardinalscrdNFC East147700.5002722872.6-4.0276.86296.460.4607
1977Washington RedskinswasNFC East149500.643196189-3.12.6197.06204.060.4834
1977Atlanta FalconsatlNFC West147700.500179129-6.16.6155.06148.060.5279
1977Los Angeles RamsramNFC West1410400.7143021463.84.6293.66176.060.7748
1977New Orleans SaintsnorNFC West1431100.2142323360.3-9.4244.66372.060.2595
1977San Francisco 49erssfoNFC West145900.357220260-1.1-2.7225.06278.260.3778
1976Cincinnati BengalscinAFC Central1410400.7143352105.05.1338.14196.690.7840
1976Cleveland BrownscleAFC Central149500.6432672870.7-2.4277.94301.690.4419
1976Houston OilersotiAFC Central145900.357222273-2.71.0230.34254.090.4346
1976Pittsburgh SteelerspitAFC Central1410400.7143421385.79.6347.94133.690.9010
1976Baltimore ColtscltAFC East1411300.7864172469.30.4398.34262.490.7394
1976Buffalo BillsbufAFC East1421200.143245363-2.5-6.7233.14361.890.2413
1976Miami DolphinsmiaAFC East146800.429263264-1.81.7242.94244.290.4898
1976New England PatriotsnweAFC East1411300.7863762366.52.2359.14237.290.7330
1976New York JetsnyjAFC East1431100.214169383-7.1-6.8168.74363.290.1254
1976Denver BroncosdenAFC West149500.6433152062.54.4303.14206.490.7105
1976Kansas City ChiefskanAFC West145900.3572903762.2-6.9298.94364.690.3672
1976Oakland RaidersraiAFC West1413100.9293502376.32.2356.34237.290.7289
1976San Diego ChargerssdgAFC West146800.429248285-1.70.5244.34261.090.4531
1976Tampa Bay BuccaneerstamAFC West1401400.000125412-10.8-8.8116.94391.290.0439
1976Chicago BearschiNFC Central147700.5002532160.34.2272.34209.290.6456
1976Detroit LionsdetNFC Central146800.429262220-0.63.4259.74220.490.5898
1976Green Bay PackersgnbNFC Central145900.357218299-2.5-2.0233.14296.090.3508
1976Minnesota VikingsminNFC Central1411210.8213051763.75.7319.94188.290.7765
1976Dallas CowboysdalNFC East1411300.7862961940.54.0275.14212.090.6444
1976New York GiantsnygNFC East1431100.214170250-5.52.1191.14238.690.3667
1976Philadelphia EaglesphiNFC East1441000.286165286-7.3-1.4165.94287.690.2077
1976St. Louis CardinalscrdNFC East1410400.7143092673.5-1.0317.14282.090.5665
1976Washington RedskinswasNFC East1410400.7142912171.21.8284.94242.890.5896
1976Atlanta FalconsatlNFC West1441000.286172312-6.7-3.5174.34317.090.1849
1976Los Angeles RamsramNFC West1410310.7503511905.94.5350.74205.090.7840
1976New Orleans SaintsnorNFC West1441000.286253346-0.6-5.5259.74345.090.3207
1976San Francisco 49erssfoNFC West148600.571270190-1.35.0249.94198.090.6264
1976Seattle SeahawksseaNFC West1421200.143229429-2.2-12.9237.34448.690.1525
1975Cincinnati BengalscinAFC Central1411300.7863402464.02.9344.27247.560.6979
1975Cleveland BrownscleAFC Central1431100.214218372-2.6-4.2251.87346.960.3097
1975Houston OilersotiAFC Central1410400.7142932261.25.2305.07215.360.7019
1975Pittsburgh SteelerspitAFC Central1412200.8573731625.48.8363.87164.960.8755
1975Baltimore ColtscltAFC East1410400.7143952696.32.2376.47257.360.7274
1975Buffalo BillsbufAFC East148600.57142035510.4-3.4433.87335.760.6671
1975Miami DolphinsmiaAFC East1410400.7143572223.36.0334.47204.160.7725
1975New England PatriotsnweAFC East1431100.214258358-2.3-2.0256.07316.160.3729
1975New York JetsnyjAFC East1431100.214258433-1.2-7.1271.47387.560.2864
1975Denver BroncosdenAFC West146800.429254307-2.7-0.7250.47297.960.3959
1975Kansas City ChiefskanAFC West145900.357282341-0.6-3.7279.87339.960.3801
1975Oakland RaidersraiAFC West1411300.7863752555.51.3365.27269.960.6860
1975San Diego ChargerssdgAFC West1421200.143189345-6.0-3.4204.27335.760.2289
1975Chicago BearschiNFC Central1441000.286191379-4.9-6.6219.67380.560.2012
1975Detroit LionsdetNFC Central147700.500245262-3.21.3243.47269.960.4391
1975Green Bay PackersgnbNFC Central1441000.286226285-3.3-0.9242.07300.760.3708
1975Minnesota VikingsminNFC Central1412200.8573771803.55.4337.27212.560.7594
1975Dallas CowboysdalNFC East1410400.7143502684.00.1344.27286.760.6163
1975New York GiantsnygNFC East145900.357216306-6.2-0.6201.47296.560.2839
1975Philadelphia EaglesphiNFC East1441000.286225302-4.0-0.6232.27296.560.3562
1975St. Louis CardinalscrdNFC East1411300.7863562763.40.1335.87286.760.6009
1975Washington RedskinswasNFC East148600.5713252762.60.2324.67285.360.5826
1975Atlanta FalconsatlNFC West1441000.286240289-2.7-0.8250.47299.360.3930
1975Los Angeles RamsramNFC West1412200.8573121350.58.7295.27166.360.7970
1975New Orleans SaintsnorNFC West1421200.143165360-8.2-5.9173.47370.760.1347
1975San Francisco 49erssfoNFC West145900.357255286-2.2-2.5257.47323.160.3629
1974Cincinnati BengalscinAFC Central147700.5002832591.90.2281.14251.740.5704
1974Cleveland BrownscleAFC Central1441000.2862513440.5-4.7261.54320.340.3787
1974Houston OilersotiAFC Central147700.500236282-1.3-0.6236.34262.940.4391
1974Pittsburgh SteelerspitAFC Central1410310.7503051892.34.5286.74191.540.7270
1974Baltimore ColtscltAFC East1421200.143190329-4.6-4.1190.14311.940.2352
1974Buffalo BillsbufAFC East149500.643264244-0.31.4250.34234.940.5411
1974Miami DolphinsmiaAFC East1411300.7863272163.92.3309.14222.340.6948
1974New England PatriotsnweAFC East147700.5003482896.6-1.8346.94279.740.6372
1974New York JetsnyjAFC East147700.5002793001.1-3.7269.94306.340.4247
1974Denver BroncosdenAFC West147610.5363022943.4-2.8302.14293.740.5209
1974Kansas City ChiefskanAFC West145900.357233293-1.3-1.1236.34269.940.4233
1974Oakland RaidersraiAFC West1412200.8573552286.42.7344.14216.740.7624
1974San Diego ChargerssdgAFC West145900.357212285-3.5-1.3205.54272.740.3403
1974Chicago BearschiNFC Central1441000.286152279-7.4-2.9150.94295.140.1747
1974Detroit LionsdetNFC Central147700.5002562700.5-2.1261.54283.940.4526
1974Green Bay PackersgnbNFC Central146800.429210206-3.22.0209.74226.540.4582
1974Minnesota VikingsminNFC Central1410400.7143101953.62.5304.94219.540.6937
1974Dallas CowboysdalNFC East148600.5712972354.01.9310.54227.940.6846
1974New York GiantsnygNFC East1421200.143195299-3.5-2.1205.54283.940.3182
1974Philadelphia EaglesphiNFC East147700.5002422170.03.0254.54212.540.6085
1974St. Louis CardinalscrdNFC East1410400.7142852182.83.0293.74212.540.6896
1974Washington RedskinswasNFC East1410400.7143201965.74.5334.34191.540.7992
1974Atlanta FalconsatlNFC West1431100.214111271-9.7-2.6118.74290.940.1161
1974Los Angeles RamsramNFC West1410400.714263181-0.14.0253.14198.540.6424
1974New Orleans SaintsnorNFC West145900.357166263-5.7-1.7174.74278.340.2533
1974San Francisco 49erssfoNFC West146800.429226236-2.1-0.5225.14261.540.4142
1973Cincinnati BengalscinAFC Central1410400.7142862310.12.9273.69231.750.5939
1973Cleveland BrownscleAFC Central147520.571234255-2.71.3234.49254.150.4463
1973Houston OilersotiAFC Central1411300.071199447-4.4-12.4210.69445.950.1205
1973Pittsburgh SteelerspitAFC Central1410400.7143472104.23.5331.09223.350.7207
1973Baltimore ColtscltAFC East1441000.286226341-2.4-5.9238.69354.950.2635
1973Buffalo BillsbufAFC East149500.643259230-1.72.2248.49241.550.5115
1973Miami DolphinsmiaAFC East1412200.8573431505.18.3343.69156.150.8650
1973New England PatriotsnweAFC East145900.357258300-2.5-3.4237.29319.950.3172
1973New York JetsnyjAFC East1441000.286240306-1.5-1.3251.29290.550.4061
1973Denver BroncosdenAFC West147520.5713542965.4-2.5347.89307.350.5738
1973Kansas City ChiefskanAFC West147520.571231192-4.25.1213.49200.950.5293
1973Oakland RaidersraiAFC West149410.6792921750.06.6272.29179.950.7208
1973San Diego ChargerssdgAFC West1421110.179188386-3.7-8.4220.49389.950.1851
1973Chicago BearschiNFC Central1431100.214195334-4.4-4.4210.69333.950.2376
1973Detroit LionsdetNFC Central146710.4642712470.81.2283.49255.550.5580
1973Green Bay PackersgnbNFC Central145720.429202259-5.00.2202.29269.550.3300
1973Minnesota VikingsminNFC Central1412200.8572961681.76.9296.09175.750.7704
1973Dallas CowboysdalNFC East1410400.7143822036.86.0367.49188.350.8343
1973New York GiantsnygNFC East1421110.179226362-2.8-4.7233.09338.150.2777
1973Philadelphia EaglesphiNFC East145810.3933103933.5-7.7321.29380.150.3859
1973St. Louis CardinalscrdNFC East144910.3212863651.8-5.1297.49343.750.4028
1973Washington RedskinswasNFC East1410400.7143251981.26.1289.09186.950.7334
1973Atlanta FalconsatlNFC West149500.6433182242.33.6304.49221.950.6787
1973Los Angeles RamsramNFC West1412200.8573881788.15.2385.69199.550.8340
1973New Orleans SaintsnorNFC West145900.357163312-7.0-1.7174.29296.150.2153
1973San Francisco 49erssfoNFC West145900.3572623191.4-1.6291.89294.750.4884
1972Cincinnati BengalscinAFC Central148600.5712992291.23.0300.34241.590.6239
1972Cleveland BrownscleAFC Central1410400.714268249-1.61.9261.14256.990.5028
1972Houston OilersotiAFC Central1411300.071164380-7.1-5.9184.14366.190.1475
1972Pittsburgh SteelerspitAFC Central1411300.7863431753.46.6331.14191.190.7856
1972Baltimore ColtscltAFC East145900.357235252-5.12.8212.14244.390.4102
1972Buffalo BillsbufAFC East144910.321257377-1.6-5.6261.14361.990.2961
1972Miami DolphinsmiaAFC East1414001.0003851714.56.5346.54192.590.8023
1972New England PatriotsnweAFC East1431100.214192446-6.3-11.1195.34438.990.1047
1972New York JetsnyjAFC East147700.5003673244.7-4.2349.34342.390.5061
1972Denver BroncosdenAFC West145900.3573253502.9-4.7324.14349.390.4444
1972Kansas City ChiefskanAFC West148600.5712872540.42.2289.14252.790.5750
1972Oakland RaidersraiAFC West1410310.7503652485.03.0353.54241.590.7161
1972San Diego ChargerssdgAFC West144910.321264344-0.2-2.6280.74319.990.4111
1972Chicago BearschiNFC Central144910.321225275-2.81.5244.34262.590.4495
1972Detroit LionsdetNFC Central148510.6073392904.40.0345.14283.590.6159
1972Green Bay PackersgnbNFC Central1410400.7143042262.34.7315.74217.790.7063
1972Minnesota VikingsminNFC Central147700.5003012522.63.4319.94235.990.6731
1972Dallas CowboysdalNFC East1410400.7143192403.42.7331.14245.790.6712
1972New York GiantsnygNFC East148600.5713312473.52.4332.54249.990.6646
1972Philadelphia EaglesphiNFC East1421110.179145352-9.2-5.3154.74357.790.1084
1972St. Louis CardinalscrdNFC East144910.321193303-4.5-1.2220.54300.390.3130
1972Washington RedskinswasNFC East1411300.7863362182.73.7321.34231.790.6849
1972Atlanta FalconsatlNFC West147700.500269274-2.30.4251.34277.990.4316
1972Los Angeles RamsramNFC West146710.4642912860.1-0.6284.94291.990.4777
1972New Orleans SaintsnorNFC West1421110.179215361-5.3-5.0209.34353.590.2066
1972San Francisco 49erssfoNFC West148510.6073532494.91.5352.14262.590.6712
1971Cincinnati BengalscinAFC Central1441000.286284265-0.4-0.1265.37272.640.4793
1971Cleveland BrownscleAFC Central149500.6432852731.1-0.8286.37282.440.5046
1971Houston OilersotiAFC Central144910.321251330-3.0-3.8228.97324.440.2927
1971Pittsburgh SteelerspitAFC Central146800.429246292-1.8-1.8245.77296.440.3825
1971Baltimore ColtscltAFC East1410400.7143131402.08.5298.97152.240.8264
1971Buffalo BillsbufAFC East1411300.071184394-4.5-8.9207.97395.840.1600
1971Miami DolphinsmiaAFC East1410310.7503151742.45.3304.57197.040.7372
1971New England PatriotsnweAFC East146800.429238325-2.1-3.0241.57313.240.3404
1971New York JetsnyjAFC East146800.429212299-3.7-1.6219.17293.640.3254
1971Denver BroncosdenAFC West144910.321203275-5.51.0193.97257.240.3356
1971Kansas City ChiefskanAFC West1410310.7503022080.64.5279.37208.240.6653
1971Oakland RaidersraiAFC West148420.6433442784.8-1.1338.17286.640.5999
1971San Diego ChargerssdgAFC West146800.4293113412.6-6.6307.37363.640.3885
1971Chicago BearschiNFC Central146800.429185276-4.41.1209.37255.840.3793
1971Detroit LionsdetNFC Central147610.5363412866.5-2.4361.97304.840.6055
1971Green Bay PackersgnbNFC Central144820.3572742981.4-2.3290.57303.440.4687
1971Minnesota VikingsminNFC Central1411300.786245139-3.49.9223.37132.640.7568
1971Dallas CowboysdalNFC East1411300.7864062228.31.6387.17248.840.7523
1971New York GiantsnygNFC East1441000.286228362-1.7-6.3247.17359.440.2751
1971Philadelphia EaglesphiNFC East146710.464221302-2.7-1.6233.17293.640.3586
1971St. Louis CardinalscrdNFC East144910.321231279-4.0-0.2214.97274.040.3542
1971Washington RedskinswasNFC East149410.679276190-0.65.8262.57190.040.6777
1971Atlanta FalconsatlNFC West147610.5362742770.31.0275.17257.240.5372
1971Los Angeles RamsramNFC West148510.6073132604.22.4329.77237.640.6894
1971New Orleans SaintsnorNFC West144820.3572663471.4-4.1290.57328.640.4182
1971San Francisco 49erssfoNFC West149500.6433002162.43.8304.57218.040.6893
1970Cincinnati BengalscinAFC Central148600.5713122551.2-0.6286.47278.120.5201
1970Cleveland BrownscleAFC Central147700.5002862650.50.1276.67268.320.5206
1970Houston OilersotiAFC Central1431010.250217352-3.5-5.8220.67350.920.2408
1970Pittsburgh SteelerspitAFC Central145900.357210272-5.9-1.5187.07290.720.2604
1970Baltimore ColtscltAFC East1411210.8213212340.9-0.5282.27276.720.5140
1970Boston PatriotsnweAFC East1421200.143149361-9.1-6.8142.27364.920.0943
1970Buffalo BillsbufAFC East1431010.250204337-5.8-6.5188.47360.720.1691
1970Miami DolphinsmiaAFC East1410400.714297228-1.30.0251.47269.720.4591
1970New York JetsnyjAFC East1441000.286255286-2.2-2.7238.87307.520.3507
1970Denver BroncosdenAFC West145810.393253264-2.5-0.1234.67271.120.4152
1970Kansas City ChiefskanAFC West147520.571272244-0.11.6268.27247.320.5510
1970Oakland RaidersraiAFC West148420.6433002932.3-1.3301.87287.920.5314
1970San Diego ChargerssdgAFC West145630.4642822780.5-1.2276.67286.520.4800
1970Chicago BearschiNFC Central146800.4292562610.41.8275.27244.520.5734
1970Detroit LionsdetNFC Central1410400.7143472027.46.6373.27177.320.8647
1970Green Bay PackersgnbNFC Central146800.429196293-2.40.6236.07261.320.4407
1970Minnesota VikingsminNFC Central1412200.8573351435.99.2352.27140.920.9024
1970Dallas CowboysdalNFC East1410400.7142992212.54.5304.67206.720.7212
1970New York GiantsnygNFC East149500.6433012701.90.1296.27268.320.5630
1970Philadelphia EaglesphiNFC East1431010.250241332-0.9-3.6257.07320.120.3678
1970St. Louis CardinalscrdNFC East148510.6073252283.83.6322.87219.320.7234
1970Washington RedskinswasNFC East146800.4292973143.6-0.6320.07278.120.5894
1970Atlanta FalconsatlNFC West144820.357206261-3.51.2220.67252.920.4211
1970Los Angeles RamsramNFC West149410.6793252024.45.3331.27195.520.7858
1970New Orleans SaintsnorNFC West1421110.179172347-4.6-3.3205.27315.920.2606
1970San Francisco 49erssfoNFC West1410310.7503522676.40.1359.27268.320.6799

Now, as an aside, I wouldn’t go plugging those directly into the log5 formula to predict this weekend’s games just yet. You first need to regress to the mean to account for the uncertainty we see in any observed result. To do that, just add about 17.65 games of .500 performance to each team’s pythagorean Wpct, and you’ll get a “true talent” number that should yield more accurate probabilities regarding future outcomes.

{ 6 comments }

Looking back: The most surprising games of the year

Five weeks ago, I looked at the most surprising results of the season. It’s time to update that post now that most of the season is in the books.

First, we need to rank the teams. The table below shows each team’s current Simple Rating System rating through week 15. As a reminder, the SRS is simply the sum of a team’s margin of victory and strength of schedule.

RkTeamGMOVSOSSRS
1New England Patriots1413.4-0.213.3
2San Francisco 49ers149.91.711.7
3Seattle Seahawks149.81.210.9
4Denver Broncos1410.1-0.79.4
5Atlanta Falcons148-17
6New York Giants144.91.76.6
7Chicago Bears145.40.86.2
8Houston Texans148.1-26.1
9Green Bay Packers143.71.65.3
10Washington Redskins142.213.2
11Baltimore Ravens142.9-0.82.1
12New Orleans Saints140.71.11.8
13Cincinnati Bengals144.4-2.81.7
14Minnesota Vikings140.80.51.3
15Dallas Cowboys14-0.81.70.9
16Carolina Panthers14-1.62.10.5
17Tampa Bay Buccaneers140.4-0.20.2
18Pittsburgh Steelers141.2-1.9-0.7
19St. Louis Rams14-4.33-1.3
20Miami Dolphins14-1.1-1-2.1
21San Diego Chargers14-0.9-1.5-2.4
22Detroit Lions14-3.10.6-2.5
23Arizona Cardinals14-5.62.5-3.1
24New York Jets14-4.60.8-3.8
25Cleveland Browns14-2.6-2.2-4.7
26Indianapolis Colts14-3.5-2.3-5.8
27Buffalo Bills14-6.9-0.1-6.9
28Philadelphia Eagles14-8.71-7.7
29Tennessee Titans14-7.9-0.7-8.7
30Oakland Raiders14-10.4-1.3-11.7
31Jacksonville Jaguars14-11.7-1.5-13.2
32Kansas City Chiefs14-12.3-1.3-13.6

Eli does not like being surprised.

Half the time, Eli does not like being surprised.

Now that we have each team’s SRS score, it’s easy to come up with a projected game score. For example, since Miami has an SRS of -2.1 and Tennessee has an SRS of -8.7, this means the Dolphins are 6.5 points (rounding error) better than the Titans. Therefore, if Tennessee played at Miami, we would expect Miami to win by 9.5 points.

Well, Tennessee did travel to Miami, but the Titans won the game 37-3. Ouch. Instead of a 9.5-point win, the Dolphins suffered a 34-point loss. Therefore, this game was shocking to the tune of -43.5 points from the standpoint of the Dolphins. That makes it the most surprising game of the year.

Such a method is obviously going to be slanted towards blowouts. What if we wanted to just know which results were the most shocking? If you sort the table below by EXP_MOV — that’s the expected score — and type in “Loss” in the search box, you can see the biggest upsets.

According to the SRS, there were two huge upsets this year that only look more surprising in retrospect. The Patriots should have beaten the Cardinals by 19.4 points in Foxboro, but somehow lost in the final seconds. Meanwhile, the Saints at home against the Chiefs projected as an 18.4-point New Orleans win; it ended up being a Kansas City overtime victory.
[continue reading…]

{ 4 comments }

Here’s a quick set of quarterback ratings I was messing around with, based on Doug’s Simple Rating System. The basic setup: I took every passer-game (Att > 0) since the 2010 season, weighting for recency according to Wayne Winston’s method. I ran the data through the SRS to adjust for the quality of opponent pass defenses, creating a predicted Net YPA rate for each passer in each game via the following formula:

Predicted NYPA = League Constant + Home-Field Advantage + Passer Rating – Opponent Pass D Rating

The league constant in this case was a Net YPA of 6.24; the homefield component (which was positive while at home, negative on the road, and 0 in Super Bowls) was 0.05. Minimize the sum of squared errors between predicted and actual NYPA for each passer-game (weighted by recency and how many dropbacks the passer had in the game), and you’ve got a set of opponent-adjusted, recency-weighted QB ratings.

Throwing out the Brett Favres and Curtis Painters of the world who haven’t been active this year, here are the full ratings:

PlayerWgtd DrpbksNYPA Rating
Mohamed Sanu0.660.94
Brian Hoyer0.29.80
Shaun Hill8.85.13
Derek Anderson2.93.96
Kirk Cousins47.22.37
Chase Daniel1.22.02
Matt Flynn13.21.74
Tom Brady467.01.23
Kyle Orton20.71.16
Russell Wilson266.00.95
Robert Griffin III257.70.92
Peyton Manning382.90.78
Drew Brees472.30.75
Matt Ryan440.80.73
Colin Kaepernick147.40.72
Eli Manning399.10.64
Cam Newton359.50.64
Tony Romo468.30.54
Aaron Rodgers394.90.50
Kellen Clemens9.70.45
Matt Schaub376.30.39
Alex Smith176.10.39
Charlie Batch66.10.37
Josh Freeman395.00.28
Ben Roethlisberger324.60.23
Carson Palmer445.60.15
Matthew Stafford521.20.10
Joe Flacco410.40.00
Rusty Smith3.3-0.03
Tyrod Taylor2.5-0.10
Andrew Luck433.0-0.11
Jake Locker192.4-0.11
Sam Bradford399.1-0.15
Josh McCown4.7-0.17
Matt Moore36.9-0.18
Tarvaris Jackson26.4-0.20
Ryan Tannehill320.8-0.20
Rex Grossman27.3-0.21
Jordan Palmer0.0-0.27
Michael Vick231.4-0.30
Brandon Weeden367.1-0.40
Andy Dalton395.9-0.40
Dennis Dixon0.1-0.41
Ryan Fitzpatrick374.6-0.43
Jay Cutler307.5-0.43
Philip Rivers419.2-0.49
Drew Stanton0.5-0.56
Matt Hasselbeck181.8-0.58
Chad Henne212.4-0.59
Matt Cassel196.9-0.62
Mark Sanchez318.0-0.69
Dan Orlovsky21.3-0.76
Joe Webb5.3-0.77
Tyler Thigpen6.2-0.88
Colt McCoy24.7-0.90
Tim Tebow28.3-0.96
John Skelton172.9-1.04
Bruce Gradkowski1.4-1.09
Nick Foles205.3-1.16
Blaine Gabbert213.0-1.23
Christian Ponder334.1-1.23
T.J. Yates22.1-1.24
Kevin Kolb132.1-1.38
Jason Campbell55.1-1.46
Brady Quinn147.2-1.49
Charlie Whitehurst3.3-1.91
Byron Leftwich45.4-2.13
Trent Edwards0.4-2.13
Luke McCown2.5-2.14
Jimmy Clausen1.3-2.17
Ryan Mallett3.1-2.26
Caleb Hanie7.9-2.30
Ryan Lindley133.6-2.37
Greg McElroy7.0-2.51
Graham Harrell2.0-2.79
David Carr1.2-4.09
Matt Leinart1.6-4.71
Brad Smith0.7-6.04
Terrelle Pryor1.0-7.09

[continue reading…]

{ 1 comment }

Checkdowns: Elo-Ratings for NFL teams

So we're going to pretend all my losses were by 1 point?

So we're going to pretend all my losses were by 1 point?

Just a quick Friday night checkdown post. By now, you’re very familiar with the Simple Rating System. I used the SRS to create college football ratings every week this season and used the SRS to grade NFL teams earlier this year. Pro-Football-Reference.com calculates SRS ratings every week and they are always available on their Standings page.

The first S in SRS stands for Simple because the SRS is simply the sum of two variables: a team’s average margin of victory (or points differential) and a team’s strength of schedule.

But what if we only care about wins and losses? Even in that case, we still care about strength of schedule. The BCS mandates that the computer systems used to provide the official BCS ratings ignore margin of victory. Essentially, that’s what I’m doing here. To provide Elo-style ratings for NFL teams, I made each win a one-point win, each loss a one-point loss, and each tie worth 0 points. Therefore, a team’s MOV perfectly matches its record, leaving just the SOS to shuffle the deck.

Is this useful for anything? No. That’s why it’s a Friday night checkdown.

RkTeamGMOVSOSSRSRecord
1Houston Texans130.6920.0110.70411-2-0
2New England Patriots130.5380.1160.65410-3-0
3San Francisco 49ers130.4620.0810.5439-3-1
4Green Bay Packers130.3850.1070.4929-4-0
5Atlanta Falcons130.692-0.2730.4211-2-0
6Denver Broncos130.538-0.1660.37310-3-0
7Chicago Bears130.2310.1210.3528-5-0
8Seattle Seahawks130.2310.1140.3458-5-0
9Indianapolis Colts130.385-0.0530.3329-4-0
10Baltimore Ravens130.385-0.1350.2499-4-0
11New York Giants130.231-0.040.1918-5-0
12St. Louis Rams1300.1750.1756-6-1
13Minnesota Vikings130.0770.0670.1447-6-0
14New York Jets13-0.0770.1720.0956-7-0
15Washington Redskins130.077-0.0030.0747-6-0
16Dallas Cowboys130.077-0.0120.0657-6-0
17Cincinnati Bengals140.143-0.203-0.068-6-0
18Pittsburgh Steelers130.077-0.138-0.0617-6-0
19Miami Dolphins13-0.2310.126-0.1055-8-0
20Buffalo Bills13-0.2310.067-0.1645-8-0
21Arizona Cardinals13-0.3850.203-0.1814-9-0
22Detroit Lions13-0.3850.188-0.1974-9-0
23Tampa Bay Buccaneers13-0.077-0.162-0.2396-7-0
24Tennessee Titans13-0.3850.134-0.254-9-0
25New Orleans Saints13-0.231-0.035-0.2665-8-0
26Cleveland Browns13-0.231-0.125-0.3565-8-0
27Carolina Panthers13-0.3850.014-0.3714-9-0
28San Diego Chargers13-0.231-0.165-0.3965-8-0
29Philadelphia Eagles14-0.429-0.048-0.4764-10-0
30Jacksonville Jaguars13-0.6920.141-0.5512-11-0
31Oakland Raiders13-0.538-0.112-0.6513-10-0
32Kansas City Chiefs13-0.692-0.148-0.842-11-0
{ 2 comments }

Week 12 College Football SRS Ratings

Your assumptions are no longer valid.

Kansas State entered the weekend as the most balanced team in college football. Through 11 weeks, Baylor ranked 120th in yards allowed and 118th in points allowed. But last night in Waco, the Wildcats were unable to do much of anything on offense. Collin Klein had never thrown more than one interception in a game in his career; he threw 3 against the Bears. Kansas State was averaging 213 rushing yards per game, but Baylor limited them to just 76 rushing yards. The Wildcats hadn’t allowed more than 30 points in a game this year; Baylor scored 52 points in the first three quarters and ended the game with 580 yards of offense. The most balanced and consistent team in the country was demolished by one of the most one-dimensional teams in college football.

Who needs Andrew Luck?

At the same time, another surprise was happening in Eugene. If there was one thing we knew in 2012, it was that the Oregon offense was unstoppable. This has been the case for years — since Chip Kelly arrived in 2007, the Ducks had scored at least 24 points in every home game. Against Stanford, the Ducks were held to just 14 points in an overtime loss.

In their first years in the post-Andrew Luck and post-Robert Griffin III, the Stanford and Baylor programs dominated the college football headlines on the most important weekend of the season. For the first time in five years, the #1 and #2 teams in the BCS fell on the same day, rendering all of our national championship game assumptions moot.

This much is clear: if Notre Dame defeats USC at the Coliseum on Saturday, the Fighting Irish are going to the BCS National Championship Game. The winner of the SEC Championship Game is going there as well, barring an upset by Georgia Tech in Athens this weekend. [1]No, we’re not getting into hypotheticals that involve Auburn beating Alabama. I maintain that Georgia is far less deserving of its spot in Atlanta than Florida, who has the most impressive trio of wins this year by defeating LSU, Texas A&M, and South Carolina. Georgia lost to South Carolina but beat Florida, which gave them the tiebreaker and the division crown. But the real key for Bulldogs was that they faced Mississippi and Auburn in the West, not LSU and A&M; as a result, they are the SEC East Champions.

But now is the time for more relevant debates. Assuming an upset — either by USC, or by Georgia Tech coupled with a Georgia upset against Alabama — who is next in line? At that point, four teams will have legitimate claims for the other golden ticket: Florida, Florida State, Oregon, and Kansas State. Fortunately, the Gators and Seminoles play each other on Saturday, which would leaves us with just three promising candidates.

If they defeat Florida State, Florida is the clear “next team up” following a slip-up by Notre Dame or in the event of a two-loss SEC Champ. The computers would love them due to their strength of schedule, and the voters should love them for the same reason and the bump they would get for defeating Florida State.

If FSU wins, their case is much weaker. The computers hate them, and for good reason: they haven’t beaten any good teams. Defeating the Gators would give them a big bump, and they’ll get a chance to beat mediocre team in the ACC Championship Game, but consider: Outside of 10-1 Clemson, each of FSU’s other 9 victories have come against ACC, Big East, or FCS schools that have at least 5 losses. And how good is Clemson? Yes, they have a nice record, but their 10 wins have come against Ball State (#64 in the SRS), and ACC, SEC, or FCS teams with at least five losses.

According to the SRS, North Carolina is the 3rd best team in the conference and they rank 45th. FSU lost to a bad N.C. State team, while while Oregon (in particular) and Kansas State have much more palatable losses. FSU’s argument would be two parts “we lost earliest” and one part “we beat Florida and Clemson, even if Clemson hasn’t beaten anybody.” Florida State’s overall strength of schedule is far inferior to that both Oregon’s and Kansas State’s. In my opinion, even with a win over Florida, the Seminoles likely do not jump both Oregon and Kansas State in the BCS, nor should they.

And consider: if Stanford defeats UCLA this weekend, the Cardinal — and not Oregon — would win the Pac-12 North, which would deal a significant blow to Nike University. Kansas State still needs to get by Texas, but tonight might not end up being a season killer. At this point, they need to root for USC and Florida State, which is historically not a bad position to be in. My guess is Kansas State is next in line after an undefeated Notre Dame, a one-loss SEC Champ, and a one-loss Florida team. It’s possible only one of those three exist by the end of the season.

Let’s take a look at the SRS ratings after 11 weeks. As always, thanks to Dr. Peter R. Wolfe. [continue reading…]

References

References
1 No, we’re not getting into hypotheticals that involve Auburn beating Alabama.
{ 8 comments }
Next Posts Previous Posts