≡ Menu

Below are my 2014 projected quarterback rankings. Let me be very clear at the top of this post as to exactly what these rankings mean: they represent my projections of the order in which these quarterbacks will finish in my preferred measure of quarterback play. Everyone has their own measuring sticks when it comes to quarterbacks; for me, it’s Adjusted Net Yards provided above league-average. As a reminder, here is how we calculate that metric.

First, we start with Adjusted Net Yards per Attempt, which is calculated as follows:

(Passing Yards + 20 * PassTDs – 45 * INTs – Sack Yards Lost) / (Pass Attempts + Sacks)

Then, we take each quarterback’s ANY/A average, and subtract from that number the league average ANY/A metric, which should be around 5.9 ANY/A. Then, we multiply that difference by the quarterback’s number of dropbacks.

Last year, Peyton Manning led the league in this category, with 2,037 Adjusted Net Yards of value provided above average. The benefit to this approach to ranking passers is that the results are easy to test. At the end of the season, we can calculate the actual results, and then look back and laugh at this post.

So, ranking 1-32, here is how I project the top quarterback for each team to finish in 2014.

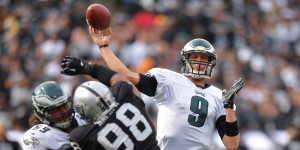
No, Peyton, you're the number one

No, Peyton, you're the number one.

1) Peyton Manning, Denver Broncos

There’s a reason Manning is the heavy favorite to repeat as NFL MVP. The Broncos lost Eric Decker and Knowshon Moreno, and Wes Welker’s concussion concerns only worsened this preseason. No matter: Manning remains the gold standard. Denver added Emmanuel Sanders in the offseason, and he caught five passes for 128 yards with two touchdowns against Houston in the preseason. Manning has led the NFL in sack rate in three of his last four seasons, and the return of Ryan Clady should make Manning even more difficult to sack in 2014. No need to over think this one: Manning is the clear favorite to again provide the most value of any quarterback in the league.

2) Aaron Rodgers, Green Bay Packers

3) Drew Brees, New Orleans Saints

Choosing between Brees and Rodgers is tough, but the return of a healthy Randall Cobb and the departure of Darren Sproles is enough to tip the scales towards Rodgers for me. Green Bay tends to forget about the little things — Corey Linsley, a fourth round pick, will be the team’s starting center — but Rodgers has a way of curing all ills. Brees turns 36 in January, which is yet another reason to break ties in favor of Rodgers. Since ’09, Rodgers is the league-leader in ANY/A, while over that period, Brees has thrown the most touchdowns and gained the most yards. If Manning isn’t the king in 2014, it’s a good bet that either Rodgers or Brees took the crown. [continue reading…]

{ 42 comments }

Projecting Success for New Head Coaches

In 1995, Football Outsiders graded the Eagles special teams as the worst in the NFL. The next two years, Philadelphia ranked 20th and 26th, respectively. In 1998, after hiring a new special teams coordinator, the team still finished just 25th. But, over the next eight years, the Eagles’ special teams flipped dramatically, ranking as the second-best in football during that period. In fact, from 2000-2004, Philadelphia ranked in the top five in the Football Outsiders’ special teams ratings each season.

When the Ravens hired the coordinator of those special teams, John Harbaugh, as their head coach in 2008, Baltimore turned one of the more surprising coaching hires in recent history into one of the best. Based on where the team was when it hired him, Harbaugh’s first three years were about the best since 1990 of any coach not named Harbaugh, at least according to DVOA. The Ravens made the playoffs in Harbaugh’s first five seasons, winning the Super Bowl in the last of those. Harbaugh’s success even caused Chase to wonder whether it would change the way teams hired head coaches.

Since Harbaugh was so successful as a coordinator, does that mean he was a good bet to be a successful head coach? At first glance, you might think just about every coordinator who gets promoted or poached to become a head coach was very successful in his previous job. As it turns out, that’s not always the case. Once we correct for expectations, a little more than one in four hired head coaches actually underperformed in their previous jobs, at least according to DVOA.

Consider one man who performed particularly poorly as a coordinator: Eric Mangini. The 2005 New England defense had a DVOA that was 15.2 points lower than we would have predicted based on the Patriots’ performance in the preceding seasons. He was not so much of a (Man)genius to have a good defense in 2005, and that may have given some hint that he was not the greatest bet to succeed as a head coach, either. [1]Always a bonus when painful Jets memories come up organically. There are always other coaching greats like Joe Walton for Jets fans to remember fondly, at least for epic nasal invasions.

This leads to an obvious question: on average, have teams done better when they have hired head coaches who were actually good in their previous jobs (either as coordinators or head coaches)? Let’s take this to the data. [continue reading…]

References

References
1 Always a bonus when painful Jets memories come up organically. There are always other coaching greats like Joe Walton for Jets fans to remember fondly, at least for epic nasal invasions.
{ 10 comments }

Unstable Divisions

The AFC East was a very stable division over the past two years. The Patriots won 12 games in 2012 and 12 more in 2013. The Bills, with six wins in 2013, also repeated their 2012 win total. Miami won 7 games in 2012, and then 8 last year. And the Jets followed up a 6-10 season in 2012 with an 8-8 season last year. That’s about as stable as a division can get. The four teams saw their win totals move by an aggregate of just three wins, making the 2012-2013 AFC East the most stable division since realignment.

On the other end of the spectrum: the NFC South. The Falcons dropped from 13 wins in 2012 to just four last year. The Panthers jumped from 7 wins in 2012 to 12 last year, and it didn’t even take Bill Parcells to do it. New Orleans also won seven games in 2012, but jumped to 12 wins in 2013. The team that saw the least movement in the NFC South last year was Tampa Bay, but the Bucs still fell from 7 wins to 4 wins, matching the total movement by all AFC East teams. As a group, NFC South teams had a change of 21 wins from 2012 to 2013, the most of any division since realignment.

That’s hardly new for the NFC South, or for that matter, the AFC East. Since realignment, the NFC South has easily been the league’s most unstable division: the Falcons, Saints, Bucs, and Panthers have seen their win totals fluctuate by an average total of 18.8 wins per year, beginning with the 2002-2003 seasons. The AFC East has been incredibly stable: no team has ever finished with more wins than New England, while the Bills have finished last or tied for last eight times since realignment. As a result, the average movement among AFC East teams — in the aggregate — has been just 6.3 wins.

RkDivisionChange in Wins/YrChange # Wins/Tm Yr
1NFC South15.73.9
2NFC North13.33.3
3AFC West11.93.3
4AFC North11.93.0
5AFC South11.72.9
6NFC East11.32.8
7NFC West10.82.7
8AFC East10.82.7

[continue reading…]

{ 1 comment }

Great Offenses and Missing the Playoffs

A common sight on any fall Sunday in the early '00s.

A common sight on any fall Sunday in the early '00s.

From 2002 to 2005, Peyton Manning was the best quarterback in the NFL, at least statistically, by a wide margin. But the #2 quarterback in Adjusted Net Yards per Attempt was Trent Green, and there was a wide gap between Green and all other quarterbacks not named Manning.  Over that same period, Tony Gonzalez led all tight ends in receptions, receiving yards, and touchdowns. And the Chiefs rushed for 34 more touchdowns than any other team, in addition to ranking third in rushing yards and fourth in yards per carry.

Kansas City ranked 4th in Adjusted Net Yards per Attempt in 2002, 1st in 2003, 3rd in 2004, and 2nd in 2005.  In terms of Adjusted Yards per Carry, the Chiefs were 2nd in 2002, 3rd in 2003, 1st in 2004, and 3rd in 2005. That’s an incredible streak of not just dominance, but balanced dominance. And Kansas City missed the playoffs in three of those four years! (pours one out for Jason Lisk).

On Monday, we looked at some great defenses that missed the playoffs. Today, a look at some of the best offenses to stay home for the winter. And in the last 15 years, the 2002 Chiefs, 2004 Chiefs, and 2005 Chiefs are the only teams to rank in the top five in both ANY/A and AYPC and miss the playoffs.

What other teams since the merger met those criteria? [continue reading…]

{ 6 comments }

Just above these words, it says “posted by Chase.” And it was literally posted by Chase, but the words below the line belong to Bryan Frye, a longtime reader and commenter who has agreed to write this guest post for us. And I thank him for it. Bryan lives in Yorktown, Virginia, and operates his own great site at http://www.thegridfe.com/, where he focuses on NFL stats and history.


In February, Chase used a regressed version of Football Outsiders’ DVOA metric to derive 2014 expected wins. If you are reading this site, you probably have some familiarity with Football Outsiders and DVOA, FO’s main efficiency statistic. Given the granularity of DVOA, it is no surprise that Year N DVOA correlates more strongly with Year N + 1 wins (correlation coefficient of .39) than Year N wins does (correlation coefficient of .32).

By now, even casual NFL fans probably have at least heard of Pythagorean wins, and regular readers of this site are certainly familiar with the concept. Typically, an analyst uses Pythagorean records to see which teams overachieved and underachieved, which can help us predict next year’s sleepers and paper tigers. Well, I wondered what would happen if we combined the two formulae to make a “DVOA-adjusted Pythagorean Expectation” (or something cooler sounding; you be the judge).

Going back to 1989, the earliest year for DVOA, I used the offensive, defensive, and special teams components of DVOA to adjust the normal input for Pythagorean wins (points). Because DVOA is measured as a percentage, I adjusted the league average points per team game accordingly (I split special teams DVOA between offense and defense). Let’s use Seattle, which led the league in DVOA in 2013, as an example.

In 2013, the league average points per game was 23.4. Last year, Seattle had an offensive DVOA of 9.4% and a defensive DVOA of -25.9% (in Football Outsiders’ world, a negative DVOA is better for defenses).  The Seahawks also had a special teams DVOA of 4.7%.  So to calculate Seattle’s DVOA-adjusted points per game average, we would use the following formula:

23.4 + [23.4 * (9.4% + 4.7%/2)] = 26.15 DVOA-adjusted PPG scored

And to calculate the team’s DVOA-adjusted PPG allowed average, we would perform the following calculation: [continue reading…]

{ 13 comments }

Over at Five Thirty Eight, I look at whether the Broncos pass offense, or the Seahawks pass defense, is more immune from regression to the mean.

 As a general rule, elite offenses are further from league average than great defenses, so offensive regression isn’t as likely as defensive regression. It helps, too, that research has shown offenses to be more consistent from year to year than defenses. All else being equal, we would expect the Broncos to be the more likely team to repeat last year’s brilliant performance.But all else isn’t equal. Denver produced 2013’s record-breaking numbers while playing defenses from the AFC South and the NFC East; those will be replaced this year by the AFC East and the NFC West, divisions that present much more formidable challenges. That’s a significant change.

According to Football Outsiders, Denver played the third-easiest slate of opposing defenses in 2013. Based purely on adjusted net yards per attempt, the average defense Manning faced last year was 0.44 ANY/A below average, and that’s after adjusting those defenses’ ratings for the fact that they played Manning. Only Alex Smith and Robert Griffin III faced more cupcakes. Last year, Manning didn’t Omaha against a single defense that ranked in the top eight in strength-of-schedule ANY/A; this year, he’s set to face six opponents that ranked in the top eight in that metric in 2013.

You can read the full article here.

{ 20 comments }

Not Tim Couch

Not Tim Couch.

The preseason is meaningless, right? Well, as it turns out, it might give us a window into quarterback development, despite what you might think. The threshold for whether the preseason is useful is whether including that information tells us anything about a quarterback’s potential that we don’t already know from his draft position (or perhaps certain analytics). I have been putting together data from preseason box scores going back to 1997. The data show that, for some quarterbacks, the preseason is not quite meaningless.

Neil Paine showed some interesting evidence relating to this idea on Friday. Looking at team performance since 2009 for teams with new quarterbacks, Neil showed that preseason passing efficiency helps predict regular season passing efficiency. It’s important to note that part of this result may have been pretty predictable even before we watched those preseason games. The 2012 Redskins replaced Rex Grossman and John Beck with the #2 pick in the draft who would have been #1 in an average year. So we would expect a big improvement to come just by way of moving from Grossman to a healthy RGIII. [continue reading…]

{ 12 comments }

In the Super Bowl era, there has been just one team that was both the youngest in the league and one of the five best teams in football: the 2012 Seattle Seahawks. As friend of Football Perspective Neil Paine recently pointed out, being young and great has historically been a good predictor of teams that have become dynasties. Consider the table below. It captures every team since 1966 that ranked amongst the five youngest teams by Approximate Value (AV)-weighted age and had at least 12 Pythagenpat wins, adjusting everything to a 16-game schedule. [1]My AV-weighted age calculations are very similar to Chase’s, but not always exactly the same. For example, I have Seattle third in 2013, while he has them second. We both had Seattle at 26 years, … Continue reading

TeamYearPyth WinsAV-wtd ageAge Rank
PIT197213.525.65
DAL199212.626.42
DAL199312.426.74
STL199914.226.65
CHI200112.426.55
SDG200612.626.55
IND200712.826.74
SEA201212.625.81
SEA201313.1263

There are seven unique teams on this list, not counting the two repeaters. When trying to predict what’s going to happen with the Seahawks, there are two different ways to look at this list. The first looks good for their dynasty potential. The first two teams on the list, the ’72 Steelers and the ’92 Cowboys went on to win multiple Super Bowls. The closest comparison in terms of age also looks pretty good. Teams used to be younger, so the best comparison probably isn’t the ’72 Steelers, who were even younger by age but were only the fifth-youngest team in 1972, but the ’92-’93 Cowboys. They are the only other team on this list to be so young and so good.

Of course, even the Cowboys had a pretty short run. Their stay at the top was nothing like the ’70s Steelers or ’80s Niners, who were also quite young. [2]They were the third-youngest team in 1981, their first championship year. Free agency helped to minimize their time on top. The ’90s Cowboys were the first great team in the free agency era. Players gained full freedom of movement only in the year after their first Super Bowl. Plan B free agency allowed limited movement starting in 1989.

Free agency and the salary cap help to explain the path of the other four teams on the list. They point towards a more cautious prediction about the Seahawks’ dynasty hopes. Between them, the ’99 Rams, ’01 Bears, ’06 Chargers, and ’07 Colts won one Super Bowl and played in two others. Within three years of their great-and-young season, only the Chargers were significantly better than league-average.

These more recent examples may do a better job of predicting the Seahawks future success. Before the beginning of full free agency in 1993, good-and-relatively-young teams appear to have generally followed a clear and sustained upwards trajectory over the long term. Since then, however, success has generally been less sustainable. The table below looks at teams’ strengths over time according to PFR’s Simple Rating System. [3]I thank Bryan Frye for sharing his SRS dataset. Here I’ve made the cutoff any team that was in the five youngest teams in a given year and also had a SRS rating of at least 6. The table shows the trend in strength for the previous season and the following three seasons.

TeamYearSRS (t-1)SRS (t)SRS (t+1)SRS (t+2)SRS Wins (t+3)AV-wtd ageAge Rank
PIT1972-3.6108.26.814.225.65
BAL1975-8.78.69.85-8.825.95
SFO1981-6.26.2-2.48.712.725.83
NOR1987010.11.54.6-1.3264
DAL19924.49.99.610.19.726.42
Average-2.828.965.347.045.325.943.8
TeamYearSRS (t-1)SRS (t)SRS (t+1)SRS (t+2)SRS (t+3)AV-wtd ageAge Rank
DAL19939.99.610.19.72.426.74
IND1999-5.46.17.9-3.81.225.61
STL1999-2.311.93.113.4-3.326.65
IND20006.17.9-3.81.2726.33
CHI2001-6.37.9-5.3-3.5-8.226.55
BAL2003-2.16.36.1-1.89.326.43
IND20031.2711.410.85.926.54
SDG2004-6.89.19.910.28.826.52
BAL20046.36.1-1.89.3-6.726.73
SDG20059.19.910.28.8526.85
JAX20064.87.56.8-2.5-6.526.52
SDG20069.910.28.856.626.55
SDG200710.28.856.64.826.42
IND20075.9126.55.92.926.74
SEA20120.812.21325.81
SEA201312.213263
Average3.349.095.864.952.0926.413.25

One surprising pattern in these data is just how infrequently young teams won in the past. From 1966-1992, only five teams were among the five youngest and still had an SRS of at least 6. Since 1993, it’s happened 16 times. In the past, teams had more of an opportunity to gradually build strength. So it looks like there was a greater share of young teams building for something and old teams trying to stay on top. Since 1993, the standard deviation of team ages is about 20% smaller than it was before that. In the last ten years, the standard deviation is about 30% smaller than it was before 1993. The ages of rosters are more compressed than they used to be.

The other thing to take away from these tables is the dropoff in years 2 and 3 since full free agency. For the pre-1993 teams, the good-and-young teams held much of their value. After starting at an average SRS of 8.96, they were still at 7.04 two years later and then 5.3 three years later. Since 1993, teams have deteriorated more quickly. From an average of 9.09, the more recent high quality young teams fell to 4.95 two years later and all the way to 2.09 three years later.

Since there are only five teams in the pre-1993 group, we want to be careful with interpreting too much into the earlier data. It’s possible that the ’72 Steelers and ’81 Niners are anomalies. At the same time, the success three years later is skewed downwards by the ’75 Colts, who would have been much stronger in ’78 if they had a healthy Bert Jones.

With the bigger set of more recent teams, the clear takeaway is that in the current era, even very good and young teams are just slightly better than average than three years later. The Seahawks may buck this trend, but they probably won’t. With Russell Wilson to sign and long-term cap hits for players like Richard Sherman and Earl Thomas, they’re more likely to have a brief run than a long one.

Another alternative may be available, though. If Wilson makes the leap into the Brady-Manning class (he may) and Pete Carroll turns out to be a truly elite coach (also possible), they may be able to fashion a New England-kind of dynasty. That sort of dynasty is not really built on youth. Consider the aging patterns of the last five teams of the decade.

healy age

The ‘60s Packers, ‘70s Steelers, ’80s Niners, ‘90s Cowboys all showed the same pattern of being relatively young and then progressively aging during their runs. On the other hand, the Patriots show an entirely different pattern. They’re the only dynasty to actually not age as their run progressed. They started old and stayed old through their Super Bowl years. While the Seahawks are starting off younger than those Patriots teams, excellence at QB and coach still offers them their best hope of building a dynasty in the current NFL. The benefits of being young and good are much more fleeting than they used to be.

References

References
1 My AV-weighted age calculations are very similar to Chase’s, but not always exactly the same. For example, I have Seattle third in 2013, while he has them second. We both had Seattle at 26 years, but I have Cleveland also at 26, instead of 26.1.
2 They were the third-youngest team in 1981, their first championship year.
3 I thank Bryan Frye for sharing his SRS dataset.
{ 12 comments }

James Lofton is the Yards Per Catch King

Yesterday, we looked at which quarterbacks were the best at yards per completion after adjusting for league average. Today, we’ll do the same thing for wide receivers and yards per completion.

Lofton tries to hide from the creamsicle uniforms.

Lofton tries to hide from the creamsicle uniforms.

A small tweak is necessary to the formula. You can skip down to the results section if you don’t care about the math, but I suppose most of my readers want to know what goes in the sausage. We can’t just use league-wide yards per completion rates, since that average includes receptions by non-wide receivers. One way around this is to calculate the league average YPC for wide receivers only; that’s easy to do for 2013, but less easy to do for the earlier years of NFL history when the distinction among the positions was not so clear. So, after playing around with a few different methods, I’ve decided to instead use 120% of the league average YPC rate, and give wide receivers credit for their yards over expectation using that inflated number.

For example, in 1983, James Lofton caught 58 passes for 1,300 yards for the Packers, a 22.4 YPC average. That year, the average reception went for 12.63 yards; 120% of that average is 15.2, which means we would give Lofton credit only for his yards over the product of 15.2 and 58, or 879. Since Lofton actually had 1,300 yards, he gets credit for 421 yards over expectation.

The next year, Lofton caught 62 passes for 1,361 yards (22.0). Since the average reception went for 12.66 yards, Lofton gets credit for his yards over (120% * 12.66 * 62), or 942. Lofton therefore is credited with 419 yards over expectation, nearly identical to his performance in the prior year. In fact, those were the 10th and 11th best season in NFL history by this method. [continue reading…]

{ 10 comments }

In 2013, the average completion went for 11.63 yards. That’s a pretty low number historically, although it’s actually a bit higher than some of the recent NFL seasons. Take a look at how Yards per Completion has generally been declining throughout NFL history:

ypc

If you want to discuss the quarterbacks who excelled in this metric, controlling for era is crucial. One simple way to measure the best passers when it comes to YPC is to measure how they fare in this metric relative to league average, and multiply that difference by the player’s number of attempts. For example, Nick Foles averaged 14.2 YPC last year, which was 2.6 YPC above average. Over the course of his 317 pass attempts, we could say he provided 529 yards above the average completion. That was the highest in the NFL last year, while Matt Ryan produced the lowest average. [continue reading…]

{ 18 comments }
The core of the Manning era Colts

Presumably the picture that caused the NFL to consider eliminating the Pro Bowl.

Last week, I looked at the top receivers and the quarterbacks who threw it to them. Today, we flip that question around and look at which receivers the top quarterbacks threw to. I used the exact same methodology from the previous post, so please read that for the fine details.

For Peyton Manning, 20% of his career passing yards came via Marvin Harrison, and another 16% came from Reggie Wayne.  Both of those numbers will decline the longer Manning plays, of course, but for now, those players dominate his list (Dallas Clark is third at seven percent). That’s a pretty stark departure from other quarterbacks such as say, I dunno, Tom Brady.  For the Patriots signal caller, Wes Welker is his top man (13%), followed by Deion Branch (9%), Troy Brown (7%), Rob Gronkowski (7%), and then Randy Moss (5%).

The table below lists the top 7 receivers for each of the 200 quarterbacks with the most passing yards since 1960. The list is sorted by the quarterback’s career passing yards, and I have removed the percentage sign from the table to enable proper sorting.  For example, here’s how to read Brett Favre’s line.  He’s the career leader in passing yards, and played from 1992 to 2010.  His top receiver was Donald Driver (9%), followed by Antonio Freeman (9%), Robert Brooks (6%), Sterling Sharpe (5%), Bill Schroeder (5%), Ahman Green (4%), and William Henderson. [continue reading…]

{ 12 comments }

A couple of weeks ago, I posted a list of the best rushing teams in 2013 using Adjusted Yards per Carry. That metric, you may recall, is calculated as follows:

Rushing Yards + 20*RushingTDs + 9*RushingFirstDowns

We can use the same formula to grade every team across history. To account for era and quantity (having more above-average rush attempts is better), I calculated each team’s AdjYPC average, subtracted the league-average AdjYPC average, and multiplied that difference by the team’s number of rush attempts.

The top team by this method isn’t even an NFL team: it’s the 1948 San Francisco 49ers. You may recall that the 49ers and Browns staged two epic battles that season, and may have been the best two teams in pro football. That season, San Francisco averaged 6.1 yards per carry and rushed for 35 touchdowns on 600 carries; along with 152 first downs, and the 49ers averaged 9.5 Adjusted yards per Carry. That’s the highest average ever, just narrowly topping the production of the franchise’s Million Dollar Backfield six years later. Joe Perry was on both teams because Joe Perry was the man.

The table below shows the traditional rushing data for the top 200 rushing teams of all time; the VALUE column represents the number of Adjusted Rushing Yards produced above average (i.e., relative to the league average AdjYPC). I’ve also listed the three most prominent rushers on each team. [continue reading…]

{ 8 comments }

Ellington races for a long touchdown

Ellington races for a long touchdown.

In November, I wrote about the unique running back by committee taking place in Arizona. At the time, Rashard Mendenhall was averaging 3.1 yards per carry, while backup Andre Ellington was averaging 7.2 yards per rush on 54 carries. I thought it would be fun to revisit the Ellington/Mendenhall time share now that the season is over, and to use a slightly different methodology.

Mendenhall ended the season with 687 yards on 217 yards, a 3.2 yards per carry average. Ellington finished his rookie year with 118 carries for 652 yards, producing 5.5 yards per rush. One way to measure the magnitude of the difference in the effectiveness of these two players — and boy was there a large difference — is to simply look at the delta in the players’ yards per carry averages. In this case, that’s 2.36 yards per carry.

Where does that rank historically? Some teams — I’m looking at the Lions in the early Barry Sanders years — gave only a handful of carries to their backup running backs. So one thing we can do is to take the difference in the yards per carry between the team’s top two running backs and multiply that number by the number of carries by the running back with the lower number of carries. In each instance, I’ve defined the running back with the most carries as the team’s RB1, and the running back with the second most carries as the RB2. In Arizona’s case, that would mean multiplying -2.36 (Mendenhall’s average, since he was the RB1, minus Ellington’s average) by 118, the number of carries Ellington recorded. That produces a value of -278. [continue reading…]

{ 28 comments }

One of my first posts at Football Perspective was one of my favorites: the top receivers and the men who threw it to them. I like referencing that post from time to time, so I decided to update the numbers through the 2013 season.

I looked at all regular season games since 1960 [1]Sorry, Don Hutson., and calculated the percentage of passing yards produced from each quarterback. Then, I assigned that percentage to the number of receiving yards for each receiver. For example, in this Raiders game from 1995, Vince Evans threw for 75% of the Raiders passing yards, and Jeff Hostetler was responsible for the other 25%. Therefore, since Tim Brown gained 161 yards, 121 of those yards are assigned to the “Brown-Evans” pairing and 40 to the “Brown-Hostetler” pairing. Do this for every game since 1960, and you can then assign the percentage of career receiving yards each receiver gained from each quarterback.

For example, 32% of Brown’s yards came from Rich Gannon, 26% from Hostetler, 12% from Jeff George, and 9% from Jay Schroeder. That breakdown isn’t too unique: in fact, of the six receivers with the most receiving yards since 1960, all six (including Brown) gained between 29% and 37% of their career receiving yards from their top quarterback.

The table below lists the top 7 quarterbacks for each receiver, although I only included quarterbacks who were responsible for at least five percentage of the receiver’s yards. It includes the 200 players with the most receiving yards since 1960. [continue reading…]

References

References
1 Sorry, Don Hutson.
{ 16 comments }

There is no doubt that in modern times, passing is king. But until pretty recently, we were at the peak level in NFL history with respect to individual rushing performance. On the team level, rushing production ebbed and flows, with high points in the late ’40s, mid-’50s, and mid-’70s, but on the individual level, the 2006 season may have been the high point.

That year, Pittsburgh’s Willie Parker rushed 337 times for 1,494 yards and scored 13 touchdowns, but Parker ranked just sixth in rushing yards. He also caught 31 passes for 222 yards, but Parker ranked only 7th in yards from scrimmage. That season, the average leading rusher on the 32 teams gained 1,124 rushing yards. Again, that was average. Last year, the average leading rusher gained 912 yards. Consider that in 1991, after Emmitt Smith, Barry Sanders, and Thurman Thomas, the fourth-leading rusher was New York’s Rodney Hampton, and he gained 1,059 yards. In other words, 2006 and its surrounding seasons — even if it might not feel like it — really was a different era of football for running back statistics.

The graph below shows the average rushing yards gained by the leading rushing for each team in every season since 1932. All team seasons of fewer than 16 games were pro-rated to 16 games [1]But this does not pro-rate for injury.; the NFL line is in blue, while the AFL/AAFC line is in red. [continue reading…]

References

References
1 But this does not pro-rate for injury.
{ 22 comments }

Yesterday, I looked at the best AV-weighted winning percentages of offensive players. Today, we examine the same numbers but for defensive players and kickers since 1960. Again, players who entered the league prior to 1960 are included, but for purposes of this study, only their 1960+ seasons count (assuming they produced at least 50 points of AV). That’s a pretty important bit of detail to mention when it comes to the top player on the list. The player with the best AV-adjusted winning percentage since 1960 is Packers linebacker Bill Forester, who entered the NFL in 1953 but only gets credit for his 1960-1963 seasons in Green Bay (spoiler: those were pretty good ones). After him, of course, we have yet another Patriots lineman. Today it’s Vince Wilfork: [continue reading…]

{ 3 comments }

A true winner and Tom Brady

A true winner and Tom Brady.

Yesterday, I looked at the weighted career winning percentages for running backs, with the weight being based on each player’s yards from scrimmage in each season of his career. Today, I want to do the same thing but for all offensive players, using PFR’s Approximate Value ratings.

By this methodology, Dan Koppen has the highest AV-weighted career winning percentage of any offensive player since 1960. The table below shows his AV and team’s winning percentage in each season of his career. Because Koppen’s best season came in 2007, when the Patriots went 16-0, Koppen’s career winning percentage gets a big boost from that season (18.7% of his career winning percentage comes from ’07 since 18.7% of his career AV comes from that year). On the other hand, Koppen played in just one total game for the 13-3 Patriots (2011) and the 13-3 Broncos (2013), so he gets almost no credit for those performances. Of course, he doesn’t need it, because his average season, after adjusting the weights based on his AV grades, was a 13-3 season.

YearTmGGSAVRecord% of Car AVWtWin%
2003NWE161570.8758%0.07
2004NWE1616100.87511.5%0.101
2005NWE9950.6255.7%0.036
2006NWE1616100.7511.5%0.086
2007NWE151516118.4%0.184
2008NWE1616100.68811.5%0.079
2009NWE1616100.62511.5%0.072
2010NWE1616110.87512.6%0.111
2011NWE1110.8131.1%0.009
2012DEN151270.8138%0.065
2013DEN000.8130%0
Total0100%0.813

The table below shows the top 500 career AV-adjusted winning percentages among all offensive player since 1960 (minimum: 50 points of AV). As always, players who entered the NFL before 1960 are included but only their seasons beginning in 1960 count. The table below is fully sortable and searchable, so get to searching and leave your thoughts in the comments. [continue reading…]

{ 3 comments }

Thoughts on the value of a rushing first down

Last week, Brian Burke provided some excellent data on the value of a first down. I began working on today’s post last offseason, but as you’ll see in a few minutes, I wasn’t quite comfortable with the results. But here’s what I did.

For all teams from 1989 to 2012, I recorded for each team’s average:

  • Yards per carry;
  • Touchdowns per carry;
  • First downs per carry;
  • Rush VOA from Football Outsiders (DVOA is FO’s main statistic, but it is adjusted for SOS; VOA is the unadjusted metric).

Then, I ran a series of regressions to help better understand the “proper” weights on the running game. [1]Longtime readers may recall that Neil did something similar with passing metrics. First, I used yards per carry and touchdowns per carry as my input, and VOA as my output. The best-fit formula was:

-0.647 + 0.128 * YPC + 4.615 * TD/Carry

Understanding that formula isn’t important. [2]Although if you’re curious… Suppose a team averaged 4.50 YPC and rushed for 12 TDs on 450 carries. That team would have a VOA of 5.21%, slightly above average. What we care about is the correlation coefficient (0.65) and the relationship between the YPC variable and the TD/carry variable.

Here we run into our first problem: 4.615 is 36 times as large as 0.128. This would imply that a touchdown is 36 times as valuable as a regular yard (or 35, if you subtract the yard gained on the score). That seems very high, as 20 is the generally accepted standard conversion rate for a touchdown.

What if we introduce first downs per carry into the equation? Then we get this best-fit formula:

-0.761 + 0.081 * YPC + 2.954 * TD/Carry + 1.593 * FD/Carry

Here, the R^2 is 0.72, which is an indication that first downs matter (or, to put it another way, DVOA gives rewards for first downs, as it should). Unfortunately, the TD variable remains very high (it’s now nearly 37 times as large as the YPC variable), but we get the bit of insight I was looking for: a first down is worth 0.54 touchdowns.

The first down variable is about 20 times as large as the YPC variable, but that seems way off to me.  Instead, if we think a TD is really worth 20 yards, this puts the value of a first down at about 10.8 yards. That’s not too far off from Brian’s 8.7 average, which I think makes sense to round to 9.0 once you remember that a few first downs happen on 4th downs, which was ignored in Brian’s analysis.

What helps bridge the gap between the two valuations?  Burke’s method looks at the marginal value of a first down based on an Expected Points model.  What I did with Football Outsiders’ numbers was to try to correlate first downs with rushing value.  But that could lead to overstating the value of a first down, if first downs are correlated with other things (like say, short-yardage success in general).  Teams that are good at rushing for first downs might be better at X, Y, and Z than other teams, and being good at X, Y, and Z could lead to a higher DVOA grade.  As a result, I like Brian’s result better, and I think FO’s numbers serve as a good gut check.  And while the number is a few yards higher, that’s arguably the correct result, and at least the number is higher in the right direction.

As for the idea that touchdowns are worth 36 yards and first downs are worth 19 yards? Well, I’m not so sure about that.  My hunch though, is that Football Outsiders (wisely) cares a lot more about say, success rate, than just generic yards per carry.  So perhaps this represents a devaluation of YPC as much as anything else.

But I’ll open it up to the crowd: what thoughts do you guys have for finding the value of a first down?

References

References
1 Longtime readers may recall that Neil did something similar with passing metrics.
2 Although if you’re curious… Suppose a team averaged 4.50 YPC and rushed for 12 TDs on 450 carries. That team would have a VOA of 5.21%, slightly above average.
{ 9 comments }

The Value of a First Down

What is the value of a first down? By that I mean, how many marginal yards is a first down actually worth? Here’s another way to word the question: If 3 first downs and 80 yards are worth X, then 2 first downs and [???] many yards are equal to X?

Calculating the marginal value of a yard isn’t easy. In fact, it’s been bugging me for years, because I’ve never quite been sure how to derive them. Then, a light bulb went off in my head: I needed to reach out to Brian Burke. I had an idea, but not the data or the means to execute.

Burke, of course, runs the fantastic website Advanced Football Analytics (formerly Advanced NFL Stats). I asked him if he would run some queries, and Brian was kind enough to do so. Fortunately, Brian’s not just a guy with access to lots of data, but one of the smartest minds in the industry. I wholeheartedly endorse his methods below, and I’m very thankful for his help. On top of running the numbers, he also provided an excellent writeup on his work. What follows are Brian’s words and analysis.


To estimate the value of achieving a 1st down without counting any of the value of the yardage gained, we can use the Expected Points model. The value of the 1st down itself minus yardage value will be the discontinuity in EPA when a play’s gain crosses the threshold for a 1st down. That discontinuity represents the value of the conversion apart from any yardage gained.

For example, on 2nd and 10, the EPA would increase smoothly for each yard gained up to 9 yards gained, then jump to a much higher EPA crossing the 10-yard mark where the conversion occurs. After that point, the EPA should increase smoothly again with each marginal yard gained above what was needed for the conversion.

Here is an illustration. The Y-axis represents Expected Points Added, the X-axis the amount of yards gained on the play.

EPA 2nd 10

The EPA for a 9-yd gain is 0.57, and the EPA for a 10-yd gain is 1.04. That’s a discontinuity of 0.47 EP, meaning that the 1st down itself is nearly equivalent to the 9-yards gained up to the point of conversion.

But we also need to correct for the yardage value of that 10th yard. One yard of field position is generally worth 0.064 EP. So in this case the discontinuity itself is worth 0.47 – 0.064 = 0.41 EP.

If we wanted to assign a “bonus” of yards to a player who is credited with achieving the conversion over and above the yardage itself, we could use this value’s yardage equivalent. 0.41 EP / 0.064 EP/yd = 6.4 yds. That’s the bonus for 2nd down and 10, but there are many other down and distance situations to consider.

For example, on 3rd and 10, the discontinuity is 1.57 EP, equivalent to nearly 25 yds. First and 10 is very strange because the discontinuity is negative. This makes sense, however, because an offense should prefer a 2nd & 1 to a 1st & 10 anywhere on the field. It would be silly to penalize a player for gaining the extra yard to convert, so my opinion would be to say the EP bonus for a conversion on 1st down is zero.

3rd 10

After examining a smattering of 2nd and 3rd down situations, the 2nd-down bonus EP is about 0.35 and 3rd-down bonus EP is roughly 1.4.

4th down conversions would obviously mean a very large bonus EP. They essentially have the value of a turnover–close to 4 EP or so. Since 4th downs are qualitatively different (and relatively rare) I’m going to set them aside.

In general, 32% of conversions come on 1st down, 38% come on 2nd down, and 30% come on 3rd down. So the weighted value of a conversion alone would roughly be:

[0.32 * 0] + [0.38 * 0.35] + [0.30 * 1.4] = 0.55 EP

The conversion bonus of 0.55 EP can be translated into yards by dividing by 0.064 EP/yd, which ultimately makes the equivalent yardage bonus for a conversion: 8.7 yards.


Figuring out the value of a first down will have many applications for Football Perspective going forward. Please leave your thoughts in the comments, as I’d love to hear what you guys have to say. And thanks again to Brian for his great work.

{ 21 comments }
The top passing game of 2013

The top passing game of 2013.

Yesterday, I analyzed the 2013 passing numbers for strength of schedule. Today, we look at the best and worst games of the year, from the perspectives of both the quarterbacks and the defenses.

Let’s start with the top 100 passing games from 2014. The top spot belongs to Philadelphia’s Nick Foles, for his monstrous performance against Oakland. Foles threw for 406 yards and 7 touchdowns on just 28 pass attempts. Even including his one one-yard sack, Foles averaged a whopping 18.79 ANY/A in that game. The league-average last season was 5.86 ANY/A, which means Foles was 12.93 ANY/A above average. Now since the game came against the Raiders, we have to reduce that by -1.29, which was how many ANY/A the Raiders defense was below average. So that puts Foles at +11.64; multiply that by his 29 dropbacks, and he produced 337 adjusted net yards of value above average after adjusting for strength of schedule. That narrowly edges out the other seven-touchdown game of 2013, which came at the hands of Peyton Manning against Baltimore on opening night.

The third spot goes to Drew Brees in a week 17 performance against Tampa Bay. The 4th best game of 2013 was a bit more memorable: Tony Romo takes that prize in a losing effort, the insane week five shootout against Manning and the Broncos (Peyton’s performance checks in at #32). The table below shows the top 100 games of 2013, although for viewing purposes, it displays only the top 10 by default (all tables, as usual, are fully searchable, expandable, and sortable). [continue reading…]

{ 16 comments }

Adjusting for strength of schedule is important

Adjusting for strength of schedule is important.

Every year at Footballguys.com, I publish an article called Rearview QB, which adjusts the fantasy football statistics for quarterbacks (and defenses) for strength of schedule. I’ve also done the same thing for years (including last season) using ANY/A instead of fantasy points, which helps us fully understand the best and worst real life performances each year. Today I deliver the results from 2013.

Let’s start with the basics. Adjusted Net Yards per Attempt is defined as (Passing Yards + 20 * Passing Touchdowns – 45 * Interceptions – Sack Yards Lost) divided by (Pass Attempts plus Sacks). ANY/A is my favorite explanatory passing statistic — it is very good at telling you the amount of value provided (or not provided) by a passer in a given game, season, or career.

Let’s start with some basic information. The league average ANY/A in 2013 was 5.86, a slight downgrade from 2012 (5.93). Nick Foles led the way with a 9.18 ANY/A average last year, the highest rate in the league among the 45 passers with at least 100 dropbacks. Since the Eagles quarterback had 317 pass attempts and 28 sacks in 2013, that means he was producing 3.32 ANY/A (i.e., his Relative ANY/A) over league average on 345 dropbacks. That means Foles is credited with 1,145 Adjusted Net Yards above average, a metric labeled “VALUE” in the table below. Of course, Peyton Manning led the league in that category last year, with a whopping 2,037 Adjusted Net Yards over Average.

RkNameTmCmpAttPydTDINTSkSkYdDBANY/AVALUE
1Peyton ManningDEN45065954775510181206778.872037
2Nick FolesPHI2033172891272281733459.181145
3Drew BreesNOR44665051623912372446877.511130
4Philip RiversSDG37854444783211301505747.791107
5Aaron RodgersGNB1932902536176211173118665
6Josh McCownCHI149224182913111372358.54629
7Russell WilsonSEA2574073357269442724517.1555
8Tony RomoDAL34253538283110352725706.54384
9Colin KaepernickSFO2434163197218392314556.65358
10Matthew StaffordDET37163446502919231686576.4355
11Andy DaltonCIN36358642933320291826156.29265
12Ben RoethlisbergerPIT37558442612814422826266.24238
13Tom BradyNWE38062843432511402566686.13175
14Michael VickPHI7714112155315991566.93166
15Jay CutlerCHI22435526211912191323746.23136
16Andrew LuckIND3435703822239322276026.06120
17Sam BradfordSTL159262168714415972776.166
18Alex SmithKAN3085083313237392105475.9441
19Matt McGloinOAK1182111547886532175.9622
20Jake LockerTEN111183125684161051995.68-36
21Matt CasselMIN153254180711916852705.69-46
22Brian HoyerCLE5796615536481025.22-66
23Cam NewtonCAR29247333792413433365165.69-88
24Thaddeus LewisBUF93157109243181001755.35-89
25Ryan FitzpatrickTEN21735024541412211093715.62-90
26Matt RyanATL43965145152617442986955.72-103
27Carson PalmerARI36257242742422412896135.67-119
28Matt FlynnGNB124200139285241352245.32-121
29Case KeenumHOU137253176096192012725.4-126
30Kellen ClemensSTL142242167387211382635.25-162
31Jason CampbellCLE1803172015118161043335.32-182
32Robert GriffinWAS27445632031612382744945.48-188
33Christian PonderMIN152239164879271192664.75-296
34EJ ManuelBUF1803061972119281593344.87-330
35Josh FreemanTAM63147761248611553.61-349
36Kirk CousinsWAS81155854475321603.67-351
37Brandon WeedenCLE141267173199271802944.51-398
38Mike GlennonTAM2474162608199403144564.98-405
39Matt SchaubHOU21935823101014211623794.53-504
40Terrelle PryorOAK1562721798711312033034.09-537
41Chad HenneJAX30550332411314382435414.86-544
42Ryan TannehillMIA35558839132417583996465-559
43Eli ManningNYG31755138181827392815904.53-788
44Geno SmithNYJ24744330461221433154864.17-824
45Joe FlaccoBAL36261439121922483246624.5-904

Manning paces in the field in Value over average, of course: that’s not surprising when the future Hall of Famer set the single-season record for passing yards and passing touchdowns. Foles, Drew Brees, and Philip Rivers formed the next tier of quarterbacks, far behind Manning but well ahead of the rest of the league.

And at the bottom of the list was the defending Super Bowl MVP, Joe Flacco. With a 4.50 ANY/A average, Flacco only edged out four other quarterbacks in that statistic, and none of the other passers came close to accumulating as many dropbacks as Flacco. After him comes the two New York quraterbacks, Geno Smith and Eli Manning.

But the point of today’s post is to adjust those numbers for strength of schedule. The solution is this post — a methodology I’ve labeled Rearview adjusted net yards per attempt, which adjusts those numbers for strength of schedule. The system is essentially the same as the one used in the Simple Rating System. Let’s look at Matt Ryan, who averaged 5.72 ANY/A last season, on 695 dropbacks. If we want to find Ryan’s SOS-adjusted rating, we need an equation that looks something like this: [continue reading…]

{ 19 comments }
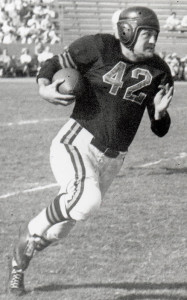
One of the two greatest quarterbacks of the first half of the 20th century

One of the two greatest quarterbacks of the first half of the 20th century.

The comments to Parts I and II of this series have been great, so let me start with a thank you. One of the more difficult parts of this process is comparing players across eras not just for efficiency, but for gross volume. In 2013, teams averaged 38.0 pass attempts (including sacks) per game, compared to just 24.5 in 1956. A great quarterback will be above average in either era, but it’s easier for great quarterbacks to accumulate above-average value when they play in a high-dropback era.

So what’s the solution? Simply pro-rating the numbers feels a bit too dramatic; we got into a similar issue with True Receiving Yards, and our solution there was to take a (literal) middle ground approach. I thought it would be fun to apply the same philosophy here. Over the course of the 96 league seasons in this study, the average number of league-wide dropbacks per game was 26.1. If we were going to do a 1:1 adjustment, we would then multiply each quarterback’s value in 2013 by 0.687, since that’s the result of 26.1 divided by 38. Instead, I decided to split the baby, and take the average of 0.687 and 1.000, which means modifying the VALUE metric for each quarterback in 2013 by 84.4%. On the other hand, a quarterback in 1956 now gets his VALUE multiplied by 103%, and a passer in 1937 sees his score multiplied by 129.0%.

The table below shows the revised single-season leader list. Here’s how to read it, which will explain why Dan Marino climbs back ahead of Tom Brady into the top spot on the list.  Under the old system, Marino had a value of 2,267 yards above average, but with the modifier, he gets downgraded to an adjusted value of 1981; of course, Brady’s modifier is more severe, which is why Marino vaults him.  Meanwhile, thanks to a 110.3% modifier, Sid Luckman’s 1943 season [1]Note that there is already a 25% deflation rate built into all seasons during World War II. Luckman’s numbers that year were insane. The Bears averaged 9.2 ANY/A, while the rest of the seven … Continue reading jumps ahead of Peyton Manning’s 2004 season, which has a modifier of 88.1%.  The table below shows the top 200 single seasons using this formula. [continue reading…]

References

References
1 Note that there is already a 25% deflation rate built into all seasons during World War II. Luckman’s numbers that year were insane. The Bears averaged 9.2 ANY/A, while the rest of the seven teams averaged just over two ANY/A. And even that understates things, as Luckman’s backup significantly deflated Chicago’s average.
{ 26 comments }

These two men look important

The two best regular season quarterbacks of all time?

Yesterday, I explained the methodology behind the formula involved in ranking every quarterback season since 1960. Today, I’m going to present the career results. Converting season value to career value isn’t as simple as it might seem. Generally, we don’t want a player who was very good for 12 years to rank ahead of a quarterback who was elite for ten. Additionally, we don’t want to give significant penalties to players who struggled as rookies or hung around too long; we’re mostly concerned with the peak value of the player.

What I’ve historically done — and done here — is to give each quarterback 100% of his value or score from his best season, 95% of his score in his second best season, 90% of his score in his third best season, and so on. This rewards quarterbacks who played really well for a long time and doesn’t kill players with really poor rookie years or seasons late in their career. It also helps to prevent the quarterbacks who were compilers from dominating the top of the list. For visibility reasons, the table below displays only the top 25 quarterbacks initially, but you can change that number in the filter or click on the right arrow to see the remaining quarterbacks. [1]Note that while yesterday’s list was just from 1960 to 2013, the career list reflects every season in history, using the same methodology as used in GQBOAT IV.

Here’s how to read the table. Manning’s first year was in 1998, and his last in 2013. He’s had 8,740 “dropbacks” in his career, which include pass attempts, sacks, and rushing touchdowns. His career value — using the 100/95/90 formula [2]And including negative seasons. is 12,769, putting him at number one. His strength of schedule has been perfectly average over his career; as a reminder, the SOS column is shown just for reference, as SOS is already incorporated into these numbers (so while Tom Brady has had a schedule that’s 0.25 ANY/A tougher than average, that’s already incorporated into his 10,063 grade). Manning is not yet eligible for the Hall of Fame, of course, but I’ve listed the HOF status of each quarterback in the table. Note that I only have quarterback records going back to 1960; therefore, for quarterbacks who played before and during (or after) 1960, only their post-1960 record is displayed. In addition, SOS adjustments are only for the years beginning in 1960. [continue reading…]

References

References
1 Note that while yesterday’s list was just from 1960 to 2013, the career list reflects every season in history, using the same methodology as used in GQBOAT IV.
2 And including negative seasons.
{ 109 comments }
Can you spot the GOAT?

Can you spot the GOAT?

In 2006, I took a stab at ranking every quarterback in NFL history. Two years later, I acquired more data and made enough improvements to merit publishing an updated and more accurate list of the best quarterbacks the league has ever seen. In 2009, I tweaked the formula again, and published a set of career rankings, along with a set of strength of schedule, era and weather adjustments, and finally career rankings which include those adjustments and playoff performances.  And two years ago, I revised the formula and produced a new set of career rankings.

This time around, I’m not going to tweak the formula much (that’s for GQBOAT VI), but I do have one big change that I suspect will be well-received.  Let’s review the methodology.

Methodology

We start with plain old yards per attempt. I then incorporate sack data by removing sack yards from the numerator and adding sacks to the denominator. [1]I have individual game sack data for every quarterback back to 2008. For seasons between 1969 and 2007, I have season sack data and team game sack data, so I was able to derive best-fit estimates for … Continue reading To include touchdowns and interceptions, I gave a quarterback 20 yards for each passing touchdown and subtracted 45 yards for each interception. This calculation — (Pass Yards + 20 * PTD – 45 * INT – Sack Yards Lost) / (Sacks + Pass Attempts) forms the basis for Adjusted Net Yards per Attempt, one of the key metrics I use to evaluate quarterbacks. For purposes of this study, I did some further tweaking. I’m including rushing touchdowns, because our goal is to measure quarterbacks as players. There’s no reason to separate rushing and passing touchdowns from a value standpoint, so all passing and rushing touchdowns are worth 20 yards and are calculated in the numerator of Adjusted Net Yards per Attempt. To be consistent, I also include rushing touchdowns in the denominator of the equation. This won’t change anything for most quarterbacks, but feels right to me. A touchdown is a touchdown.

Now, here comes the twist.  In past year, I’ve compared each quarterback’s “ANY/A” — I put that term in quotes because what we’re really using is ANY/A with a rushing touchdowns modifier — and then calculated a value over average statistic after comparing that rate to the league average. For example, if a QB has an “ANY/A” of 7.0 and the NFL average “ANY/A” is 5.0, and the quarterback has 500 “dropbacks” — i.e., pass attempts plus sacks plus rushing touchdowns — then the quarterback gets credit for 1,000 yards above average. [continue reading…]

References

References
1 I have individual game sack data for every quarterback back to 2008. For seasons between 1969 and 2007, I have season sack data and team game sack data, so I was able to derive best-fit estimates for each quarterback in each game. For seasons between 1960 and 1969, I gave each quarterback an approximate number of sacks, giving him the pro-rated portion of sacks allowed by the percentage of pass attempts he threw for the team.
{ 41 comments }

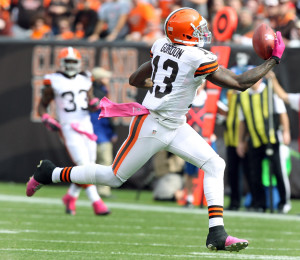
Gordon smoked the defensive back on this play

Gordon smoked the defensive back on this play.

Josh Gordon led the league with 1,646 receiving yards last year. That’s impressive: perhaps even more impressive is that he did it on “only” 159 targets, meaning he averaged 10.35 yards per target. [1]That’s the most of any receiver with over 130 targets. It’s the second most among players with 100 targets, behind DeSean Jackson‘s 10.6 average on 126 targets. It’s the … Continue reading But the most impressive part, of course, was that he did it for the Browns. You know, the Browns, quarterbacked by a three-headed monster of Jason Campbell, Brandon Weeden, and Brian Hoyer, each of whom managed to average a around the same mediocre 6.4 yards per attempt.

Here’s another way to think of it. While Jordan Cameron was somewhat efficient (7.7 yards per target), the other three Browns to finish in the top five in Cleveland targets were Greg Little (4.7 yards per target), Chris Ogbonnaya (4.6), and Davone Bess (4.2!). And here’s yet another way to think of it: the Browns threw 681 passes last year and gained 4,372 passing yards. But 1,646 of those yards came on the 159 passes intended for Gordon. Remove those plays, and Cleveland averaged just 5.22 yards per pass attempt on passes to all other Browns last year.

That means Cleveland averaged 5.13 more yards per target on passes to Gordon in 2013 than on passes to everyone else. That’s insane, particularly over 159 targets. How insane? If we multiply those two numbers, we get a “value relative to teammates” metric: Gordon gained 816 more yards on his targets than the other Browns averaged per target. Now, in the abstract, maybe 816 doesn’t mean much to you. But it’s the most of any player since at least 1999. The table below shows the top 75 wide receivers in value relative to teammates: the columns should be self-explanatory, and the “ROT Y/A” shows the yards per attempt on passes to the rest of the team. As always, it’s fully sortable and searchable; by default, it displays only the top 25 receivers, but you can switch that by clicking on the dropdown box to the left. [continue reading…]

References

References
1 That’s the most of any receiver with over 130 targets. It’s the second most among players with 100 targets, behind DeSean Jackson‘s 10.6 average on 126 targets. It’s the third most among players with more than 60 targets, behind Jackson and Doug Baldwin (10.7, 73). And it’s the fourth most among players with at least 40 targets, behind Jackson, Baldwin, and Kenny Stills (12.8, 50).
{ 5 comments }

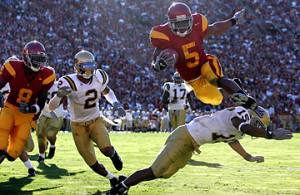
Bush played with some talented teammates at USC.

Bush played with some talented teammates at USC.

Last week, I wrote about whether having great college teammates might cause quarterbacks and wide receivers to be overvalued in the NFL draft. The results were inconclusive on the impact of teammates on quarterbacks, but they indicated that wide receivers who played with first-round QBs in college tended to underperform in the NFL relative to their draft position. Receivers such as Mike Williams of USC (#10 in 2005) and Marcus Nash of Tennessee (#30 in 1998) may have gone too high in the draft in part because they played with great college QBs who made them look good.

Today, I look at running backs drafted since 1984. I use a slightly different way of looking at the data that I think is a little better. I also revisit the QBs and WR/TEs with that method. Instead of considering the number of first-round college teammates that a player has, I consider the total draft value of college teammates at different positions, as determined by Chase’s chart. [1]I thank commenter Stuart for suggesting this approach in the comments to last week’s post. Going this way makes it possible to look at the entire offensive line’s value, for example, rather than just the number of players who were high picks.

For example, according to PFR’s Approximate Value (AV), Ki-Jana Carter is the biggest underachiever at RB relative to his draft position (since 1984). After being drafted #1 in 1995, he generated just nine points of AV in his first five years. [2]Carter averaged 3.3 yards on 227 carries over his first five injury-plagued seasons. Carter also had a lot of help from his friends in college. He ranks 10th out of 104 RBs picked in the top 32 in terms of the total value of his college offensive linemen according to my measure. His tight end also went in the top ten in 2005; Carter would be 2nd in total line value if we included TEs. Two of his offensive lineman went in the first round in the following year. Two Penn State fullbacks were drafted that year, too. [3]Two Penn State halfbacks were drafted in 1996, as well. One of them was Stephen Michael Pitts, who went to Middletown High School South (NJ), a school that also graduated Knowshon Moreno and, only … Continue reading Could Carter have looked better than he was because he ran behind those great college blockers? Or is the NFL success of the running back who ranks fourth in terms of offensive line help (Warrick Dunn) more representative of RBs, in general?

In addition to looking at the offensive line, I’ll consider whether the total value of college teammates at other offensive positions predicts that running backs become overvalued in the draft. While we might think that RBs are particularly dependent on line help, it actually appears that having a great QB is again the one clear predictor for players being overvalued. [continue reading…]

References

References
1 I thank commenter Stuart for suggesting this approach in the comments to last week’s post.
2 Carter averaged 3.3 yards on 227 carries over his first five injury-plagued seasons.
3 Two Penn State halfbacks were drafted in 1996, as well. One of them was Stephen Michael Pitts, who went to Middletown High School South (NJ), a school that also graduated Knowshon Moreno and, only slightly less famously, me.
{ 3 comments }

Bradford had a lot of surrounding talent in Norman.

Bradford had a lot of surrounding talent in Norman.

Do players get too much credit when teammates make them look good? Take Johnny Manziel. In the last thirty years, no quarterback has had teammates around him drafted so highly. Last year, his left tackle (Luke Joeckel) was the second pick in the draft. This year, his new left tackle (Jake Matthews) was the sixth pick in the draft and his talented wide receiver went immediately after. That’s three top seven picks from his offense in two drafts. Does this means, perhaps, that Manziel was riding those players’ coattails? Or is it Manziel who helped make his teammates look better?

The first round quarterback with the closest comparable surrounding college talent — a left-handed former Florida QB drafted in 2010 — doesn’t appear to be a very promising comparison. Tim Tebow’s top wide receiver was drafted 22nd overall (Percy Harvin) in 2009, and successive linemen Pouncey brothers were drafted in the top 20 the next two years (Maurkice went #18 in 2010 and Mike #15 in 2011). [1]And he had a talented tight end go in the fourth round in 2010, too. Like Tebow, he is also no longer playing football. Let’s move on. Tebow is obviously very different from Manziel, most notably in lacking the important skill for a quarterback of being able to throw a football well. But Tebow may have looked better as a college player in part because of the great talent around him, a situation which may be similar to Manziel.

In general, does having better college teammates cause QBs like Manziel to be overvalued in the draft? Or, do better QBs cause their college teammates to be overdrafted? To check these ideas out, I compared how draft picks performed in their first five years (according to PFR’s Approximate Value) relative to their expected value given their draft position. [2]I did this by running a regression of a player’s value in the first five years on a fifth-order polynomial in draft position. This is pretty much the same thing as looking at the value a player … Continue reading I then compared performance relative to expectation for players who had the benefit of teammates who were drafted in the first round to those who weren’t so lucky. The results are certainly not what I expected: by the end of this post, it might be Bucs fans who worry the most that they overvalued a high pick in the 2014 draft.

Quarterbacks

I first considered the value above expectation (VAE) for quarterbacks drafted in the first three rounds since 1984. It looks like having a lineman drafted in the first round either in the same or subsequent draft has no clear impact on the QB’s VAE. Those QBs who played with first-round linemen do about 1.8 points worse in VAE than QBs (relative to a baseline of 22.2), but this difference isn’t close to being distinguishable from zero. [3]The p-value is 0.70

Here’s the list of QBs from the first three rounds who had at least one lineman drafted in the first round of the same or subsequent draft. [4]All analysis in this post ignores the supplemental draft. The VAE for the last few entries is missing because those players have not finished their first five seasons. Keep in mind that the VAEs cannot be too low for third-round picks like Bobby Hoying, since little was expected of them given their draft position.

QuarterbackYearVAESchoolOL
Boomer Esiason198441.3MarylandRon Solt
Chuck Long1986-18.7IowaMike Haight
Todd Marinovich1991-21.2USCPat Harlow
Matt Blundin1992-19.2VirginiaRay Roberts
Billy Joe Hobert1993-8.4WashingtonLincoln Kennedy
Rick Mirer1993-5.8Notre DameAaron Taylor
Kerry Collins1995-6.8Penn St.Jeff Hartings; Andre Johnson
Todd Collins1995-10MichiganTrezelle Jenkins
Bobby Hoying1996-9.6Ohio St.Orlando Pace
Charlie Batch199814.9East. MichiganL.J. Shelton
Eli Manning20049.5MississippiChris Spencer
Brian Brohm2008-15.7LouisvilleEric Wood
Chad Henne20086.4MichiganJake Long
Matt Ryan200837.9Boston Col.Gosder Cherilus
Sam Bradford20100OklahomaTrent Williams
Tim Tebow20100FloridaMaurkice Pouncey; Mike Pouncey
Andrew Luck20120StanfordDavid DeCastro
Ryan Tannehill20120Texas A&MLuke Joeckel
Russell Wilson20120WisconsinKevin Zeitler; Travis Frederick

There are definitely some classic failures on this list, notably Todd Marinovich, but there are some big successes, too. And, for the more recent QBs, Andrew Luck and Russell Wilson will more than balance out Tebow. Overall, there’s little reason to think getting to play with a first-round lineman causes QBs to be overdrafted in general. As a result, Manziel critics may not have much support if they want to point to Matthews and Joeckel as the reason for Manziel’s college success.

But what about the presence of Mike Evans? Does having an elite wide receiver or tight end mean that a QB might be overvalued in the draft? I ran a separate regression looking at whether having a first-round WR/TE predicts a QB to succeed or flop relative to his expectation. Here, there’s more reason to think there might be something going on, but there is still not clear evidence that teammates make the QB. Part of this is just the relatively small number of QBs with first-round WR/TEs in the sample. On average, QBs with first-round WR/TE teammates in college do 6.5 points worse relative to expectation than other QBs. That gap is still indistinguishable from zero, however. [5]p = .20

Below are the QBs since 1984 who had at least one WR/TE teammate in the same or following year drafted in the first round.

QuarterbackYearVAESchoolWR/TE
Vinny Testaverde1987-4.5Miami (FL)Michael Irvin
Tony Sacca1992-17.7Penn St.O.J. McDuffie
Rick Mirer1993-5.8Notre DameIrv Smith
Kerry Collins1995-6.8Penn St.Kyle Brady
Kordell Stewart199519.9ColoradoMichael Westbrook
Bobby Hoying1996-9.6Ohio St.Terry Glenn; Rickey Dudley
Peyton Manning199840.5TennesseeMarcus Nash
Marques Tuiasosopo2001-14.2WashingtonJerramy Stevens
Chris Simms2003-2.3TexasRoy Williams
Matt Schaub200410.9VirginiaHeath Miller
JaMarcus Russell2007-30.5LSUDwayne Bowe; Craig Davis
Sam Bradford20100OklahomaJermaine Gresham
Brandon Weeden20120Oklahoma St.Justin Blackmon
Robert Griffin20120BaylorKendall Wright
Geno Smith20130West VirginiaTavon Austin

The repeats from the earlier list who were blessed with great help both on the line and at WR/TE were Rick Mirer, Kerry Collins and Sam Bradford. [6]All of those first-rounders were actually TEs (Irv Smith, Kyle Brady and Jermaine Gresham, respectively), although Collins also threw to a second-round WR in Bobby Engram. As you can see, Peyton Manning swings this upwards, but JaMarcus Russell swings it down just as much. Both of those would seem to be anecdotes that fit the story of teammates potentially inflating another player’s perceived value, with the QB inflating the WR (the instantly forgotten Marcus Nash) in Manning’s case and the WR (Dwayne Bowe) perhaps inflating the QB in Russell’s case.

Overall, though, it’s unclear whether WRs in general tend to inflate their QBs, making them overvalued in the draft. The effect size is substantial and just three of the 11 QBs have positive VAE, but it could be driven by random chance given the small sample size. [7]Kordell Stewart is one of those three and he did play a little WR in his first few years, too, but almost all of his value was at QB Given what I find below for predicting WR success, I suspect that the Manning-Nash example may happen more often than the Russell-Bowe situation.

Wide Receivers

Do great college quarterbacks cause NFL talent evaluators to reach for their wide receiver and tight end teammates? It seems like the answer to this question might be yes. Receivers selected in rounds 1-3 who come from schools with first-round QBs drafted the same or following year do 6.4 points worse relative to expectation from their draft position. Here, we have more data and the results are statistically significant that having a first-round college QB has led to their wide receivers being overvalued in the draft. [8]The p-value for this effect is .01 WRs drafted in the first three rounds without a top QB generated an average value in their first five years of 17.6, so the predicted drop in value is down to about 11.2. Having a first round QB thus predicts a WR gets taken a little more than a round too early. [9]For wide receivers, I estimate 17.6 as being the expected value generated by about the 46th pick, with 11.2 the expected value generated by the 89th pick

In fact, from 1984 to 2009, only 20% of the round 1-3 WR/TEs who played with first-round QBs had a positive VAE.

WR/TEYearVAESchoolQB
Jonathan Hayes1985-11.9IowaChuck Long
Flipper Anderson198817.3UCLATroy Aikman
Mike Bellamy1990-16.9IllinoisJeff George
Derek Brown1992-26.7Notre DameRick Mirer
Irv Smith1993-14.9Notre DameRick Mirer
Cory Fleming1994-10.4TennesseeHeath Shuler
Malcolm Floyd1994-7.9Fresno St.Trent Dilfer
Tydus Winans1994-9.8Fresno St.Trent Dilfer
Kyle Brady1995-20.4Penn St.Kerry Collins
Bryan Still1996-10.9Virginia TechJim Druckenmiller
Joey Kent1997-15.7TennesseePeyton Manning
Marcus Nash1998-21.1TennesseePeyton Manning
Patrick Johnson1998-8.7OregonAkili Smith
Kevin Johnson199910.6SyracuseDonovan McNabb
Jabar Gaffney2002-1.1FloridaRex Grossman
Reche Caldwell20022.7FloridaRex Grossman
Taylor Jacobs2003-16.2FloridaRex Grossman
Mike Williams2005-25.8USCMatt Leinart
Anthony Fasano2006-2.3Notre DameBrady Quinn
David Thomas2006-2.5TexasVince Young
Dominique Byrd2006-10.7USCMatt Leinart
Maurice Stovall2006-6.1Notre DameBrady Quinn
Craig Davis2007-15.1LSUJaMarcus Russell
Dwayne Bowe200713.4LSUJaMarcus Russell
Fred Davis2008-2.3USCMark Sanchez
Jordy Nelson200812.8Kansas St.Josh Freeman
Juaquin Iglesias2009-10.1OklahomaSam Bradford
Mohamed Massaquoi2009-2.9GeorgiaMatthew Stafford
Patrick Turner2009-10.4USCMark Sanchez
Percy Harvin200917FloridaTim Tebow
Jermaine Gresham20100OklahomaSam Bradford
Coby Fleener20120StanfordAndrew Luck
Justin Blackmon20120Oklahoma St.Brandon Weeden
Kendall Wright20120BaylorRobert Griffin

And at least one of the successes on this list is an exception that fits the broader idea. Percy Harvin played with a QB who just maybe was a slight reach as a first round pick. It’s hard to think that Tim Tebow made Percy Harvin look good. [10]I’d argue the same for Dwayne Bowe and JaMarcus Russell, but Russell at least was a legitimately excellent passer in 2006 At least based on these results, having a great college QB has caused wide receivers to be drafted much too highly over the last thirty years.

Conclusion

So it seems like Bucs fans might have more to worry about than Browns fans. The evidence is unclear on whether QBs such as Manziel generally become overvalued from playing with first-round receiver talent, although there might be something going on there. But the evidence is much clearer that WRs such as Evans become overvalued from playing with premier college QBs. Perhaps it’s not surprising from what we know about the NFL that there’s a pretty good chance that Manziel’s excellence helped inflate Evans’s value.

Of course, the last example of a 6’5 receiver drafted in the top ten who played with a first-round Heisman-winning QB doesn’t bode well for Evans, either. [11]The similarities don’t stop there. Mike Williams is listed at 229 lbs and ran a 4.56 40 at the combine. Evans is at 231 and ran a 4.53. And they’re both named Mike. And while Evans will likely still be in the NFL after six years unlike Mike Williams, it is likely that he would have gone lower in the draft if he played with a quarterback not quite so good as Johnny Football.

References

References
1 And he had a talented tight end go in the fourth round in 2010, too. Like Tebow, he is also no longer playing football. Let’s move on.
2 I did this by running a regression of a player’s value in the first five years on a fifth-order polynomial in draft position. This is pretty much the same thing as looking at the value a player generates compared to their expected value according to Chase’s chart, except I also control for whether a player went to a major football school.
3 The p-value is 0.70
4 All analysis in this post ignores the supplemental draft.
5 p = .20
6 All of those first-rounders were actually TEs (Irv Smith, Kyle Brady and Jermaine Gresham, respectively), although Collins also threw to a second-round WR in Bobby Engram.
7 Kordell Stewart is one of those three and he did play a little WR in his first few years, too, but almost all of his value was at QB
8 The p-value for this effect is .01
9 For wide receivers, I estimate 17.6 as being the expected value generated by about the 46th pick, with 11.2 the expected value generated by the 89th pick
10 I’d argue the same for Dwayne Bowe and JaMarcus Russell, but Russell at least was a legitimately excellent passer in 2006
11 The similarities don’t stop there. Mike Williams is listed at 229 lbs and ran a 4.56 40 at the combine. Evans is at 231 and ran a 4.53. And they’re both named Mike.
{ 37 comments }

Green is poised for another monster year

Green is poised for another monster year.

Last year, at Footballguys.com, I looked at the best starting point for wide receiver projections. Well, I’ve re-run the numbers and come up with the best starting point for wide receiver projections in 2014.

The general philosophy is that receiving yards can be re-written using the following formula:

Receiving yards = (Receiving Yards/Target) x (Targets/Team_Pass_Att) x Team_Pass_Att.

Since each of those variables regress to the mean in different ways, we can get a more accurate projection of future receiving yards by projecting each of those three variables than by simply looking at past receiving yards. For example, here are the best fit formulas for each of those metrics:

Future Pass Attempts = 36 + (450 x Pass_Attempts/Play) + (0.255 x Offensive Plays)

Future Percentage of Targets = 6.2% + 71.3% x Past Percentage of Targets

Future Yards/Target = 5.5 + 0.29 x Past Yards/Targets

If you take a look at the three coefficients, the number of offensive plays run from year to year and the yards per target averages are not very sticky; both have coefficients of less than 0.3, which indicates a significant amount of regression to the mean. Meanwhile, percentage of targets is much, much sticker, at 71%. [1]Pass attempts per play can’t be analyzed the same way, at least using the formulas presented here, but it does look as though the pass-heaviness of an offense is moderately sticky, too. And … Continue reading

As a result, this regression really likes players like A.J. Green (5th in receiving yards in 2013, projected to be 1st in 2014), Andre Johnson (7th, 2nd) and Vincent Jackson (14th, 6th). To find out who else this metric likes and dislikes, and for a more thorough analysis, you can read the full article here.

References

References
1 Pass attempts per play can’t be analyzed the same way, at least using the formulas presented here, but it does look as though the pass-heaviness of an offense is moderately sticky, too. And that would be even more true if we accounted for game scripts, I suppose.
{ 0 comments }

The NFL Draft and the Wisdom of Crowds

[Chase note: Take a look at the name at the top of this post. Our good friend Andrew continues to desire to post here, and we thank him for that.]

Not the focus of Galton's experiment.

Not the focus of Galton's experiment.

In 1906, Sir Francis Galton probably wasn’t thinking about the NFL draft when he asked almost 800 fair goers to guess the weight of an ox. No one person accurately guessed its weight, and the guesses were all over the map, but the mean of all the guesses (1197 lbs) was within one pound of the actual weight of the ox. As I looked through endless mock drafts leading up to last Thursday night, I wondered if there was anything to be gained by looking at the wisdom of the crowds. Could we do a better job of predicting the NFL draft if we took all the knowledge and tried to put it together?

And the answer appears to be yes… to an extent. The NFL draft is not exactly a place where we’d expect the wisdom of crowds to be particularly strong. The power of the wisdom of crowds comes from lots of people bringing their own independent information to the table. For example, prediction markets appear to do a great job of predicting events like a president’s chances of being reelected. Sports prediction markets (a.k.a sportsbooks) similarly succeed in predicting game outcomes. And the stock market often reveals companies’ true values. In each case, every individual transaction represents a piece of information which gets reflected in the price.

Of course, the crowd is not always so wise. Stock markets can go haywire. Betting lines can be affected by people’s biases. The wisdom of crowds can break down when groupthink occurs and people stop having independent opinions. The NFL draft certainly looks like such a case. All the mock drafts are out there and the experts have the implicit pressure to not be too different. [1]In some cases, there may be incentives to stand out from the crowd with an original prediction, too. Overall, there are incentives that can make predictions depend on those made by others. In those circumstances, we could lose in a haze of groupthink much of the original information that people have. [continue reading…]

References

References
1 In some cases, there may be incentives to stand out from the crowd with an original prediction, too. Overall, there are incentives that can make predictions depend on those made by others.
{ 9 comments }

Interesting stat about LeBron James courtesy of Tim Reynolds: The Heat superstar has increased his field goal percentage in seven straight seasons. Take a look at his field goal percentage by season:

Season Age Tm FG%
2003-04 19 CLE .417
2004-05 ★ 20 CLE .472
2005-06 ★ 21 CLE .480
2006-07 ★ 22 CLE .476
2007-08 ★ 23 CLE .484
2008-09 ★ 24 CLE .489
2009-10 ★ 25 CLE .503
2010-11 ★ 26 MIA .510
2011-12 ★ 27 MIA .531
2012-13 ★ 28 MIA .565
2013-14 ★ 29 MIA .567

Now as you guys can probably figure out, I’m not terribly invested in the career of LeBron James or basketball stats. But one thing I know is that improving on any metric in seven straight years is really freakin’ rare.

How rare? Only one quarterback in NFL history has increased his passing yards output in six straight years. That quarterback actually increased his passing yards per game in eight straight seasons, but no other quarterback can come close to matching that feat, either. Can you guess who our mystery quarterback is?

Trivia hint 1 Show
Trivia hint 2 Show
Trivia hint 3 Show
Click 'Show' for the Answer Show

Here, take a look at his career stats:

Click 'Show' Show

So while 1) my interest in basketball is limited, and 2) as Neil would tell me, field goal percentage is meaningless, simply increasing your performance in any stat for seven straight years is remarkable. No running back has ever increased their rushing output in seven straight years, although Earl Ferrell (if you count his rookie year of zero rushing yards per game, 1982-1988) and Pete Johnson (1977-1983) both increased their rushing yards per game in six straight years.

No receiver has seen a seven-year increase in any stat, either.  However, three players have increased their number of receptions in six straight years: Jason Avant (2006-2012), Raymond Berry (1955-1961), and Reggie Wayne (2001-2007). However, none of them managed to pull off that feat in receiving yards.

But two other players did: Tim Brown (1989-1995) and Marcus Pollard (if you count his rookie year of zero receiving yards, 1995-2001) increased their receiving yards in six straight seasons. And Leonard Thompson (1977-1983), Brown, and Pollard were the only players to increase their receiving yards per game in six straight years.

So whatever you think of LeBron, just know that here’s one more reason a stats geek could find his career fascinating.

{ 6 comments }
Next Posts Previous Posts