≡ Menu

In January, I calculated the AV-adjusted age of every team in 2013. In February, I looked at the production-adjusted height for each team’s receivers. Today, we combine those two ideas, and see which teams had the youngest and oldest set of targets.

To calculate the average receiving age of each team, I calculated a weighted average of the age of each player on that team, weighted by their percentage of team receiving yards. For example, Anquan Boldin caught 36.7% of all San Francisco receiving yards, and he was 32.9 years old as of September 1, 2013. Therefore, his age counts for 36.7% of the 49ers’ average receiving age. Vernon Davis, who was 29.6 on 9/1/13, caught 26.5% of the team’s receiving yards last year, so his age matters more than all other 49ers but less than Boldin’s. The table below shows the average age for each team’s receivers (which includes tight ends and running backs) in 2013, along with the percentage of team receiving yards and age as of 9/1/13 for each team’s top four receiving leaders: [continue reading…]

{ 6 comments }

In case you haven’t heard, the St. Louis Rams are running a contest to predict the team’s 2014 schedule. lThe prize is $100,000, which sounds nice until you realize that to win, you must accurately predict not only the opponent each week, but the location and the exact day of the game. Nobody is going to win this contest. Nobody is going to come close to winning the contest. It’s a personal information/PR grab and nothing more.  Normally, this wouldn’t bother me, but it’s not like the Rams are giving away a billion dollars.  For a hundred grand — which is less than two percent of the amount of dead cap space being allocated to Cortland Finnegan this season — the team shouldn’t have needed to make it impossible for anybody to win. Considering the rules, St. Louis might as well have announced that the grand prize is eleventy billion dollars.

So what are the odds of winning this contest? Let’s start with an easier problem than the one at hand: predicting the Rams opponent in each week of the season.

With 17 weeks, there are 17 possible opponents once you include home/road designations and the bye week. Therefore, you have a 1-in-17 chance of correctly guessing the Rams opponent in week one. By extension, you have a 1-in-16 chance of correctly guessing who St. Louis plays in week two, assuming you were correct with your guess in week one (this is what we mean by conditional probabilities). Do this for every week of the season, and by week 17, you have a 100% chance of correctly guessing who is on the team’s schedule.

It may not be intuitive exactly how daunting a task this is. But this is much, much harder than Warren Buffet’s bracket contest.  For example, you only have a a 1-in-272 chance of correctly guessing who the Rams opponents will be in the first two weeks of the season. That drops to 1-in-4,080 through three weeks, 1-in-8.9 million through six weeks, and 1-in-8.8 billion through nine weeks. That already makes it harder than the bracket contest, and you still have the back eight to play. The odds of correctly guessing the opponent each week is 1-in-356 trillion. And remember, this is quite a bit easier than the actual contest!

But let’s make some adjustments based on the information we know (which will lower the odds) and the added conditions one must satisfy (which will drastically increase the odds).

Adjustment #1

The first adjustment to our 1-in-356 trillion likelihood lowers the odds. If we assume that each team plays a division opponent in week 17, that makes the contest ever so slightly easier. If we work in reverse order, you now have a 1-in-6 chance of guessing the week 17 opponent (remember, you need to specify game location), a 1-in-16 chance of guessing the week 16 opponent assuming your week 17 selection was correct, and so on. This improves your odds all the way to 1-in-126 trillion. Hooray? [continue reading…]

{ 14 comments }

Analyzing Position Values in the NFL

Every draft pick has a value, as seen in my draft value chart.  When the first overall pick is used on a quarterback, that means the quarterback position gets credited with 34.6 picks. If you assign a value to every pick in each of the last ten drafts, you can get a sense of the amount of value spent on each position in the NFL in an average draft. The graph below shows the percentage of the draft value pie attributed to each position; for example, quarterbacks are selected with 7% of all draft capital:

[visualizer id=”19019″] [continue reading…]

{ 7 comments }
Megatron at his best

Megatron at his best.

In his seven-year career, Calvin Johnson has already recorded 9,328 receiving yards. And for those curious about these sorts of things, he’s the career leader in receiving yards per game at 88.0, too. But Johnson has also benefited greatly from playing on teams that have thrown a weighted average of 635 pass attempts per season.

What is a weighted average of team pass attempts? I’m defining it as an average of pass attempts per season weighted by the number of receiving yards by that player. Why use that instead of a simple average? When thinking about whether a receiver played for a run-heavy or pass-happy team, we tend to think of that receiver during his peak years. If he caught 10 passes for 150 yards as a rookie on a very pass-happy team, that should not be given the same weight as the number of pass attempts his team produced in his best season. For example, here is how I derived the 635 attempt number for Megatron.

Twenty-one percent of his career receiving yards came in 2012, when Detroit passed 740 times (excluding sacks). Therefore, 21% of his team pass attempts average comes from that season, while 18% comes from his 2011 season, 16% from his 2013 season, and so on. In the table below, the far right column shows how we get to that 635 figure: by multiplying in each season the percentage of career receiving yards recorded by him in that season by Detroit’s Team Pass Attempts.

YrRecYdTPAPercTM * %
2013149263416%101.4
2012196474021.1%155.8
2011168166618%120
2010112063312%76
200998458510.5%61.7
2008133150914.3%72.6
20077565878.1%47.6
Total93284354100%635.2

There are 121 players with 7,000 career receiving yards. Unsurprisingly, Johnson has the highest weighted average number of team pass attempts, which must be recognized when fawning over his great raw totals. Marques Colston is just a hair behind Johnson, but no other player has an average of 600+ team pass attempts.

The table below contains data for all 121 players (by default, the table displays only the top 25, but you can change that). Here’s how to read it, starting with the GOAT: Jerry Rice ranks first in career receiving yards, and he played from 1985 to 2004. Rice played in 303 games, gained 22,895 receiving yards, and his teams threw a weighted average of 547 passes per season. Among these 121 players, that rank Rice as playing for the 25th highest or most pass-happy team. Rice also averaged 76 receiving yards per game, which ranks 5th among this group. [continue reading…]

{ 16 comments }

What Does Chris Johnson Have Left?

CJ1K?

CJ1K?

After six seasons in Tennessee, Chris Johnson is now a free agent. The star running back has had an up-and-down career. The successes are easy to document: since 2008, only Adrian Peterson has more rushing yards, and Johnson has rushed for 1,299 more yards than the next closest back, Matt Forte. Johnson was just 32 yards shy of 10,000 yards from scrimmage with the Titans, the second most in the league over that period behind only Peterson. There was a magical 2009 season, where Johnson rushed for 2,000 yards, averaged 5.6 yards per carry, and set the still-standing record for yards from scrimmage in a season with 2,509. [1]Less relevant but one of my favorite Johnson moments came in the 2007 Hawaii Bowl against a Boise State team that would go 38-2 over the following three seasons. In that game, East Carolina won 41-38 … Continue reading

But there’s also the bad. In the four seasons since his Hall of Fame-caliber performance, Johnson has had 24 games with five or more carries where he averaged three or fewer yards per rush, the most such games in the league. In the last three seasons, Johnson has recorded 10+ carries and averaged 3.0 YPC or worse in 17 of his 48 games, also the most in the NFL. The man known as CJ2K became famous for his big play ability but has recorded a below-average YPC rate in two of the past three seasons.  And while he’s never been a success rate star, he’s still checking in at below-average in percentage of successful runs in recent times, so it’s not as though the lower YPC average is a reflection of a style change to become a more consistent back. Last year, Johnson ranked 53rd in Advanced NFL Stats’ measure of success rate out of 84 eligible backs.

Johnson’s a pretty complicated back to analyze. He’s boom or bust, but he’s also displayed excellent durability over his career and is a consistent yardage machine. But he now rarely make big plays and is at an age where nothing is assured. In 2009, Johnson had 22 carries of 20+ yards; last year, he had only five such runs. So I decided a fun way to project Johnson’s 2014 season would be to run him through a similarity program based on nine factors. [continue reading…]

References

References
1 Less relevant but one of my favorite Johnson moments came in the 2007 Hawaii Bowl against a Boise State team that would go 38-2 over the following three seasons. In that game, East Carolina won 41-38 as Johnson rushed for 223 yards and scored two touchdowns on 28 carries. That’s the second most rushing yards allowed by Boise State to any player since 2000.
{ 3 comments }

The Best Kickoff Returners in NFL History

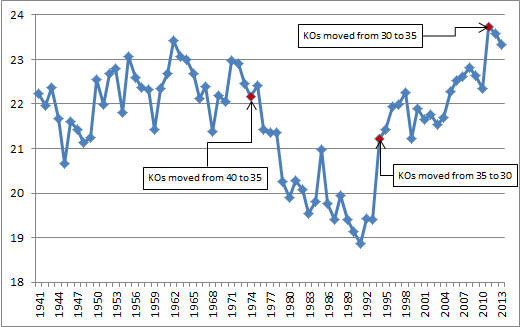
Two weeks ago, I looked at the best punt returners in NFL history; today, a look at the top kickoff returners. Again, we begin with a graph of the league average yards per kickoff return from 1941 through 2013. The variation here has been relatively minor, falling in a 5-yard window from 18.9 yards per return to 23.7.

kickoffs [continue reading…]

{ 17 comments }

Okay, that title could be the opener to any number of jokes. But I mean “strange season” in the way Football Perspective has used the phrase before. Take a look at Cleveland’s schedule and results from 2013:

Score
Week Day Date Rec Opp Tm Opp
1 Sun September 8 boxscore L 0-1 Miami Dolphins 10 23
2 Sun September 15 boxscore L 0-2 @ Baltimore Ravens 6 14
3 Sun September 22 boxscore W 1-2 @ Minnesota Vikings 31 27
4 Sun September 29 boxscore W 2-2 Cincinnati Bengals 17 6
5 Thu October 3 boxscore W 3-2 Buffalo Bills 37 24
6 Sun October 13 boxscore L 3-3 Detroit Lions 17 31
7 Sun October 20 boxscore L 3-4 @ Green Bay Packers 13 31
8 Sun October 27 boxscore L 3-5 @ Kansas City Chiefs 17 23
9 Sun November 3 boxscore W 4-5 Baltimore Ravens 24 18
10 Bye Week
11 Sun November 17 boxscore L 4-6 @ Cincinnati Bengals 20 41
12 Sun November 24 boxscore L 4-7 Pittsburgh Steelers 11 27
13 Sun December 1 boxscore L 4-8 Jacksonville Jaguars 28 32
14 Sun December 8 boxscore L 4-9 @ New England Patriots 26 27
15 Sun December 15 boxscore L 4-10 Chicago Bears 31 38
16 Sun December 22 boxscore L 4-11 @ New York Jets 13 24
17 Sun December 29 boxscore L 4-12 @ Pittsburgh Steelers 7 20

[continue reading…]

{ 3 comments }

How will DeSean Jackson age?

DeSean Jackson crosses the goal line before discarding the ball

DeSean Jackson crosses the goal line before discarding the ball.

If you believe the rumors, the Eagles are desperately trying to trade wide receiver DeSean Jackson; absent an eligible suitor, and Philadelphia may even cut the three-time Pro Bowler. This is a pretty weird situation; what’s even weirder is how few tangible reasons have been given as to why the Eagles desire to remove him from the roster.

Jackson has a cap hit of $12.75M this year and $12M in each of the next two seasons; that’s obviously a significant amount, and I don’t doubt that Philadelphia feels a bit of buyer’s remorse on that contract. But reading the tea leaves indicates that a high salary cap figure is only part of the issue; unfortunately, without knowing the other reasons, it’s impossible to suggest whether a team would be wise to trade for him. This might be a Randy Moss-to-New England situation, or it could just as easily be a Santonio Holmes-to-the-Jets disaster. [continue reading…]

{ 10 comments }
Sanchez tries to understand the formula for wins above expectation

Sanchez tries to understand the formula for wins above expectation.

On Friday, the Jets released Mark Sanchez. I don’t have much in the way of a post mortem, but it felt odd not to have at least some post on the subject. And despite watching every Sanchez start for four years, it still takes me by surprise when I see that his career record is 33-29. That winning record came despite Sanchez being one of the worst starters in the league for most of his career. Through five seasons, he has a career Relative Adjusted Net Yards per Attempt average of -1.03. Among the 140 quarterbacks to enter the NFL since 1970 who have started 40 games, only one other passer (who will remain nameless for now) had a winning record with a worse RANY/A than Sanchez; the next worst quarterback with a winning record over that time frame is Trent Dilfer, who finished 58-55 with a career -0.85 RANY/A.

If you grade quarterbacks by #Winz, Sanchez is above-average. If you look at passing statistics — i.e., ANY/A — he’s one of the worst in the league. So I thought I would quantify that gulf and see if Sanchez was the quarterback with the largest disparity between winning percentage and passing statistics.

First, I ran a regression on team wins (pro-rated to 16 games) and Relative ANY/A for every year since 1970. The best fit formula was 8.00 + 1.756 * RANY/A. In other words, for every 1.00 ANY/A above league average, a team should expect to win 1.756 more games. For a team to expect to win 11 games, they need to finish 1.71 ANY/A better than average.

Next, I calculated the career RANY/A — i.e., the ANY/A relative to league average — for every quarterback to enter the league since 1970. For example, Sanchez has a RANY/A of -1.03. This means you would expect his teams to win 6.19 games every season, for a 0.387 winning percentage. In reality, Sanchez’s Jets have a 0.632 winning percentage, which means he has an actual winning percentage that is 0.146 higher than his expected winning percentage. As it turns out, that differential puts him in the top ten, but it is not the best mark.

That honor belongs to Mike Phipps. Here’s how to read the table below, which shows all 140 quarterbacks to enter the league since 1970 and start at least 40 games. Phipps entered the league in 1970 and last played in 1981, starting 71 games in his career. He finished with a career RANY/A of -1.52; as a result, he “should have” won only 23.6 games. In reality, he won 39 games, meaning he won 15.4 more games than expected. On a percentage basis, his RANY/A would imply a .333 expected winning percentage; his actual winning percentage was 0.549, and that difference of +0.216 is the highest in our sample. [continue reading…]

{ 11 comments }

Meaningless receiving yards

Shorts makes a meaningful catch

Shorts makes a meaningful catch.

Which player led the league in meaningless receiving yards last year? Wait, what are meaningless receiving yards?

I am defining a meaningless receiving yard as one where:

  • On third or fourth down, a player gained fewer yards than necessary for the first down.
  • The receiving yard(s) came in a loss and when the player’s team trailed by at least 28 points.
  • The receiving yard(s) came in a loss and when the player’s team trailed by at least 21 points with fewer than 15 minutes remaining.
  • The receiving yard(s) came in a loss and when the player’s team trailed by at least 14 points with fewer than 8 minutes remaining.
  • The receiving yard(s) came in a loss and when the player’s team trailed by at least 9 points with fewer than 3 minutes remaining.

This definition is not perfect — Le’Veon Bell had a 29-yard reception on 3rd-and-30 last season against the Patriots, and then rushed for a first down on 4th-and-1 — but I think it gets us close enough to perfect that I feel comfortable using it. The results aren’t too surprising — two Jaguars ranked in the top three, separated by the player who led the league in receiving yards — but that doesn’t have to be the end of the analysis. [continue reading…]

{ 7 comments }

No, Peyton, you are #1

No, Peyton, you are #1.

While working on a different post, I needed to derive a quick-and-dirty formula to identify the top 100 or so quarterbacks in NFL history. Here is how I went about doing that:

1) Calculate the Relative ANY/A of each quarterback in every season since 1950. ANY/A, of course, is Adjusted Net Yards per Attempt, defined as (Gross Pass Yards + 20*Pass_TDs – 45*INTs – Sack Yards Lost) divided by (Pass Attempts + Sacks). For quarterback seasons before 1969, we do not have sack data, so that part of the analysis is ignored (I could have used estimated sack data, but I being lazy).

2) For each quarterback season, multiply each quarterback’s number of dropbacks by his Relative ANY/A to derive a Passing Value over Average metric.

3) Pro-rate non-16 game seasons to 16 games.

4) Calculate a career grade for each quarterback based on the sum of his best five seasons.

Then I realized that this data, while background material for a separate post, was probably interesting to folks in its own right.  Hence today’s post. You should not be surprised to see that Peyton Manning is number one on this list. Here’s how to read his line. His best year came in 2004, when he produced 2113 Adjusted Net Yards over Average. Last year was his second best season — his gross numbers were more impressive, of course, but he produced “only” 2,031 ANY over average. Manning’s other three best years came in ’06, ’05, and ’03. Overall, he produced 8,115 Adjusted Net Yards over Average over his five best seasons, the best of any quarterback in this study (by a large margin). The table below shows the top 100 passers since 1950 (you can change the number of quarterbacks displayed in the dropdown box). [continue reading…]

{ 71 comments }

The Best Punt Returners in NFL History

Six years ago, I wrote a series of posts looking at the best returners in NFL history. Today, I want to update that list by examining the best punt returners in NFL history. As with most statistics, yards per punt return has fluctuated throughout most of NFL history. The graph below shows the average in this metric from 1941 through 2013:

y pr [continue reading…]

{ 7 comments }

Jones catches another bomb

Jones catches another bomb.

In November, I noted that Chris Johnson was the career leader in average length of rushing touchdown. Since then, he’s actually dropped to number two, as his six rushing touchdowns covered “only” 84 yards in November and December. But what about the career leader in average length of receiving touchdown?

That title belongs to former Giants wide receiver Homer Jones.  A star in the late ’60s, 19 of Jones’ 36 career touchdowns went for 50 or more yards. The table below shows all 413 players to record at least 35 receiving touchdowns (including the postseason) from 1940 to 2013.  While Jones leads in average touchdown length, I think it makes more sense to sort the list by median touchdown length, although that doesn’t matter much for Jones.  For each player listed, I’ve included both their average and median touchdown length, the years they played, and a best guess at their primary position.  The table by default shows 50 entries, but you can change that; in addition, the table is fully sortable and searchable. [continue reading…]

{ 8 comments }

How Bad Was Ray Rice in 2013?

Rice just barely averaged his height in 2013

Rice just barely averaged his height in 2013.

The 2013 season was a disaster for Ray Rice, and 2014 isn’t off to a very good start, either. Last season, Rice carried 214 times for just 660 yards and four touchdowns, producing an anemic 3.1 yards per carry average. On November 9th, I asked whether Rice was already washed up; at the time it felt a bit premature, but in retrospect, such a view seems much more reasonable. Averaging so few yards per carry over such a large number of carries is pretty rare. How rare?

As a disclaimer, I’m in the camp that thinks YPC is an overrated statistic. In 2013, Marshawn Lynch, Eddie Lacy, and Frank Gore all averaged around the league average of 4.17 yards per carry, but that doesn’t make them average backs. So consider much of this post to be a bit of trivia and fun with stats, rather than the best way to identify running back productivity. With that disclaimer out of the way, I calculated each player’s “yards above league average” for each season since 1950, which is the product of a player’s number of carries and the difference between his YPC average and the league average YPC rate.

For example, since Rice averaged 3.08 YPC on 214 carries, he gets credited for being 231 yards below average in 2013. By this measure, Rice was the worst running back in the league. He was worse than his teammate Bernard Pierce (who actually had a lower YPC average but on fewer carries, so he finished 197 yards below average), worse than Willis McGahee (-198) or Rashard Mendenhall (-217), and even worse than Trent Richardson (-220). And this wasn’t your typical worst season in the league, either: his 2013 performance ranks as the 15th worst in this metric since 1950: [continue reading…]

{ 2 comments }

Austin and the Rams blew out the Colts

Austin and the Rams were nonconformists.

In week 10 of the 2013 season, the Rams traveled to Indianapolis. By the end of the season, St. Louis had an SRS grade of +2.2, meaning they were 2.2 points better than average. The Colts finished 2013 with an SRS grade of +4.1; if you award three points for home field, we would expect Indianapolis to have defeated St. Louis by 4.8 points (the Colts, in fact, were 9-point favorites). What happened? You probably remember: Tavon Austin had a record-setting day, the Rams jumped out to a 28-0 halftime lead, and Andrew Luck wasn’t able to mount one of his patented comebacks. St. Louis posted a Game Script of 23.2, the second largest result of the season, en route to a 38-8 victory.

Instead of a 4.8-point loss, the Rams won by 30 points. That difference of 34.8 points made it the least-conforming game of the 2013 season. What was the most? In week 6, the Chiefs (SRS of +6.1) hosted the Raiders (SRS of -8.0) and won, 24-7.

The table below shows every regular season game in 2013.  The “Boxscore” cell is linked to the boxscore for that game on PFR, the “Exp” column shows the expected result, and the “Diff” column — by which the table is sorted — shows the difference between the expected result and the actual result. [continue reading…]

{ 4 comments }

Brown was number one in 2013

Brown was number one in 2013.

Wide receiver is a notoriously difficult position to analyze using statistics. Era adjustments are arguably more important here than at any other position, but even within the same season it is not easy to compare wide receivers. Most people, myself included, would probably say that Josh Gordon or Calvin Johnson was the best wide receiver in football in 2013. Gordon, after all, led the NFL in receiving yards despite missing two games, while Johnson is well, Megatron. If you place more emphasis on other metrics, you would be interested to know that Pierre Garcon led the NFL in receptions, while Jimmy Graham led all players in receiving touchdowns (and Demaryius Thomas led all wide receivers in that statistic).

But, as you can tell from the title of this post, it was Pittsburgh’s Antonio Brown who led all players in True Receiving Yards. Regular readers are familiar with the concept of True Receiving Yards, but walking through the system with both Brown and Gordon will serve as a useful reminder.

Let’s start by recognizing that Brown’s season was special in its own right: he became the first player to record 50 receiving yards in 16 different games in a single season. He also finished 2nd in both receptions and receiving yards, so it doesn’t take much processing through the True Receiving Yards machine to vault Brown into first place. He ended the year with a 110-1499-8 stat line, while Gordon finished 2013 with 87 catches for 1,646 yards and nine scores.

The first step in the True Receiving Yards calculation is to convert each player’s stat line into a single statistic, Adjusted Catch Yards. By giving each player 5 yards for each reception and 20 yards for each touchdown, Brown is credited with 2,209 Adjusted Catch Yards and Gordon 2,261, making them the top two players in 2013 by that metric. [continue reading…]

{ 3 comments }

Smith against the Bucs

Smith looks to go deep against the Bucs.

We were very spoiled last year. Andrew Luck, Robert Griffin III, and Russell Wilson had outstanding rookie seasons in 2012, and perhaps that set expectations a bit high for the 2013 class. No one will confuse those three with EJ Manuel, Geno Smith, and Mike Glennon, all of whom struggled for most of their rookie seasons. But while Smith and Glennon didn’t produce excellent numbers, they produced very interesting ones.

Among the 35 quarterbacks with the most pass attempts, Glennon finished a very pedestrian 27th in Adjusted Net Yards per Attempt. But he did it in a very unique way: Glennon had an outstanding 19/9 touchdown-to-interception ratio, but he ranked dead last in Net Yards per Attempt. One reason for that is Glennon averaged only 10.6 yards per completion, the 3rd worst average among the 35 passers.

Smith finished 34th in ANY/A, largely due to his horrific 12/21 TD/INT ratio. He was a bit better in NY/A, ranking 28th, but what’s interesting about the Jets quarterback is that he ranked 7th in yards per completion. That metric is not a particularly effective measure of passer quality — after all, Matt Ryan ranked 35th — but it is a pretty good way to describe a quarterback’s style. While both Glennon and Smith were below average, they were below average in very different ways. [continue reading…]

{ 10 comments }

When I went on the Advanced NFL Stats Podcast in late December, I discussed my use of Z-scores to measure the Seattle pass defense. Host Dave Collins asked me if I was planning on using Z-scores to measure other things, like say, Adrian Peterson’s 2012 season. I told him that would be an interesting idea to look at in the off-season.

Well, it’s the off-season. So here’s what I did.

1) For every season since 1932, I recorded the number of rushing yards for the leading rusher for each team in each league. So for the Minnesota Vikings in 2012, this was 2,097.

2) Next, I calculated the average number of rushing yards of the top rusher of each other team in the NFL. In 2012, the leading rusher on the other 31 teams averaged 974 yards.

3) Then, I calculated the standard deviation of the leading rushers for all teams in the NFL. In 2012, that was 386 yards.

4) Finally, I calculated the Z-score. This is simply the difference between the player’s average and the league average (for Peterson, that’s 1,123), divided by the standard deviation. Peterson’s Z-score was 2.91, good enough for 15th best since 1932. The table below shows the top 250 seasons using this method from 1932 to 2013; it’s fully searchable and sortable, and you can change the number of entries shown by using the dropdown box on the left. [continue reading…]

{ 7 comments }

Pythagenpat Records in 2013

Brett  Keisel

Brett Keisel.

For years, sports analysts have used Pythagorean records as more granular measure of team strength than pure record. We’re not exactly at the point where Pythagorean records are mainstream, but I think, at least with respect to readers of this blog, people are pretty comfortable using Pythagorean records.

For the uninitiated, the use of Pythagorean records in sports dates back at least 30 years, and probably longer. Bill James is generally credited with popularizing this approach in baseball, and the same analysis has since been applied to just about every other spot. The formula to calculate a team’s Pythagorean winning percentage is always some variation of:

(Points Scored^2) / (Points Scored ^2 + Points Allowed^2)

My research has discovered that for football, the best-fit exponent is 2.57. However, football is subject to points inflation.  The best-fit exponent for the NFL in 1972 is not necessarily the best one for 2002 or 2013. This is particularly relevant now, as the 2013 season was the second highest scoring in history. [1]In fact, it came in just four hundredths of a point behind the 10-team, 12-game 1948 schedule Moreover, the same exponent that works for a Broncos game does not necessarily work for a Panthers game. [continue reading…]

References

References
1 In fact, it came in just four hundredths of a point behind the 10-team, 12-game 1948 schedule
{ 8 comments }

The Best Scoring Offenses Since 1932

Denver had one of the greatest offenses ever

Denver had one of the greatest offenses ever.

On Monday, I looked at the greatest defenses — measured simply by points allowed and adjusted for strength of schedule — in NFL history. Today, I want to look at which offenses were the greatest in regular season history, and see where the 2013 Broncos stack up.

As noted in the post on defenses, during Super Bowl week, Bill Barnwell’s article ranked Denver’s 2013 offense as the greatest scoring machine ever. He used the statistical measurement known as the Z-Score to show that Denver’s offense was 3.3 standard deviations above average, and no offense had ever been 3.3 standard deviations above average before.

Where does that 3.3 number come from? Denver averaged 37.9 points per game during the regular season. The league average was 23.4 points, which means that Denver’s offense was 14.5 PPG better than average. The standard deviation of points per game among the 32 NFL offenses in 2013 was 4.36 points; therefore, Denver gets a Z-score of 3.32, because the Broncos scored points at a rate that was 3.32 standard deviations better than the mean. [continue reading…]

{ 8 comments }

2013 AV-Adjusted Team Age

The Rams are loaded with young talent

The Rams are loaded with young talent.

In each of the last two years, I’ve presented the AV-adjusted age of each roster in the NFL. Measuring team age in the NFL is tricky. You don’t want to calculate the average age of a 53-man roster and call that the “team age” because the age of a team’s starters is much more relevant than the age of a team’s reserves. The average age of a team’s starting lineup isn’t perfect, either. The age of the quarterback and key offensive and defensive players should count for more than the age of a less relevant starter. Ideally, you want to calculate a team’s average age by placing greater weight on the team’s most relevant players.

My solution has been to use the Approximate Value numbers from Pro-Football-Reference.com.  The table below shows the average age of each team, along with its average AV-adjusted age of the offense and defense. Here’s how to read the Rams’ line. In 2013, St. Louis was the youngest team in the league, with an AV-adjusted team age of 25.5 years (all ages are measured as of September 1, 2013). The average AV-adjusted age of the offense was 25.9 years, giving the Rams the third youngest offense in the NFL. The average age of the defense was 25.2 years, and that was the youngest of any defense in football in 2013.

[continue reading…]

{ 3 comments }

On Friday, I explained the idea behind Playoff Leverage. That post is required reading before diving in today, but the summary is that the Super Bowl counts for more than the conference championship games, which count for more than the division round games, which count for more than the wild card games. The value that is assigned to each game — the Super Bowl is currently worth 3.14 times as much as the average playoff game — is then used to adjust the stats of the players in those games.

For quarterbacks, the main stat used to measure passing performance is Adjusted Net Yards per Attempt. In case you forgot, ANY/A is defined as

[math]Pass Yards + 20*PassTDs – 45*INTs – SackYards)/(Attempts + Sacks)[/math]

Today, we’re going to look at every quarterback since 1966. Players like Bart Starr and Johnny Unitas who played before 1966 will count, but their stats from 1965 and earlier will not be included. This obviously is a serious disservice to Starr in particular, but for now, I’m going to only focus on the Super Bowl era. [continue reading…]

{ 11 comments }

Regular readers know I’m not prone to exaggeration. I’m more of a splits happen kind of guy. But Super Bowl XLVIII will, in my opinion, be the greatest passing showdown ever. This year’s Super Bowl checks in as the greatest offensive/defensive showdown in Super Bowl history (and the greatest of any game, regular or postseason, since 1950). That’s because the passing showdown between Denver and Seattle is arguably the greatest of any game in all of pro football history.

How can we quantify such a statement? I’m glad you asked. If you recall, I labeled the 2013 Seahawks as one of the five greatest pass defenses since 1950. For new readers, Adjusted Net Yards per Attempt is calculated as follows:

[math]
(Gross Pass Yards + 20 * PTDs – 45 * INTs – Sack Yds)/(Attempts + Sacks)[/math]

In 2013, the Seahawks allowed 3.19 Adjusted Net Yards per Attempt (Seattle allowed 3,050 gross passing yards and 16 TDs, while forcing 28 interceptions and recording 298 yards lost on sacks, all over 524 pass attempts and 44 sacks.). The other 31 pass defenses allowed an average of 5.98 ANY/A, which means Seattle’s pass defense was 2.79 ANY/A above average. Over the course of the 568 opponent dropbacks, this means the Seahawks provided 1,582 adjusted net yards of value over average. In other words, the Seattle pass defense provided 99 adjusted net yards over average on a per game basis. Let’s be clear: the Legion of Boom is not just a hype machine, and Richard Sherman, Earl Thomas, Kam Chancellor, and company form the best secondary in the league.
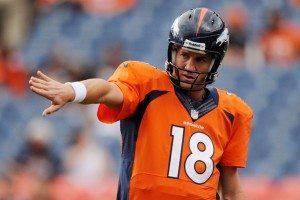
All other passing attacks are pushed aside when Manning is involved.

All other passing attacks are pushed aside when Manning is involved.

Denver’s offense was even more dominant, although that’s to be expected: in general, the spread in offensive ratings is a bit wider than it is on the defensive side of the ball. Denver threw for 5,572 gross passing yards and 55 touchdowns, while throwing just 10 interceptions and losing only 128 yards to sacks. The Broncos had 675 pass attempts and were sacked just 20 times, giving them an 8.77 ANY/A average. The other 31 offenses averaged only 5.79 ANY/A, meaning the Broncos were 2.98 ANY/A better than average. Over the 695 dropbacks the team had, that means Denver provided 2,072 adjusted net yards of value average average. On a per-game basis, that’s 130 yards of value each game!

So, how do we judge the greatest passing showdowns in football history? Denver’s passing offense gets a rating of +130, while Seattle’s pass defense gets a rating of +99. Those two numbers have a Harmonic Mean of 112. That’s easily the most in Super Bowl history. In fact, it’s the third most in any playoff game ever, and those other two games each have asterisks.

In the 1961 AFL, the Houston Oilers behind George Blanda, Bill Groman, and Charley Hennigan possessed an incredible passing offense (rating of +167), while the San Diego Chargers had a dominant pass defense (+129). But in the early days of the AFL, the talent pool was diluted; this would be akin to comparing two teams in non-BCS conferences with out-of-this-world statistics to a matchup between champions in two power conferences. For what it’s worth, Houston won the game — played in San Diego — but with a catch. The Oilers offense was shut down, as Blanda went 18/40 for 160 yards with 1 touchdown and 5 interceptions…. but Houston won 10-3, as Jack Kemp threw four picks for the Chargers. [continue reading…]

{ 1 comment }

Are Teams Afraid To Pass Against Seattle?

The Legion of Boom May Be Harmful To Your Offense's Health

The Legion of Boom May Be Harmful To Your Offense's Health.

We know that the Seahawks pass defense is historically good, but the title of this post sounds like it was written by a Seahawks homer, right? I mean, who else besides a green-and-blue fanboy (or maybe Richard Sherman or Earl Thomas) would write something as absurd as “Seattle’s pass defense is so good that teams are afraid to throw on them!!!”

The thing is, it’s kind of true. Seattle faced only 568 pass attempts (including sacks) during the regular season, the sixth fewest in the NFL.  Some of that is due to the Seahawks pace on offense and dominance of a defense that prevented sustained drives; even still, opponents passed on “only” 57.4% of all plays against Seattle.

Seattle ranked below average — 18th — in percentage of pass plays faced, but there’s a reason I put only in quotes. Seattle held an average lead over every second of game play this year of 5.6 points, the third best mark in the NFL. Denver and San Francisco were the only teams to play with larger leads, and they ranked 6th and 7th in percentage of plays faced that were passes. This is hardly a newsflash — teams generally throw often when trailing — but that wasn’t the case with 2013 Seahawks.

When Steve Buzzard used the Game Scripts data to determine defensive pass identities, he found that teams were more hesitant to pass against Seattle (once adjusting for the score and strength of schedule) than against any team in the league. I thought it would be interesting to take another crack at measuring this effect. We can use the score differential after each of the four quarters of the game to determine how many pass attempts (as a percentage of total plays) a team *should* face. [continue reading…]

{ 4 comments }

Even for Football Perspective, this is a very math-heavy post. I’ve explained all the dirty work and fine details behind this system, but if you want to skip to the results section, I’ll understand. Heck, it might even make more sense to start there and then work your way back to the top.

Background

In 2012, Neil Paine wrote a fascinating article on championship leverage in the NBA, building on Tom Tango’s work on the same topic in Major League Baseball. Championship Leverage was borne out of the desire to quantify the relative importance of any particular playoff game. Truth be told, this philosophy has more practical application in sports where each playoff round consists of a series of games. But Neil applied this system to the NFL playoffs and crunched all the data for every playoff game since 1965. Then he was kind enough to send it my way, and I thought this data would make for a good post.

The best way to explain Championship Leverage is through an example. For purposes of this exercise, we assume that every game is a 50/50 proposition. At the start of the playoffs, the four teams playing on Wild Card weekend all have a 1-in-16 chance of winning the Super Bowl (assuming a 50% chance of winning each of four games). This means after the regular season ended, the Colts had a 6.25% chance of winning the Super Bowl. After beating Kansas City, Indianapolis’ win probability doubled to 12.5%. Win or lose, the Colts’ Super Bowl probability was going to move by 6.25%, a number known as the Expected Delta.

New England, by virtue of a first round bye, began the playoffs with a 12.5% chance of winning the Lombardi. With a win over Indianapolis, the Patriots’ probability of winning the Super Bowl jumped 12.5% to 25%; had New England lost, the odds would have moved from 12.5% to zero. Therefore, the Expected Delta in a Division round game is 12.5%. [continue reading…]

{ 20 comments }

Harrison actually caught this pass.

Harrison actually caught this pass.

In a couple of weeks, the newest class of the Pro Football Hall of Fame will be announced. Only five modern-era wide receivers have been selected enshrinement on their first ballot: Jerry Rice, Paul Warfield, Steve Largent, Raymond Berry, and Lance Alworth. This year, in his first year of eligibility, Marvin Harrison is one of 15 finalists for the Pro Football Hall of Fame. I suspect the majority will view Harrison as a first-ballot Hall of Famer, but there are a few minority voices who disagree.

As best as I can surmise, there are three primary reasons why Harrison shouldn’t be selected in 2014. Two of those reasons can be addressed rather easily, but let’s start with the more complicated issue to analyze.

Harrison’s numbers are inflated because of Peyton Manning

Jerry Rice is the greatest wide receiver of all time. Rice was probably better at his position than any football player has ever been at theirs. Rice might be the most dominant sportsman of his generation. Rice probably isn’t in the discussion of greatest athletes in the history of mankind, which is about the only negative thing I’m willing to say about him. All of that is important background to say, being worse than Jerry Rice is not a negative, but just a fact of life as a wide receiver.
[continue reading…]

{ 22 comments }

When it comes Patriots/Colts, it’s easy to want to focus on Tom Brady vs. Andrew Luck. Or to marvel at the sheer number of star players these teams have lost in the last 12 months. If you played college in the state of Florida, you’re probably not going to be playing in this game: T.Y. Hilton is the last star standing with Vince Wilfork, Aaron Hernandez, Brandon Spikes, and Reggie Wayne gone. The Patriots also have placed Rob Gronkowski, Sebastian Vollmer, Jerod Mayo, Tommy Kelly and Adrian Wilson on injured reserve, while Devin McCourty and Alfonzo Dennard are both questionable. Also, of course, Brady is probable with a shoulder.

The Colts just put defensive starters Gregory Toler and Fili Moala on injured reserve, adding to a list that already included Wayne, Ahmad Bradshaw, Vick Ballard, Dwayne Allen, Donald Thomas, Montori Hughes, and Pat AngererLaRon Landry and Darrius Heyward-Bey are both questionable, and the latter’s injury caused the team to sign ex-Patriot Deion Branch.

All the injuries and changing parts make this a pretty tough game to analyze. So I’m not going to, at least not from the usual perspective. Instead, I want to take a 30,000 foot view of the game. According to Football Outsiders, the Patriots were the most consistent team in the league this season, while the Colts were the fourth least consistent team. Rivers McCown was kind enough to send me the single-game DVOA grades for both teams this season, and I’ve placed those numbers in the graph below with the Colts in light blue and the Patriots in red. The graph displays each team’s single-game DVOA score for each game this season, depicted from worst (left) to best (right). For Indianapolis, the graph spans the full chart, from the worst game (against St. Louis) to the best (against Denver). As you can see, the portion of the graph occupied by New England is much narrower, stretching from Cincinnati to Pittsburgh. [continue reading…]

{ 7 comments }

Steve Buzzard has agreed to write another guest post for us. And I think it’s a very good one. Steve is a lifelong Colts fan and long time fantasy football aficionado. He spends most of his free time applying advanced statistical techniques to football to better understand the game he loves and improve his prediction models.


Last month, I wrote about how to project pass/run ratios using offensive Pass Identities and the point spread. However, this methodology only considers one side of the ball. Can we actually improve our projections model using both offensive and defensive Pass Identities? As it turns out the answer is yes.

First, I started off by creating defensive Pass Identities using the same methodology found here. The first thing I noticed was the standard deviation of pass ratios for defenses was only 3.0% compared to 5.1% for offenses. This led me to believe that offenses control how much passing goes on in a game more than defenses. I was glad to see this as it confirmed most of my previous research as well. Given this, it wasn’t appropriate to use a standard deviation of 3.0% for defenses in my projection while using a standard deviation of 5.1% for offenses. Instead, I used the combined standard deviation of all 64 offensive and defensive pass ratios, which turned out to be 4.17%. This doesn’t change the order of passer identities much but obviously does increase the deviation from the mean for the offensive side of the ball and decrease it for the defensive side. [Chase note: Determining the best way to handle the differing spreads between offensive and defensive pass ratios is a good off-season project; in the interest of time, I advised Steve to split the difference and move ahead with the analysis.]

Now that we have a Pass Identity grades for both sides of the ball, we can add a strength of schedule adjustment, too. To make the SOS adjustment, I simply took the average of the defensive Pass Identities played by each offensive unit and the average of the offensive Pass Identities played by each defensive unit. As expected the SOS adjustments had a much larger impact on the defensive Pass Identities than the offensive Pass Identities.
[continue reading…]

{ 8 comments }
Still number one.

Still number one.

After 15 weeks, I wrote that Seattle’s pass defense looked to be one of the most dominant since the merger. With the regular season now over, and the Seahawks getting ready for their first playoff game, I wanted to revisit this question and slightly tweak the methodology.

We begin with the base statistic to measure pass defenses, Adjusted Net Yards per Attempt.  Team passing yards and team passing yards allowed, unlike individual passing yards, count sack yards lost against a team’s passing yards total. So to calculate ANY/A on the team level, we use the formula (Passing Yards + 20*TD – 45*INT) divided by (Attempts + Sacks).  The Seahawks allowed just 3.19 ANY/A this year, which was 1.20 ANY/A better than any other defense this season.  In fact, it was so good that it enabled Seattle to easily post the best ANY/A differential (offensive ANY/A minus defensive ANY/A) in the league, too.  The Seahawks 3.19 average is the 4th best average in the least 20 years (behind only the 1996 Packers, 2002 Bucs, and 2008 Steelers). But what makes Seattle’s accomplishment more impressive is the passing environment of the NFL in 2013.

When I graded the Seahawks three weeks ago, I defined the league average ANY/A in the customary way: the ANY/A average of the passing totals of the league as a whole. This time around, I decided it would be more appropriate to (1) exclude each team’s own pass defense when calculating the league average, and (2) take an average of the other team’s ANY/A ratings, as opposed to taking an average of the totals. In 2013, the other 31 pass defenses allowed an average of 5.98 Adjusted Net Yards per Attempt. That means Seattle allowed 2.79 fewer ANY/A than the average team this year: that’s better than every defense since 1990 other than the 2002 Bucs.

Next, I calculated the Z-Score for each pass defense. The Z-Score simply tells us how many standard deviations from average a pass defense was. The standard deviation of the 32 pass defenses in 2013 was 0.95, which means the Seahawks were 2.93 standard deviations above average. That’s the 4th best of any defense since 1950.
[continue reading…]

{ 12 comments }

Love the Bowl Championship Series or (more likely) hate it, tonight marks the end of college football’s 16-year BCS experiment. Designed to bring some measure of order to the chaotic state college football had been in under the Bowl Alliance/Coalition, the BCS did streamline the process of determining a national champion — though it was obviously not without its share of controversies either.

If various opinion polls conducted over the years are any indication, the public is ready to move on from the BCS to next season’s “plus-one”-style playoff system. But before it bids farewell forever, how does the BCS grade out relative to other playoff systems in terms of selecting the best team as a champion?

Back in 2008, I concluded that it didn’t really do much worse of a job than a plus-one system would have. But that was more of an unscientific survey of the 1992-2007 seasons than a truly rigorous study. Today, I plan to take a page from Doug’s book and use the power of Monte Carlo simulation to determine which playoff system sees the true best team win the national title most often.

(Note: If you just want the results and don’t want to get bogged down in the details, feel free to skip the next section.) [continue reading…]

{ 21 comments }
Next Posts Previous Posts