≡ Menu

2017 AV-Adjusted Team Age: Offense

After each of the last six years, I’ve presented the AV-adjusted age of each roster in the NFL. Measuring team age in the NFL is tricky. You don’t want to calculate the average age of a 53-man roster and call that the “team age” because the age of a team’s starters is much more relevant than the age of a team’s reserves. The average age of a team’s starting lineup isn’t perfect, either. The age of the quarterback and key offensive and defensive players should count for more than the age of a less relevant starter. Ideally, you want to calculate a team’s average age by placing greater weight on the team’s most relevant players.

My solution has been to use the Approximate Value numbers from Pro-Football-Reference.com, and to calculate age using each player’s precise age as of September 1 of the year in question.  Today, we will look at offenses; tomorrow, we will crunch these same numbers for team defenses. The table below shows the average AV-adjusted age of each offense, along with its total number of points of AV. In 2017, the Browns, Jaguars, and Texans were the three youngest offenses, with Cleveland really standing out. [continue reading…]

{ 1 comment }

On Friday, I looked at each team’s offensive pass identity. Today, the reverse: a look at defensive pass identities.

The Jacksonville Jaguars were one of the best teams in the NFL last year. Jacksonville had the 3rd-best points differential in the NFL in 2017 after 1 quarter (+41), the 5th-best after 2 quarters (+86), the 4th-best through 3 quarters (+109), and tied for the 3rd-best points differential overall. Unsurprisingly, Jacksonville had the 4th best average Game Script last season, which means you should expect the Jaguars to be run-heavy and Jacksonville’s opponents to be pass-heavy.

On the offensive side, things held to form: Jacksonville rushed on 49.4% of plays, the highest ratio in the NFL last season. But on defense, that wasn’t the case: teams passed on only 56.4% of plays against the Jaguars last year! Consider that opponents passed on 65.4% and 62.3% of plays against the Eagles and Vikings, teams that finished 3rd and 5th in Game Script last season.

On the other side, the Tennessee Titans.  Last season, the Titans were an average team, finishing with a slightly negative Game Script. And yet teams passed on them like they were the Patriots! In fact, opponents passed against New England on 61.6% of plays and against the Titans on 61.7% of plays.  The Titans Game Script was 0.27 standard deviations below average, while the opponent pass ratio was 1.42 standard deviations above average. As a result, the Titans have a Defensive Pass Identity of +1.69, making them the defense teams were most likely to pass against. [continue reading…]

{ 0 comments }

Among players with at least 8,000 career receiving yards, there are just seven players who averaged fewer than one receiving touchdown per 200 receiving yards: Jeff Graham was by far the biggest outlier, with just one touchdown catch per 272 receiving yards. Henry Ellard is the second biggest outlier because (1) he’s Ellard, a borderline Hall of Famer and (2) he had just one touchdown per 212 receiving yards. Next up is Julio Jones at one score for every 211 receiving yards, followed by Eric Moulds, Johnnie Morton, another HOF candidate in Andre Johnson, and finally Terry Glenn.

So why does Jones have so few touchdowns as a percentage of his astronomical receiving yardage? To dig in a little deeper, I wanted to compare the length of his touchdowns to that of the other best receivers in today’s game. Who are the top 10 wide receivers of this current era? That’s subjective, of course, but in addition to Jones, a pretty good list would include Antonio Brown, Odell Beckham, DeAndre Hopkins, Mike Evans, A.J. Green, Larry Fitzgerald, Demaryius Thomas, Dez Bryant, and T.Y. Hilton. [continue reading…]

{ 2 comments }

Barry Sanders and Rushing Yards Gray Ink

On Thursday, I looked at a measure of passing efficiency and gray ink: where a first place finish rewards a player with 10 points, a second-place finish 9 points, a third-place finish 8 points, and so on. Today, I’m going to do the same thing but with rushing yards, so a rushing crown is worth 10 points, a runner-up title is worth 9 points, and so on. You can read a few twists in this footnote. [1]I want to give more credit to seasons where there were more teams. So when Kareem Hunt led the 32-team NFL last season, that was worth 10 points. What about when Pug Manders led the 9-team NFL in … Continue reading

Let’s use Barry Sanders as an example. In four seasons, he led the NFL in rushing (+40 points), and in three other seasons, he was the runner up (+27 points). He also had two seasons where he ranked 4th in rushing yards (+14) and one season where he ranked 5th (+6), for a total of 87 points. Using the pro-rated method explained in the footnote, since there were fewer than 32 teams during his career, Sanders actually gets credit for 82.7 points. That is still the most of any player in history: [continue reading…]

References

References
1 I want to give more credit to seasons where there were more teams. So when Kareem Hunt led the 32-team NFL last season, that was worth 10 points. What about when Pug Manders led the 9-team NFL in 1941? That feels less meaningful, and that is especially true when comparing a 9th-place finish in 2017 to a 9th-place finish in 1941. One option is to take the number of points — say, 10 — and divided it (32/X), with X being the number of teams in the league. So if there are 9 teams, you would take 10 and divide it by 3.55, and get 2.8 points. That feels too extreme to me: it would make a first-place finish in a 9-team league less valuable than an 8th-place finish in a 32-team league. So do I use 10 points or 2.8 points… or do I split the baby? Well, that’s what I did: I averaged those two numbers to get 6.4 points, equal to a 4th- or 5th-place finish today. I was comfortable with that result, but your mileage may vary.

Other thoughts: I combined all AFL and AAFC seasons. Probably not ideal, but it was the quickest/simplest thing to do.

{ 0 comments }

We don’t spend a lot of time looking at the bottom of leaderboard. When it comes to efficiency stats, you need to have a minimum threshold of quantity to qualify for such title. When it comes to passer rating, that minimum is 14 attempts per team game. Last year, DeShone Kizer had the worst passer rating in the NFL. In the last 11 years, the Jets have had three different quarterbacks with the worst passer rating in the NFL (Ryan Fitzpatrick, Geno Smith, and Kellen Clemens), while the entire NFC has just one (Jimmy Clausen).

The table below shows the quarterback with the worst passer rating in every year since the merger (along with their era-adjusted passer ratings), an update of this post from three years ago.

YearQuarterbackTeamEra-Adj PRAct PR
2017DeShone KizerCLE40.260.5
2016Ryan FitzpatrickNYJ47.069.6
2015Peyton ManningDEN44.467.9
2014Blake BortlesJAX47.369.5
2013Geno SmithNYJ47.166.5
2012Matt CasselKAN47.866.7
2011Blaine GabbertJAX47.765.4
2010Jimmy ClausenCAR41.058.4
2009JaMarcus RussellOAK33.750.0
2008Derek AndersonCLE50.066.5
2007Kellen ClemensNYJ44.960.9
2006Andrew WalterOAK42.155.8
2005Kyle OrtonCHI46.259.7
2004A.J. FeeleyMIA45.561.7
2003Kordell StewartCHI45.156.8
2002Joey HarringtonDET46.159.9
2001Jon KitnaCIN49.361.1
2000Akili SmithCIN41.452.8
1999Jake PlummerARI40.450.8
1998Ryan LeafSDG27.439.0
1997Kerry CollinsCAR45.255.7
1996Rick MirerSEA46.456.6
1995Trent DilferTAM47.560.1
1994Heath ShulerWAS47.859.6
1993Mark RypienWAS46.456.3
1992Stan GelbaughSEA44.352.9
1991Jeff Kemp2TM46.155.7
1990Marc WilsonNWE50.961.6
1989Troy AikmanDAL46.755.7
1988Vinny TestaverdeTAM42.548.8
1987Mark MalonePIT38.246.7
1986Jack TrudeauIND46.053.5
1985Vince FerragamoBUF43.950.8
1984Todd BlackledgeKAN49.759.2
1983Scott BrunnerNYG45.154.3
1982Joe FergusonBUF49.656.3
1981Vince EvansCHI44.951.1
1980Phil SimmsNYG51.858.9
1979Doug WilliamsTAM48.852.5
1978Steve DeBergSFO41.740.0
1977Joe PisarcikNYG47.842.3
1976Gary MarangiBUF30.430.8
1975Archie ManningNOR45.144.3
1974Mike PhippsCLE49.246.7
1973Norm SneadNYG47.745.8
1972Jim PlunkettNWE46.045.7
1971Bobby DouglassCHI41.537.0
1970Terry BradshawPIT32.730.4

What you might notice in addition to a few Super Bowl winning quarterbacks on the list, is that Vinny Testaverde is the only one on there twice. [Editor’s note: Jeff Kemp actually finished with the worst passer rating of any QB in 1991.] Testaverde has 38 points of bad Gray Ink — i.e., if you assign 10 points to a last-place finish, 9 points to a second-to-last place finish, 8 points to a third-from-the-bottom spot, and so on. He ranked last in ’88 (10 points), second-to-last in ’91 (9 points), 5th-from-the-bottom in ’89 (+6), 7th from last in ’00 (+4), 8th from the bottom in ’04 and ’94 (+6), 9th from the bottom in ’92 (+2), and 10th from last in ’01 (+1), for a total of 39 points.

That’s the most of any quarterback since 1970, narrowly edging out well, a few other names that I doubt will surprise you.

QuarterbackGray Ink
Vinny Testaverde38
Jake Plummer33
Dan Pastorini32
Archie Manning32
Marc Wilson31
Mike Phipps31
Kerry Collins29
Jim Hart28
Joey Harrington28
Mark Malone27
Joe Ferguson27
Jay Schroeder26
Troy Aikman26
Richard Todd25
Rick Mirer25
Jim Everett25
Ryan Fitzpatrick24
Kordell Stewart24
Kyle Boller22
Billy Joe Tolliver22
Matt Hasselbeck21
Mark Sanchez21
Randy Wright21
Jim Zorn21
Bobby Douglass21
Boomer Esiason20
Jim Plunkett20
Drew Bledsoe19
Trent Dilfer19
Derek Anderson19
Ryan Leaf19
Joe Pisarcik19
Joe Flacco18
Brett Favre18
Tony Banks17
Warren Moon17
Chad Henne17
Marc Bulger17
Steve DeBerg17
Terry Bradshaw17
Bob Avellini17
Craig Whelihan17
Joe Namath17
Eli Manning16
Gus Frerotte16
Blaine Gabbert16
Rex Grossman16
Blake Bortles16
Geno Smith16
Vince Evans16
Josh McCown15
Lynn Dickey15
Paul McDonald15

What stands out to you?

{ 0 comments }

On Thursday, I posted a methodology to determine which wide receivers played on the most pass-happy teams, and yesterday, I posted another method of examining the same concept. Today, we will use the same approach to measure which receivers played in the most efficient passing offenses.

Efficiency is defined using Relative ANY/A, which is Team ANY/A minus League Average ANY/A. Let’s use Jerry Rice as an example. You will not be surprised to see that he generally played on very efficient passing offenses.  In 1995, Rice had 1,848 receiving yards, which was 8.1% of his career receiving yardage.  The 1995 49ers had a Relative ANY/A of +1.19 which means 8.1% of Rice’s career RANY/A grade is going to have a weight of +1.19.  Do this calculation for every season of his career, and you see that Rice had a career RANY/A of +1.57.

The table below shows the career RANY/A grades for all receivers with at least 5,000 receiving yards:

RkReceiverRec YdFirst YrLast YrRANY/AHOF
13Jerry Rice22895198520041.57Yes
62Terrell Owens15934199620100.82Yes
234Larry Fitzgerald1554520042017-0.21Likely
34Randy Moss15292199820121.18Yes
118Isaac Bruce15208199420090.38No
102Tony Gonzalez15127199720130.52Likely
112Tim Brown14934198820040.41Yes
220Steve Smith1473120012016-0.12Not El.
16Marvin Harrison14580199620081.51Yes
28Reggie Wayne14345200120141.34Not El.
169Andre Johnson14185200320160.14Not El.
168James Lofton14004197819930.14Yes
101Cris Carter13899198720020.54Yes
197Anquan Boldin13779200320160.03Not El.
145Henry Ellard13777198319980.24No
95Torry Holt13382199920090.56No
128Andre Reed13198198520000.34Yes
151Steve Largent13089197619890.21Yes
207Irving Fryar1278519842000-0.05No
85Art Monk12721198019950.63Yes
83Jason Witten12448200320170.64Not El.
103Jimmy Smith12287199520050.51No
209Brandon Marshall1221520062017-0.06Not El.
50Charlie Joiner12146196919860.95Yes
111Hines Ward12083199820110.42No
136Derrick Mason12061199720110.29No
61Michael Irvin11904198819990.83Yes
164Don Maynard11834195819730.16Yes
232Calvin Johnson1161920072015-0.18Likely
39Antonio Gates11508200320171.11Not El.
228Muhsin Muhammad1143819962009-0.15No
68Rod Smith11389199520060.77No
91Keenan McCardell11373199220070.61No
154Chad Johnson11059200120110.19No
256Joey Galloway1095019952010-0.45No
119Roddy White10863200520150.37Not El.
66Gary Clark10856198519950.78No
131Stanley Morgan10716197719900.32No
203Keyshawn Johnson1057119962006-0.02No
93Harold Jackson10372196919830.57No
137Santana Moss10283200120140.29Not El.
38Lance Alworth10266196219721.11Yes
141Andre Rison10205198920000.27No
63Donald Driver10137199920120.81No
120Shannon Sharpe10060199020030.37Yes
217Eric Moulds999519962007-0.08No
12Wes Welker9924200520151.63Not El.
70Antonio Brown9910201020170.77Likely
139Drew Hill9831197919930.28No
21Marques Colston9759200620151.39Not El.
213Amani Toomer949719962008-0.07No
80DeSean Jackson9487200820170.66Not El.
264Rob Moore936819901999-0.57No
19Raymond Berry9275195519671.48Yes
176Herman Moore9174199120010.1No
233Anthony Miller914819881997-0.19No
30Charley Taylor9110196419771.28Yes
89Vincent Jackson9080200520160.62Not El.
155Tony Martin9065199020010.19No
54Julio Jones9054201120170.91Likely
138Harold Carmichael8985197119840.29No
11Mark Clayton8974198319931.63No
35Fred Biletnikoff8974196519781.18Yes
49Wes Chandler8966197819880.95No
206Roy Green896519791992-0.03No
214Ricky Proehl887819902006-0.07No
9Mark Duper8869198319921.74No
156Terry Glenn8823199620060.19No
153Terance Mathis8809199020020.19No
278Mark Carrier876319871998-0.87No
130Joe Horn8744199620070.32No
105John Stallworth8723197419870.46Yes
167Johnnie Morton8719199420050.14No
92Cliff Branch8685197219840.61No
79Demaryius Thomas8653201020170.66Not El.
252Laveranues Coles860920002009-0.39No
23Paul Warfield8565196419771.37Yes
187Plaxico Burress8499200020120.06No
170Billy Howton8459195219630.14No
100Tommy McDonald8410195719680.54Yes
116Eddie Kennison8345199620070.38No
173Wesley Walker8306197719890.12No
46Greg Jennings8291200620151Not El.
160Carroll Dale8277196019730.18No
225Curtis Conway823019932004-0.15No
133Ernest Givins8215198619950.31No
152A.J. Green8213201120170.2Not El.
245Jeff Graham817219912001-0.3No
165Eric Martin8161198519940.16No
235Sterling Sharpe813419881994-0.22No
195Webster Slaughter8111198619980.04No
263Haven Moses809119681981-0.56No
198Mike Wallace8072200920170.02Not El.
243Art Powell804619601968-0.29No
261Bill Brooks800119861996-0.51No
4Don Hutson7991193519452.24Yes
71Tony Hill7988197719860.77No
158Ozzie Newsome7980197819900.19Yes
45Bobby Mitchell7954195819681.01Yes
182Jackie Smith7918196319770.07Yes
22Jimmy Orr7914195819701.38No
15Jordy Nelson7848200820171.54Not El.
17Drew Pearson7822197319831.49No
159Bobby Engram7751199620090.19No
175Anthony Carter7733198519940.11No
250Chris Chambers764820012010-0.34No
276Brian Blades762019881998-0.86No
140Pierre Garcon7568200820170.27Not El.
230Greg Olsen755620072017-0.16Not El.
36Nat Moore7546197419861.16No
190Roy Jefferson7539196519760.06No
106Gary Garrison7538196619770.45No
72Dez Bryant7459201020170.76Not El.
57Ed McCaffrey7422199120030.86No
20Bob Hayes7414196519751.42Yes
87Pete Retzlaff7412195619660.63No
204Wayne Chrebet736519952005-0.02No
56Otis Taylor7306196519740.88No
40Boyd Dowler7270195919711.1No
53Antonio Freeman7251199520030.91No
212T.J. Houshmandzadeh723720012011-0.07No
273Dwayne Bowe720820072015-0.75Not El.
283Lionel Taylor719519601968-1.63No
14Rob Gronkowski7179201020171.55Likely
199Darrell Jackson7132200020080No
222Carl Pickens712919922000-0.12No
269Ken Burrough710219701981-0.68No
52Isaac Curtis7101197319840.92No
201Vernon Davis707220062017-0.01Not El.
178Reggie Rucker7065197019810.09No
81John Gilliam7056196719770.65No
7Elroy Hirsch7029194619571.86Yes
184Shawn Jefferson7023199120030.07No
229Pat Tilley700519761986-0.16No
97Jake Reed6999199220020.55No
255J.T. Smith697419791990-0.44No
110Derrick Alexander6971199420020.43No
224Nate Washington695420062015-0.15Not El.
51Marshall Faulk6875199420050.93Yes
144Michael Crabtree6870200920170.25Not El.
104Gene Washington6856196919790.46No
177Jeremy Maclin6835200920170.09Not El.
180Ahmad Rashad6831197219820.08No
200T.Y. Hilton6827201220170Not El.
77Charley Hennigan6823196019660.7No
32Jimmy Graham6800201020171.23Not El.
248Larry Centers679719912003-0.32No
27Dwight Clark6750197919871.34No
281Frank Sanders674919952003-0.91No
37Kellen Winslow6741197919871.16Yes
142Frank Lewis6724197119830.27No
282Marty Booker670319992009-0.92No
33Cris Collinsworth6698198119881.21No
67Deion Branch6644200220120.78No
74Mel Gray6644197119820.74No
171Willie Gault6635198319930.13No
259Jerricho Cotchery662320042015-0.48Not El.
188Al Toon6605198519920.06No
147Brett Perriman6589198819970.24No
143Michael Haynes6588198819970.25No
73Heath Miller6569200520150.74Not El.
236Henry Marshall654519761987-0.24No
2Dante Lavelli6488194619563.13Yes
75Ricky Sanders6477198619950.72No
44Del Shofner6470195819671.04No
254Mike Quick646419821990-0.41No
216Quinn Early644819881999-0.08No
109Golden Tate6419201020170.43Not El.
183Sammy White6400197619850.07No
231Ike Hilliard639719972008-0.17No
210Carlos Carson637219801989-0.06No
134Troy Brown6366199320060.31No
96Max McGee6346195419670.56No
161Stephone Paige6341198319910.17No
114Haywood Jeffires6334198719960.4No
185Steve Jordan6307198219940.07No
227Sean Dawkins629119932001-0.15No
246Alfred Jenkins626719751983-0.32No
240Darnay Scott619319942002-0.27No
174Emmanuel Sanders6156201020170.12Not El.
135Jeremy Shockey6143200220110.3No
31Eddie Brown6134198519911.25No
215Steve Watson611219791987-0.08No
202Ronnie Harmon607619861997-0.02No
266Red Phillips604419581967-0.62No
10Lenny Moore6039195619671.66Yes
192Santonio Holmes6030200620140.06Not El.
258Louis Lipps601919841992-0.46No
60Jack Snow6012196519750.84No
272Lee Evans600820042011-0.72No
223Sonny Randle599619591968-0.12No
247Brandon Lloyd598920032014-0.32Not El.
88Doug Baldwin5945201120170.62Not El.
211Bobby Joe Conrad590219591969-0.06No
179Billy Wilson5902195119600.09No
208Todd Christensen587219811988-0.05No
257Todd Heap586920012012-0.46No
268DeAndre Hopkins586520132017-0.64Not El.
47James Jones5861200720150.98Not El.
267Jessie Hester585019851995-0.62No
55Freddie Solomon5846197519850.88No
98Eric Decker5816201020170.54Not El.
76Mike Ditka5812196119720.71Yes
150Riley Odoms5755197219830.21No
244Roy Williams571520042011-0.29No
58John Jefferson5714197819850.86No
262Gail Cogdill569619601970-0.52No
172Vance Johnson5695198519950.13No
218Jabar Gaffney569020022012-0.1No
260Danny Abramowicz568619671974-0.49No
271Antonio Bryant568520022009-0.71No
29Dallas Clark5665200320131.33Not El.
108Owen Daniels5661200620150.44Not El.
121Keith Byars5661198619980.36No
84Nate Burleson5630200320130.64Not El.
251Delanie Walker562120062017-0.37Not El.
125Dave Parks5619196419730.35No
82Pete Pihos5619194719550.65Yes
1Mac Speedie5602194619523.48No
3John Taylor5598198719952.25No
194Eric Metcalf5572198920010.04No
226Ben Coates555519912000-0.15No
181Mark Jackson5551198619940.07No
43Malcom Floyd5550200420151.05Not El.
279Braylon Edwards552220052012-0.87No
249Rich Caster551519701981-0.34No
5Ray Renfro5508195219632.05No
59Chris Burford5505196019670.85No
270Chris Calloway549719902000-0.7No
26Jerry Smith5496196519771.35No
123Ben Watson5485200420170.35Not El.
41Lynn Swann5462197419821.07Yes
193Reggie Langhorne5446198519930.06No
117Bernie Casey5444196119680.38No
122Buddy Dial5436195919660.36No
25Frank Gifford5434195219641.35Yes
157Frank Clarke5426195719670.19No
205Bob Tucker542119701980-0.03No
196Marcus Allen5411198219970.03Yes
8Tom Fears5397194819561.81Yes
115Michael Jackson5393199119980.4No
274Gary Ballman536619631973-0.84No
126Bobby Walston5363195119620.34No
238Fred Barnett536219901997-0.25No
86Flipper Anderson5357198819950.63No
24Brandon Stokley5339199920131.35Not El.
148Alshon Jeffery5338201220170.24Not El.
48Gary Collins5299196219710.97No
241Rocket Ismail529519932001-0.27No
265Elbert Dubenion529419601967-0.58No
191Wesley Walls5291198920030.06No
94Keith Jackson5283198819960.57No
242Peerless Price528119992007-0.28No
69Miles Austin5273200720150.77Not El.
166Brandon LaFell5263201020170.15Not El.
65Russ Francis5262197519880.79No
253Bob Chandler524319711981-0.4No
275Kellen Winslow523620042013-0.85Not El.
18John Mackey5236196319721.49Yes
237Hugh Taylor523319471954-0.24No
162Dave Casper5216197419840.17Yes
127Tim McGee5203198619940.34No
6Brent Jones5195198719972No
124Mike Pritchard5187199119990.35No
221Tiki Barber518319972006-0.12No
186Kevin House5169198019870.07No
42Randall Cobb5141201120171.06Not El.
239Qadry Ismail513719932002-0.26No
280Kenny Britt513720092017-0.88Not El.
277Elbie Nickel513119471957-0.87No
113Frank Wycheck5126199320030.41No
149Charle Young5106197319850.21No
163Mickey Shuler5100197819910.16No
219Jimmie Giles508419771989-0.11No
99Hakeem Nicks5081200920150.54Not El.
129Yancey Thigpen5081199220000.33No
78O.J. McDuffie5074199320000.67No
132Ted Ginn5072200720170.32Not El.
90Roger Carr5071197419830.61No
107Johnny Morris5059195819670.45No
146Duriel Harris5055197619850.24No
64Raymond Chester5013197019810.8No
189Jim Colclough5001196019680.06No

None of the Hall of Fame receivers have negative RANY/A grades, although Larry Fitzgerald and Calvin Johnson will probably change that.

Here’s a look at the 23 receivers with 8,000 career receiving yards and played on below-average passing teams:

RkReceiverRec YdFirst YrLast YrRANY/AHOF
234Larry Fitzgerald1554520042017-0.21Likely
220Steve Smith1473120012016-0.12Not El.
207Irving Fryar1278519842000-0.05No
209Brandon Marshall1221520062017-0.06Not El.
232Calvin Johnson1161920072015-0.18Likely
228Muhsin Muhammad1143819962009-0.15No
256Joey Galloway1095019952010-0.45No
203Keyshawn Johnson1057119962006-0.02No
217Eric Moulds999519962007-0.08No
213Amani Toomer949719962008-0.07No
264Rob Moore936819901999-0.57No
233Anthony Miller914819881997-0.19No
206Roy Green896519791992-0.03No
214Ricky Proehl887819902006-0.07No
278Mark Carrier876319871998-0.87No
252Laveranues Coles860920002009-0.39No
225Curtis Conway823019932004-0.15No
245Jeff Graham817219912001-0.3No
235Sterling Sharpe813419881994-0.22No
263Haven Moses809119681981-0.56No
243Art Powell804619601968-0.29No
261Bill Brooks800119861996-0.51No

You will not be surprised to see Joey Galloway on there at -0.45, at least not if you have been paying attention.

{ 1 comment }

Running Back Heat Maps – 2017 Season

Two years ago, I looked at running back heat maps for the 2015 season; that was a fun article, so let’s update those numbers for 2017. This builds off of yesterday’s post about yards per carry.

Last season, Steelers running back Le’Veon Bell led the NFL in rushing attempts.  How did Bell fare? Well, he had a slightly below-average 4.02 yards per carry average, but that was due to a lack of big plays.  You may be as shocked as I was to learn that Bell didn’t have a single rush go for even 30 yards; his long of the year was a 27-yard rush against the Chiefs.  It’s hard to stand out in yards per carry without big runs, and Bell is a good example of how you can still be an effective runner without big gains.

Bell rushed for positive yards on 85% of his carries; that’s very good, because the average among all running backs with at least 100 carries was 80%.  In fact, Bell was 5% or 6% above average at gaining at least 1, 2, or 3 yards on all of his carries last year, and he was above average at gaining at lest 4, 5, 6, 7, 8, 9, or 10 yards.  And Bell gained at least 15+ yards on 4% of his carries, matching the league average. But Bell gained at least 20 yards on only 1% of his carries (and, of course, at least 30+ yards on 0% of his carries), compared to the league average of 2%.  That’s the only reason Bell comes in with a below-average YPC number from 2017.

In the picture below, I’ve listed all running backs with at least 100 carries. I have then shown how they fared at rushing for at least 1 yard, at least 2 yards, at least 3 yards,… at least 10 yards, at least 15+ yards, and at least 20+ yards. A blue shading is good: that means a player gained yards at a higher clip than average. A red shading is bad, even though this is a heat map, since I think it makes more sense to associate red with bad (if you don’t like the way my brain works, you can let me know in the comments). [continue reading…]

{ 1 comment }

Punting Value vs. Punting Skill, by Bryan Frye

Today’s post is from friend of the site Bryan Frye. You can view all of Bryan’s guest posts here, and follow him on twitter @LaverneusDingle. What follows are Bryan’s words, with minor editing from Chase.


Last month, I had a mini tweet storm about punting value versus punting skill, where I discussed punters, how to measure punting, and how to reconcile the apparent gap between value (as measure by expected points) and perceived skill. Today, I want to revisit some of my ideas, expand on them, and offer them for debate among the smart readers of this site. I know punting isn’t the most exciting topic, even for die hard football fans, but I used to punt in Pop Warner and have always been a bit of a punting aficionado.

Methodology

First, I gathered all punts from 2009-2017. Then, I removed those that came from non-punters. Next, I excluded blocked kicks, scoring plays, and turnovers, which are rare events that dramatically skew data and may not actually be indicative of a punter’s ability. I was left with 18,375 punts ripe for examination. [1]Ideally, we could include hang time in the equation to see if that proves to be a significant factor. Anecdotally, a team would prefer a 40 yard punt that spent 4.3 seconds in the air to a punt of … Continue reading

To try to assign expected value to punts from a given yard line, I looked at the Expected Points Added by all punts in the data set. [2]For EPA, I am using Ron Yurko’s version.  I then plotted yards from end zone (e.g., kicking from your own 20 is 80 yards from the end zone) against EPA and used a sextic function to find a best fit line for what our expectations should be for a punt from a particular yard line. [3]The function, for those interested: y = -0.000000000743805x6 + 0.000000263921778x5 – 0.000037400877394x4 + 0.00269765455x3 – 0.105061671689785x2 + 2.1744406183205x – 20.578738996142. … Continue reading

Punting Value Versus Punting Skill: In Theory

I tend to think of punters in two categories: coffin corner punters and distance punters. Coffin corner punters are known as technicians for their incredible ability to spot the ball seemingly wherever they want to. They are, based on my analysis pretty clearly the more skilled punters. Distance punters often put up big kicks because they play on bad teams that punt often from deep inside their own territory. They are seen as the brute force, unskilled bangers of the punting community. There are also guys like Johnny Hekker, who can do it all with aplomb, but special cases are exactly that – special. For most of my life, I have been on the side of the technicians and derided the big-legged guys who seem to lack control over their kicks. However, evidence suggests that, while the booming kicks may take less finesse, they may contribute more toward winning games.

Coffin corner kicks require a deft foot, but they also tend to produce less value from an EPA perspective. This is because the kicks often come from midfield or opponent territory, where EPA often advocates trying for a conversion or field goal. Punting sacrifices possession of the ball for field position, and because it is similar to a turnover, it is difficult to achieve a high EPA on any punt. This is especially true when teams opt to cede possession of the ball at the expense of a scoring opportunity. The red trend line on the chart below represents the expected point value of a punt from the corresponding yard line. Notice that the red line drops below zero inside of a team’s own 10 yard line and once a team reaches its own 45 yard line. This means EPA sees the idea of punting from within 55 yards from goal as an automatic negative, making it impossible for even the best punt to produce positive EPA in that situation. [4]With the exception of a muffed punt, but I haven’t seen any credible evidence suggesting forcing turnovers is a real punting skill and not just a product of chance. Also note that going for it from … Continue reading [continue reading…]

References

References
1 Ideally, we could include hang time in the equation to see if that proves to be a significant factor. Anecdotally, a team would prefer a 40 yard punt that spent 4.3 seconds in the air to a punt of equal distance that took only 3.6 seconds to land. It would be nice to test to see if that anecdote is founded in reality and not just a vague idea of “common sense” or whatever term people who prefer not to think too much call it. Unfortunately, I have only seen the Rams and Raiders consistently mention hang time in their game logs.
2 For EPA, I am using Ron Yurko’s version.
3 The function, for those interested: y = -0.000000000743805x6 + 0.000000263921778x5 – 0.000037400877394x4 + 0.00269765455x3 – 0.105061671689785x2 + 2.1744406183205x – 20.578738996142. Obviously, there’s no real reason to show this many significant digits, but I wanted to be sure to show clear differentiation in the small numbers. This function produced an R2 of 0.13.
4 With the exception of a muffed punt, but I haven’t seen any credible evidence suggesting forcing turnovers is a real punting skill and not just a product of chance. Also note that going for it from midfield can also be a negative EPA proposition, if the distance is long enough. In those cases, a team is left with picking the “less bad” option. So it’s not “never punt from inside the 50” as much as it is “think twice about punting from inside the 50.” In general, avoid nevers and alwayses. In the future, I plan to revisit this specific aspect of using EPA to judge punting and the coaching decision to punt.
{ 1 comment }

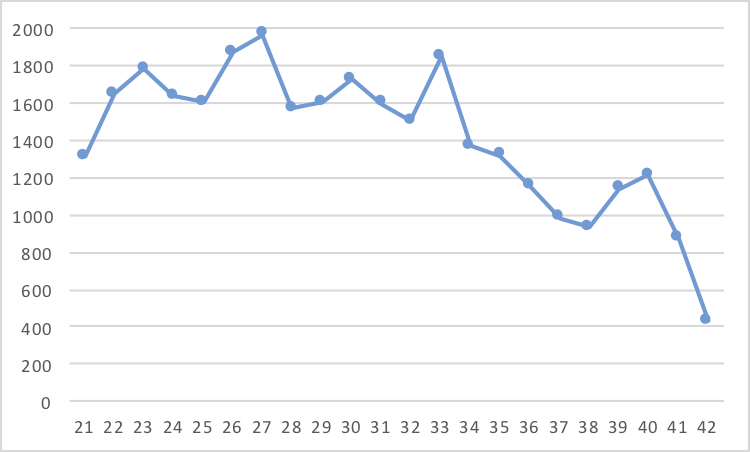
You probably know that Jerry Rice gained 1,139 receiving yards at age 39 with the Raiders in 2001, easily the most of any player at age 39. Only two other wide receivers (Charlie Joiner, 440 yards; Joey Galloway, 173 yards) gained any yards at all at age 39.

You probably know that the next year was Rice’s most remarkable feat. Nobody in NFL history other than Rice gained any yards at age 40 or later, but that year, Rice gained 1,211 yards in Oakland in 2002.

You probably also know that Rice didn’t stop there: he gained 869 yards in 2003 at the age of 41.

And you know that Rice also played at age 42, where he gained 429 yards.  By way of reference, Larry Fitzgerald will be 42 in 2025, by which point in time he may already have been in Canton for a year.

So yes, Rice gained more receiving yards at age 39, 40, 41, and 42 than anyone else in NFL history.  But you probably already knew that.  But did you know that three other times Rice gained more yards than anyone else at any age in NFL history?

Rice gained 1,499 yards in 1994 at age 32, the most in NFL history.  In fact, 1499 yards remains the most by by any player not named Rice at age 32 or older.

Rice then gained a whopping 1,848 receiving yards in 1995, at 33 years old, at the time an NFL record and still the most yards by any player older than 27 years of age.

Oh, and at 36, Rice picked up 1,157 receiving yards, the most of any player at that age, too.

So the single-season record holders in receiving yards at age 32, 33, 36, 39, 40, 41, and 42 are all Rice.

Only two other players hold the record for most receiving yards at age X for two different ages (no other player has done it for three).  Can you name them?  While you think about that, the graph below shows the receiving yards leaders by age:

[continue reading…]

{ 1 comment }

Former 49ers and Chiefs quarterback Alex Smith has a well-earned reputation for being overly conservative. Smith was known as a low-risk, low-reward passer for years: he avoided interceptions but took a ton of sacks and threw a lot of short, safe passes. In 2011 with the 49ers, he ranked 30th in average pass length; he didn’t have enough passes in 2012 to qualify, but in 2013 with the Chiefs, he ranked 36th in how far his average pass traveled. In 2014, he ranked 33rd, and he repeated that ranking in 2015. In 2016 he ranked 29th, before vaulting to 22nd last year.

From 2011 to 2017, Smith threw 43 interceptions but took an incredible 260 sacks! That means over the last seven seasons, Smith has been sacked over 6 times as often as he’d thrown an interception (6.05 to be precise). Among the 32 quarterbacks who have thrown the most passes since 2011, only three others have even a 4:1 sack:interception ratio. Two of them are two of the best quarterbacks in the NFL in Russell Wilson (4.4 to 1) and Aaron Rodgers (5.20 to 1).  And there are some extenuating circumstances in both cases.

Wilson has played behind terrible offensive lines and scrambles often, which inflates his sack rate. Rodgers has been arguably the best quarterback in the NFL over the last seven years and has a tiny interception rate, although taking too many sacks is a legitimate criticism of his game. But neither passer is a dink-and-dunk type: both rank in the top 8 in yards per completion since 2011 (Rodgers averaged 12.0 yards per completion, Wilson 12.2) while Smith ranked in the bottom 8 with an 11.2 average.

The fourth quarterback is Smith’s old teammate, Colin Kaepernick (5.70 to 1). Even as a young player, Kaepernick always took a lot of sacks, and like Wilson, his scrambling inflated his sack rate a bit. Kaepernick averaged 5.3 sacks for every interception in 2012, then 4.9 in 2013, 5.2 in 2014, 5.6 in 2015, before catapulting to 9.0 in 2016, a year that may have been influenced by his political stance. But even still, Kaepernick wasn’t really a great match for Smith because he averaged 12.1 yards per completion, the 6th-highest rate since 2012.

So over the last 7 years, it’s pretty clear that no quarterback embodied the risk-averse style of player quite like Smith. With a ton of sacks, not many interceptions, and a low yards per completion average, Smith was the most conservative passer in football.

But over the last three years, Tyrod Taylor has taken the crown. In fact, Taylor is more Alex Smith than even Alex Smith! I looked at the 32 quarterbacks with the most pass attempts since the start of the 2015 season. Among that group, Taylor ranks 2nd in interception rate at just 1.29%, but he also ranks last in sack rate at 9.1%! The scramble factor is an issue here — by scrambling when a play breaks down instead of throwing it away, Taylor’s sack rate isn’t quite as bad as it appears — but only two of the other 32 quarterbacks have a sack rate within even two percent of Taylor’s. [continue reading…]

{ 1 comment }

13 Points > 14 Points, Part IV

Over the last three days, I have been writing about the fact that points scored isn’t linearly correlated with winning percentage.  In fact, there are a few bumps, and it relates to field goals vs. touchdowns.  As we’ve learned:

  • Not only is scoring 13 points better than scoring 14 points, but scoring 9 points is better than 14 points.
  • This works for increments on 7, too: 16 is better than 21, 23 is better than 28, and 30 is better than 35, too.

What I thought was the next natural question: do yards and yards allowed follow a similar pattern?

The graph below shows, in blue, the average number of yards gained for teams based on their points scored (on the X-Axis).  In addition, in orange, I’ve shown the average number of yards allowed.  As before, I put a red dot (on the blue line) for 7, 14, 21, 28, 35, 42, 48, and 56 points.  And wouldn’t you know: there is, in fact, a small dip in yards gained at these levels: teams that score 13 points gain more yards than teams that score 14 points, and that holds true at 20/21, 27/28, 34/35, and 41/42. [continue reading…]

{ 2 comments }

Two years ago, I set a baseline for what a pre-season projection system should hope to accomplish. The simplest baseline of all would be to project each team to go 8-8. That would require no thought at all: a person could wake up 49 years and eight months from now and project each then-existing team in the NFL (or its successor league) to go .500 in the 2067 season. So any projection system has to beat that, at a minimum. As I wrote two years ago:

If you did that in every season from 1989 to 2014, your model would have been off by, on average, 2.48 wins per team. This is calculated by taking the absolute value of the difference between 0.500 and each team’s actual winning percentage, and multiplying that result by 16. So that should be the absolute floor for any projection model: you have to come closer than that.

Now, let’s flash back to July of this year. The USA Today published its preseason predictions in a rather provocative fashion, particularly with respect to two teams. I see a ton of preseason projections every year and forget them minutes later, so please forgive me if you feel like I am picking on the USA Today here. That is not the intent, and other publications have made more egregious errors but are not at my fingertips. But this publication picked the Patriots to go 16-0 and the Jets to go 1-15, which was rather extreme.

Upon further view of their predictions, many of them are pretty ugly. So I decided to compare those predictions to the “every team in the same” test, or the “8-8” system.

There were six teams the USA Today got really wrong, where an 8-8 projection would be at least 3.0 games closer to being accurate:

The Buffalo Bills are 8-7 (off of 0.500 by 0.5 wins); the USA Today predicted them to go 4-12 (off by 4.5 wins).
The Green Bay Packers are 7-8 (0.500 projection is off by 0.5); the USA Today predicted them to go 12-4 (off by 4.5).
The Los Angeles Rams are 11-4; an 8-8 projection would be off by 3.5 games, but the USA Today had the Rams are 4-12, off by 7.5 games.
The Oakland Raiders are 6-9 (off by 1.5); the USA Today had them at 11-5 (off by 4.5).
The Detroit Lions are 8-7 (off by 0.5); the USA Today had them at 5-11 (off by 3.5).
The Tennessee Titans are 8-7 (off by 0.5); the USA Today had them at 12-4 (off by 3.5).

You might say the loss of Aaron Rodgers shouldn’t be held against them, and that the Rams success caught everyone off guard. Both of those things are true, but we also know that superstars get hurt and surprise teams happen every year. Both of those facts should urge predictors to be more conservative in the aggregate.

The USA Today thought the Titans would be great and the Bills terrible; both are 8-7. And the USA Today had the Raiders at 11-5 and the Lions at 5-11; instead, Detroit has two more wins than Oakland. These, again, are signs that we shouldn’t be too overconfident in our preseason projections (a look at the Giants and the Rams projected wins totals would also work to that effect).

Now, there were also three teams where the USA Today beat the 8-8 system by at least 3 games.

The Indianapolis Colts were projected to go 5-11 by the USA Today; they are 3-12 (USAT off by 1.5, .500 prediction off by 4.5).
The Cleveland Browns were projected to go 4-12; they are 0-15 (USAT off by 3.5, .500 prediction off by 7.5).
The Pittsburgh Steelers were projected to go 12-4; they are 12-3 (USAT off by 0.5, .500 prediction off by 4.5).

In the case of the Colts, Browns, and Bears, predicting them to be bad — but not terrible — was the wise move. (That would have worked with the Jets, too: the 1-15 projection is now off by 4 or 5 wins, giving another win to the 8-8 system). The Steelers were projected to be very good, and that prediction was nailed. The USA Today even wins the Patriots bet as we stand right now (12-3 is closer to 16-0 than 8-8), but a more conservative approach would have been better.

Overall, the USA Today fared worse than the blind 8-8 system. The USA Today projections were closer than the 8-8 system for 13 teams. Meanwhile, the 8-8 system was closer on 15 teams, with four teams (Houston, Kansas City, Jacksonville, New Orleans) currently graded as ties. Take a look: [continue reading…]

{ 5 comments }

This year, teams are 126-51 when outrushing their opponents, for a 0.712 winning percentage. In the abstract, that doesn’t mean much, and I’ll take a historical look at this data tomorrow. But what about teams this year?

The 10-1 Eagles rank 2nd in rushing yards and 1st in rushing yards allowed, thanks to a dominant run defense and an offense that is usually playing with the lead. The Eagles have outrushed their opponents in 9 straight games, but in week 1 the Eagles beat Washington despite being outrushed 64-58, and in week 2, the Eagles lost to the Chiefs and were outrushed 112-107. The table below shows how often each team has outrushed its opponents this year: [continue reading…]

{ 1 comment }

One of the very first trivia questions posted at Football Perspective was about the first quarterback to lose 100 games as a starter. You might have thought that the answer was Archie Manning (35-101-3 career record), but he only had the worst record of all-time; he wasn’t the first to get to 100 losses (answer in the original post). (Actually, that post now appears to have been wrong. At some point since 2012, PFR has updated the career record of Norm Snead from 52-99-7 to 52-100-7. The extra start came in 1965, specifically this game against the Browns; five years ago, PFR had King Hill starting that game; now it had Snead — who went 0/1 — as the starter.

Well, last night, Archie’s son set another record. With the Giants loss to the Redskins on Thanksgiving, Eli Manning became the first quarterback in NFL history to lose 100 starts with a single team. The table below shows all quarterbacks with at least 70 losses with one team, through November 24, 2017: [continue reading…]

{ 4 comments }

Every year, I look at the least-conforming games in the NFL. What do I mean by least-conforming? Well, let’s use the Titans trip to Jacksonville in week 2 this season as an example. Tennessee has an SRS of -5.1 this year, while the Jaguars have an SRS of +9.3. Given that the game was in Jacksonville, we would expect the Titans to lose by 17.4 points, assuming 3 points for the home team. In reality, the Titans won by 21 points, a swing of 38.4 points! That was the “weirdest” game of the year.

The Titans were also in the second least-conforming game of the season. Facing a Deshaun Watson Texans team, the Titans traveled to Houston and lost by a whopping 43 points. The Texans — thanks in part, of course, to several non-Watson games — have an SRS of -0.4. So at home against Tennessee, we would have expected the aveage Texans team to win b 7.8 points, not 43 points. That difference of 35.2 was one of just three games where the difference between the actual result and expected result exceeded 30 points. [continue reading…]

{ 0 comments }

Rams kicker Greg Zuerlein has been outstanding this year. Consider:

  • He is 4/4 on kicks from 50+ yards this year. Kickers have made 72% of field goal attempts from that range this season, so the average kicker would have made 2.9 such field goals. As a result, Zuerlein has made 1.1 more 50+ yard kicks than the average kicker.
  • He is 9/9 on kicks from 40-49 yards. Kickers have made 79% of kicks from that range this season, so the average kicker would have made 7.1 of those 9 attempts. Therefore, he made 1.9 more field goals than an average kicker from that range.
  • He is 9/10 on kicks from 30-39 yards. Kickers have made 84% of such kicks this year, so an average kicker would have made 8.4 of his 9 attempts. As a result, Zuerlein has made 0.6 more field goals fro 30-39 yards than the average kicker.
  • From 0-19 yards he was 1/1, and from 20-29 yards, he is 5/5. All kickers have made all attempts form under 20 yards, so he gets no credit for that. And kickers have made 99% of kicks from 20-29 this season, so he gets credit for being .1 field goals made above average here.
  • Kickers have made 94.5% of extra points this year, while the Rams star is 31 of 31. Since the average kicker would have made 29.3 of 31 kicks, it means Zuerlein has made 1.7 more extra points than the average kicker.

Add it up, and Zuerlein has made 3.7 more field goals than the average kicker — worth 11.2 points — and 1.7 more extra points. That translates to 13.0 points above average, the most of any kicker in the NFL. In fact, other than Kansas City’s Harrison Butker, Zuerlein has added twice as much value as all other kickers this year. [continue reading…]

{ 3 comments }

Let’s get to the week 9 Game scripts! Yes, these are a week late: my apologies, as well, other topics wound up being covered last week.

The biggest stories of week 9 were the blowout wins by Los Angeles, Philadelphia, and New Orleans. The Rams and Saints followed that up with another pair of blowout wins in week 10, while the Eagles were on bye. But before turning to week 10, let’s review some of the biggest outliers from week nine.

In week 9, the Jets and Panthers were very run-heavy. Lest you forget, the Jets beat the Bills on Thursday night in week 9, and while quarterback Josh McCown did have 5 carries, the running backs combined for 36 carries, while McCown had just 21 attempts. The Jets blew out Buffalo, but consider that the Lions had a similar Game Script and passes on 50% of plays.

Carolina beat Atlanta in a close game where the Panthers trailed for most of the first half. Still, behind Cam Newton and his 9 carries, Carolina wound up passing just 25 times while running 38 times! That’s really run-heavy.

The full Game Scripts data below: [continue reading…]

{ 0 comments }

Yards per Play Statistics Through Eight Weeks

Through eight weeks, the Philadelphia Eagles have the best record in the NFL at 7-1. But it’s the Jacksonville Jaguars who have arguably been the most impressive team in the league this year on a per-play basis.

Jacksonville is averaging 6.42 net yards per pass play this year, which is simply passing yards (net of sack yards lost) divided by pass attempts (including sacks). That ranks 15th in the NFL, but more impressively, the Jaguars are allowing just 4.22 net yards per pass to opposing passers, easily the best rate in the NFL. Jacksonville also has a very weird rushing split: the Jaguars rank 1st in yards per carry (4.97) but last in yards per carry allowed (5.16).

The Eagles are much more balanced, though not necessarily more impressive: Philadelphia ranks 10th in NY/A, 15th in YPC, 14th in NY/A allowed, and 12th in YPC allowed. ((One reason the Eagles are 7-1: the team ranks 2nd in red zone percentage and 1st in goal-to-go percentage, which means Philadelphia has been able to convert those yards into points. The Eagles defense ranks 15th in both categories).

The table below shows the per play yardage statistics on both pass and rushing plays for each team’s offense and defense this year. It also shows the raw yardage margin per game. Finally, I calculated a grade for each team that places twice as much weight on the passing game as the rushing game. The grade column is simply (NY/A – Opp NY/A) *2 + (YPC – Opp YPC). As you can see, Jacksonville tops that category, in large part because of the team’s pass defense: [continue reading…]

{ 15 comments }

Two guys who were pretty good at picking up first downs.

On Monday, I provided some initial thoughts on the relative values of completion and passing first down percentage. Yesterday, I looked at the difference between the 1972 and 2017 Jets when it came to those two metrics, along with a breakdown of every team’s passing performance so far in 2017.

Since passing first down percentage — which is simply the number of passing first downs a team gained divided by their pass attempts (including sacks) — is so important, I wanted to present a list of the top teams in NFL history using this metric. My data on first downs goes back to 1950, and since then, the top three teams all have something in common: Peyton Manning. The 2004 Colts picked up a first down on a whopping 44% of passing plays, the most in league history. That team is followed by the 2013 Broncos and the 2006 Colts, and the 2016 Falcons and 1984 Dolphins round out the top five. Here’s how to read the table below, which shows the top 200 passing offenses by this metric. The 2004 Colts completed 67% of their passes, had a sack rate of 2.6%, and 67.4% of their completed passes went for first downs. The final column is what the table is sorted by: the percentage of pass plays that went for a first down.

The table below shows the top 200 teams by this metric: by defaut, it only lists the top 20, but the table is fully sortable and searchable. [continue reading…]

{ 15 comments }

I like trivia, and Chris Brown asked me a good question on twitter yesterday:

The game Brown was referencing was the Patriots performance against the Saints in week 2 of the 2017 season. Here was the receiving breakdown on the New England side:

 
Player Tm Pass Yd Rec Yd
Rob Gronkowski NWE 0 116
James White NWE 0 85
Chris Hogan NWE 0 78
Phillip Dorsett NWE 0 68
Rex Burkhead NWE 0 41
Brandin Cooks NWE 0 37
Dion Lewis NWE 0 11
James Develin NWE 0 6
Jacob Hollister NWE 0 5
Tom Brady NWE 447 0

Brady threw for 183 yards to his wide receivers (Hogan, Dorsett, and Cooks), 143 yards to running backs (White, Burkhead, Lewis, Develin) and 121 yards to his tight ends (Gronkowski and Hollister). So that means Brady threw for 400+ passing yards with just 40% of his passing yards coming from his wide receivers. [continue reading…]

{ 12 comments }

Week 1 Game Scripts (2017): Ravens Flip The Script

Two different Ravens running backs had more carries than Flacco had attempts in week one.

Last season, no team was more pass-happy than the Baltimore Ravens. Joe Flacco and the Ravens led the NFL in pass attempts along with both pass ratio and pass identity. Flacco threw at least 30 passes in every game last year. The Ravens threw 50 passes in a game they won 38-6 in a remarkable display of the team’s pass-only identity.

Well, in week 1 of the 2017 season, the Ravens threw just 18 times and on only 29.5% of all plays, both of which were league-lows. Terrance West and Javorius Allen combined for 40 carries, and while both players were on the team last year, clearly something has changed in Baltimore. The Jaguars and Bills also stood out as very run-heavy in week 1: Jacksonville spent the fourth pick on Leonard Fournette, so that makes a lot of sense, while the Bills are always run-heavy in the Tyrod Taylor/LeSean McCoy era.

On the Game Scripts notes: the Rams led the way with the best Game Script of week 1, courtesy of a blowout win over the Colts. And just two teams won with negative Game Scripts in the opening slate of games: the Chiefs and Lions both won by double digits, but were the only two teams to pull off fourth quarter comebacks. [continue reading…]

{ 6 comments }

Sometimes, the headlines speak for themselves. After last night — the Chargers lost when the potential game-tying field goal was blocked in the final second — Los Angeles nee San Diego has now lost 18 of its last 23 games decided by 8 or fewer points.

Query Results Table
Poin Poin Poin
Rk Tm Year Date
Time Opp Week G# Day Result OT PF PA PD
1 SDG 2017 2017-09-11 10:20 @ DEN 1 1 Mon L 21-24 21 24 -3
2 SDG 2016 2016-12-24 1:00 @ CLE 16 15 Sat L 17-20 17 20 -3
3 SDG 2016 2016-12-18 4:25 OAK 15 14 Sun L 16-19 16 19 -3
4 SDG 2016 2016-12-04 4:25 TAM 13 12 Sun L 21-28 21 28 -7
5 SDG 2016 2016-11-27 1:00 @ HOU 12 11 Sun W 21-13 21 13 8
6 SDG 2016 2016-11-13 4:05 MIA 10 10 Sun L 24-31 24 31 -7
7 SDG 2016 2016-11-06 4:25 TEN 9 9 Sun W 43-35 43 35 8
8 SDG 2016 2016-10-30 4:05 @ DEN 8 8 Sun L 19-27 19 27 -8
9 SDG 2016 2016-10-23 4:05 @ ATL 7 7 Sun W 33-30 OT 33 30 3
10 SDG 2016 2016-10-13 8:25 DEN 6 6 Thu W 21-13 21 13 8
11 SDG 2016 2016-10-09 4:25 @ OAK 5 5 Sun L 31-34 31 34 -3
12 SDG 2016 2016-10-02 4:25 NOR 4 4 Sun L 34-35 34 35 -1
13 SDG 2016 2016-09-25 4:25 @ IND 3 3 Sun L 22-26 22 26 -4
14 SDG 2016 2016-09-11 1:05 @ KAN 1 1 Sun L 27-33 OT 27 33 -6
15 SDG 2015 2016-01-03 4:25 @ DEN 17 16 Sun L 20-27 20 27 -7
16 SDG 2015 2015-12-24 8:26 @ OAK 16 15 Thu L 20-23 OT 20 23 -3
17 SDG 2015 2015-12-13 1:03 @ KAN 14 13 Sun L 3-10 3 10 -7
18 SDG 2015 2015-11-29 1:03 @ JAX 12 11 Sun W 31-25 31 25 6
19 SDG 2015 2015-11-09 8:30 CHI 9 9 Mon L 19-22 19 22 -3
20 SDG 2015 2015-11-01 1:02 @ BAL 8 8 Sun L 26-29 26 29 -3
21 SDG 2015 2015-10-25 4:05 OAK 7 7 Sun L 29-37 29 37 -8
22 SDG 2015 2015-10-18 4:25 @ GNB 6 6 Sun L 20-27 20 27 -7
23 SDG 2015 2015-10-12 8:30 PIT 5 5 Mon L 20-24 20 24 -4

For his career, Philip Rivers has a 54-26 record in games decided by more than 8 points, and a 43-54 record in games decided by 8 or fewer points. Read differently, Rivers has lost 28 *more* times in close games than in non-close games. That is (for now) tied with Rich Gannon for the largest spread ever. [continue reading…]

{ 16 comments }

Sacks Are Coming From Lighter Players

In 1994, the “average” sack came from a player that weighted 266 pounds. Wait, what do you mean by average sack? Well, if you look at all 937 sacks in 1994, and identify the weight of the sacker on each sack, you can calculate the weight of the average sack in each season. John Randle was 290 pounds, and he had 13.5 sacks that year, so he gets 13.5 times as much weight a player with one sack. The graph below shows the weight of the player producing an average sack in each year since 1982. As you can see, it peaked in the mid-’90s, and has declined slightly since.

However, players in general are getting heavier, including in the front seven. The graph below shows the average weight of a player in the front 7 — weighted by the number of starts by such a player — for each year since 1982. That data is in orange; the blue line showing the average sack weight is still included in the chart for reference.
[continue reading…]

{ 3 comments }

In 1998, Randall Cunningham may have been the best quarterback in football.  Cunningham was 35.4 years old as of September 1st of that season. If it wasn’t Cunningham, it was probably Vinny Testaverde (34.8 years old as of 9/1/98), or  Steve Young (36.9), or Chris Chandler (32.9), or John Elway (38.2).  Troy Aikman (31.8) and Doug Flutie (35.9) also had great seasons, three other quarterbacks — Dan Marino (37.0),  Steve Beuerlein (33.5), and Rich Gannon (32.7) — finished in the top 20 in passing yards.

That means 10 of the top 20 quarterbacks in passing yards in 1998 were 31.8 years old or older as of September 1st of that year.    Thirteen years later, things were very different, as 8 of the top 16 passers in 2011 by passing yards were under 28 years old as of September 1st, with four being under 25: Cam Newton (22.3), Matthew Stafford (23.6), Josh Freeman (23.6), Andy Dalton (23.8), Mark Sanchez (24.8), Matt Ryan (26.3), Joe Flacco (26.6), and Aaron Rodgers (27.7).

I calculated the average age of quarterbacks in the NFL for each season since 1950, using the methodology described here. The short version: calculate what percentage of league-wide passing yards was produced by each player, calculate that player’s age as of September 1st of that season, and that calculate the league-wide age of all passers, weighted by their percentage of league passing yards. The results below: [continue reading…]

{ 10 comments }

Inexperienced Receiving Games

The 2008 Giants were very experienced; the 2009 Giants were not.

In ’08, New York had Amani Toomer and Plaxico Burress as the team’s starting receivers; Toomer retired after the year, while Burress shot himself in a nightclub late in the ’08 season and missed all of the ’09 and ’10 seasons.

The top 7 receivers on the ’09 Giants were the other Steve Smith (24 years old in ’09), Mario Manningham (23), Hakeem Nicks (21), Kevin Boss (25), Ahmad Bradshaw (23), Domenik Hixon (25), and Brandon Jacobs (27). Entering the 2009 season, Smith had 637 career receiving yards, Manningham had 26, Nicks had 0, Boss had 502, Bradshaw had 54, Hixon had 601, and Jacobs had 359.  Derek Hagan, who finished 8th on the ’09 Giants with 101 receiving yards, was the most accomplished receiver entering the year by virtue of his 645 career receiving yards entering 2009.

On a weighted average, that means the 2009 Giants receiving group entered the year with just 318 career receiving yards (by reference, the 2008 Giants were at 2,608). What do I mean by weighted average? Well, Smith had 28.7% of the 2009 Giants receiving yards, and he had 637 career receiving yards prior to 2009; therefore, his 637 receives 28.7% of the team weight. On the other hand, Manningham and Nicks had, together, 38% of the Giants receiving yards in 2009, and they had, together, just 26 career receiving yards entering 2009. The table below shows the full calculation, with the result equaling a weighted average of 318 career receiving yards. [continue reading…]

{ 7 comments }

The GOAT

Jerry Rice was really, really good for many, many reasons.  Here’s one: he led his teams in receiving yards a whopping 15 times in his career.  In 1985, Roger Craig led the 49ers in receiving yards during Rice’s rookie season. Then, from ’86 to ’96, Rice led San Francisco in receiving yards every season.  In 1997, Rice tore his ACL and was limited to just two games; as a result, Terrell Owens led the team in receiving.  In ’98 and ’99, though, it was Rice again who led the 49ers in receiving yards, before a 27-year-old Owens outgained a 38-year-old Rice on the ’00 49ers.

In 2001, Rice was in Oakland, and a 35-year-old Tim Brown beat Rice by 26 receiving yards (1165-1139) to lead the Raiders in receiving. But in 2002 and 2003, Rice — at 40 and 41 years of age — led Oakland in receiving. So from 1986 to 2003, Rice led his team in receiving yards in 15 of 18 seasons, with the exceptions being due to a torn ACL, losing out to a future Hall of Famer 11 years his junior, and losing out to a Hall of Famer 4 years his junior by 26 yards. That’s why he’s the greatest of all time.

But Henry Ellard was pretty darn good, too. Ellard played for 16 seasons in the NFL, and other than his rookie season and his final two seasons, he led his team in receiving yards every other year of his career.   During the prime years of Jim Everett’s career — 1988 to 1990 — Ellard ranked 1st, 1st, and 2nd in the league in receiving yards per game.  But he still led the Rams in receiving yards the other years, too, finishing as the leader receiver on Los Angeles each year from ’84 to ’93.  When Ellard joined the Redskins in ’94, he eclipsed the 1,000 yards mark and led Washington in receiving in ’94, ’95, and ’96.  In the process, Ellard became the first and only player to lead his team in receiving yards in 13 straight seasons. [continue reading…]

{ 36 comments }

Brown continues to dominate the NFL.

Antonio Brown averaged “only” 12.1 yards per reception last year, although his great reception, receiving yards, and receiving touchdown totals earned him a third straight first-team All-Pro selection. If Brown wasn’t so good and just 28 years old, you might look at that average and think Brown was on the decline or at least was becoming less of a big play threat.

But that’s not really true: with 22 receptions (in 15 games) of at least 20+ yards, Brown had the third most big plays of any receiver last year, and 21% of his catches went for at least 20 yards. What really hurt Brown’s average was that he also caught a ton of short passes: he had 57 receptions of 10 or fewer yards. Kelvin Benjamin caught 63 passes for 941 yards last year, a 14.9 yards per reception average. But while that sounds good, Benjamin only caught 10 passes — or 16% of his total — for 20+ yards. How did Benjamin average nearly three more yards per catch than Brown? You probably already figured this one out: just 20 of his receptions (32%) went for 10 or fewer yards. Either Benjamin wasn’t running short routes or he wasn’t catching passes on those routes. If it’s the latter, it’s a bad thing; if it’s the former, well, it’s also a bad thing (relative to Brown, at least) that all he was doing was running long routes and Brown still caught more long balls than him!

The graph below shows the top 100 wide receivers and tight ends in receiving yards last season, sorted by number of 20+ yard receptions. In addition, I have included the percent of their receptions that went for 20+ yards, the number of receptions that went for 10 or fewer yards, and that percent as well.
[continue reading…]

{ 10 comments }

We know that Amari Cooper is a better receiver than Kenny Stills, but who is the better big play threat? Or, more specifically, who was the better big play threat last year?


To answer this question, most people would focus on one metric: yards per reception. Most people are wrong. [continue reading…]

{ 9 comments }

Gray Ink For Percentage of Team Receiving

On Thursday, I presented a new way to look at wide receivers, focusing on both how the receiver dominated his teammates (i.e., by getting a large share of the pie) and how much his offense dominated the league (i.e., how much better/worse than average his team’s passing attack was).

Since I presented the full dataset covering the years from 1970 to 2016, I thought we might as well use that information in other ways. For example, let’s say you typed Steve Largent into the search box on that post.  You would see that Largent was a monster when it came to dominating his teammates: in 1978, he was responsible for 33.6% of the Seahawks Adjusted Catch Yards, which ranked 3rd in the league.  In five years — 1980, 1981, 1983, 1986, and 1987 — he ranked 4th in the NFL in percentage of team ACY.  In ’85, he ranked 5th, and in ’79 and ’84, he ranked 6th.  That’s remarkable:

If you calculate his gray ink – which means giving him 10 points for a 1st place finish, 9 for a 2nd place finish, and so on, he had 59 points of gray ink in this category.  Remember, % of Team ACY is simply a measure of what percentage of the pie each receiver was able to devour, and % of Team ACY Rk shows where they rank in the league in a given season.  I would never use this as the only way to rank a receiver (more on this in a second), but it is an interesting way. Why?

Receiving production is based on a lot of things outside of a wide receiver’s control — for example, how good his quarterback is, or how often his team passes.  But this isolates that by only comparing how the receiver fared compared to his teammates.  That’s why I like to use this as a check against other metrics.  Below shows the leaders in gray ink in this category since 1970.  Largent, as you can see, ranks 2nd because you always know who is going to rank 1st: [continue reading…]

{ 9 comments }

I spent some time discussing Gary Clark’s 1991 season yesterday. It was really impressive in two notable respects: he accounted for a huge percentage of his team’s production, and his team’s production was easily the best in the league.

What was even more impressive? What Gene Washington did in 1970. That year, the 49ers had a phenomenal passing attack: San Francisco averaged 7.6 ANY/A, while no other team was above 6.0. John Brodie was the AP MVP because of his great passing numbers, but what was arguably more impressive is what Washington did that year. Playing for the best passing offense in football [1]And along with the ’66 Packers, the only offenses to average at least 7.50 ANY/A from 1961 to 1975., Washington caught 23% of the team’s passes, 37% of the 49ers receiving yards, and 48% of San Francisco’s receiving touchdowns.

If you calculate Adjusted Catch Yards with a 5-yard bonus on receptions and a 20-yard bonus on touchdowns, Washington had 1,605 ACY out of the 49ers 4,620 total team ACY, or 35%. That’s even higher than what Clark did on the ’91 Redskins (33%). On the other hand, WR1s tended to get slightly more attention on 1970 offenses than on 1971 offenses. So here’s what I did:

1) Calculate the ACY for each receiver on each team since 1970. For Clark in ’91, this was 1,890.

2) Calculate the percentage of team ACY for each receiving season since 1970. For Clark, this was 33%; for Washington, it was 35%.

3) Calculate the average percentage of team ACY for the top N receivers in the league each season, with N being equal to the number of teams in the NFL. For 1970, this was 29%; for 1991, it was 27%.

4) Calculate each receiver’s percent over average; for both Clark and Washington, this means +6%.

5) Calculate each receiver’s team RANY/A for each year. Clark’s Redskins were at +3.14, while Washington’s 49ers were at +3.45.

6) Plot those seasons in the graph below. [continue reading…]

References

References
1 And along with the ’66 Packers, the only offenses to average at least 7.50 ANY/A from 1961 to 1975.
{ 3 comments }
Next Posts Previous Posts