≡ Menu

Anyone who has spent any time studying football analytics knows one truth: teams are not aggressive enough on fourth down. For example, in situation-neutral contexts, it’s always advisable to go for it on 4th-and-1. The value of possession has become increasingly important in the modern game, where offenses are so adept at gaining yards and scoring points, and the likelihood of conversion is so high that the trade-off of 40-50 yards of field position for a chance to keep possession is almost always worth it. Possession, after all, is worth about 4 points: if having 1st-and-10 at the 50 yard line is worth 2 points, then being on defense in that situation is worth -2, making the swing between having the ball and not having the ball worth 4 points.

So are NFL teams becoming smarter when it comes to 4th down decision making? I looked at all 4th-and-1 plays since 1994 that (i) came in the first three quarters, (ii) with the offense between the 40s, and (iii) with the team on offense either leading or trailing by no more than 10 points. From 1994 to 2004, teams went for it on these 4th-and-1 situations about 28% of the time. Then, from ’05 to 2014, teams went for it 35% of the time. But over the last two years, offenses have stayed on the field for these fourth downs over 40% of the time both years. Take a look: [continue reading…]

{ 14 comments }

Leaders in Percentage of Team Targets

On Friday, I wrote about Rob Moore’s 1997 season, when he set the still-standing record for targets in a year. Moore had 208 targets, but as alluded to in that post, he did not set the record for percentage of team targets in a season, which is simply targets divided by team pass attempts (excluding sacks).

That honor belongs to Brandon Marshall, who was targeted on 40% of all passes for the 2012 Bears, and wound up with a post-1978 record 46% of the Bears receiving yards that year.  Remarkably, Marshall saw over 30% of his team’s targets on three different teams, and saw 29% of a fourth franchise’s targets in a season (2015 Jets). The table below shows all players since 1992 with at least 30% (okay, 29.5%) of their team’s targets in a season:

[continue reading…]

{ 6 comments }

Not Rob Moore

If you find yourself talking about Rob Moore in the summer of 2017, it’s probably for one of four reasons.

1) You are a diehard Jets or Cardinals fan choosing to reminisce about Boomer Esiason and the halcyon days of the ’90s.

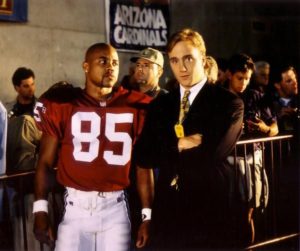
2) You just finished watching Jerry Maguire. That movie, which was released in December 1996, saw Cuba Gooding Jr. play the role of Rod Tidwell. Gooding’s character wore 85 and played wide receiver for the Arizona Cardinals, just like Moore (who even had a bit role in the movie, playing himself).

3) You are researching the best players in Supplemental Draft history, and Moore’s name came up. A star at Syracuse, Moore graduated early (back when it was still unusual for undergraduates to enter the draft), and therefore elected to enter the Supplemental Draft. The move cost the Jets the 8th pick in the 1991 Draft, which the Eagles used on Tennessee offensive lineman Antone Davis. Moore was the much better player.

4) You were wondering which player in the last 25 years (and, perhaps, for much longer) saw the most targets in a single season in NFL history. After some searching, you found out that the answer was Rob Moore, with 208 targets for the 1997 Cardinals.

Wait, what? Of all the players in the last 25 years, Rob Moore is the single-season leader in targets? The single-season leaders in receptions, receiving yards, and receiving touchdowns are Marvin Harrison, Calvin Johnson, and Randy Moss, respectively. The most targets (since 1992) that Jerry Rice ever saw was 176, and that was in 1995, when he gained 1848 receiving yards while playing for a 49ers team that threw 644 passes, the 2nd most in the NFL. So how did — just two years later — Rob Moore see 32 more targets than Rice in ’95? [continue reading…]

{ 10 comments }

Guest Post: Passing Volume vs. Passing Efficiency

Today’s guest post comes from Ben Baldwin, a contributor for Field Gulls and Bryan’s site, http://thegridfe.com. You can find more of Ben’s work here or on Twitter @guga31bb. What follows are Ben’s words.


Arguing on the internet

A common argument on the internet (e.g. Twitter, where I spent too much time) is that the efficiency of players like Dak Prescott and Russell Wilson in their rookie seasons (and subsequent seasons, for Wilson) was not impressive because they were not asked to throw the ball as much. Once they are asked to throw more often, the argument goes, we can expect their efficiency to fall off. Here is one of many, many examples:

Do quarterbacks really look good because they throw less? [continue reading…]

{ 17 comments }

Receiving TD Concentration Index (By Passer)

Gronk Smash

On Monday, I looked at the concentration index scores for a number of quarterbacks based on the number of touchdowns thrown to each receiver (more details on the formula available there and here). Today, the reverse: how diverse (or not diverse) were receivers with respect to the number of quarterbacks from whom they caught TDs?

Marques Colston, for example, caught 100% of his touchdowns from Drew BreesRob Gronkowski has caught all but one of his touchdowns from Tom Brady. And Mark Clayton caught 94% of his touchdowns from Dan Marino.

At the bottom of the list are two of the most underrated receivers by modern fans.   Both were superstars in college and very high draft picks, but “disappointed” in the pros.  That’s probably because they were stuck with a revolving door of bad quarterbacks.

Joey Galloway caught 77 career touchdowns and was the 8th pick in the ’95 Draft, but he is chronically underrated due to the bad quarterback play he experienced. He only had double digit touchdowns with one quarterback: an in-his-40s Warren Moon.  His top four quarterbacks were responsible for only 51% of his career touchdowns!  Galloway played with a lot of quarterbacks, and most of them were below-average.

The other receiver with a concentration index of less than 11% was former number one overall pick Irving Fryar.  Regular readers may recall that Fryar is the odd duck who set his career high in receiving yards at age 35 while playing with Bobby Hoying!  Fryar has over 3,000 yards with three franchises, a very rare feat.  He spent his 20s with the terrible Patriots back when that was a thing, and he led New England in receiving yards in ’90, ’91, and ’92, then led the Dolphins in receiving yards in ’93, ’94, and ’95, and then led the Eagles in receiving yards in ’96 and ’97!  It’s pretty impressive to lead your team in receiving yards for eight straight seasons, but it’s really impressive to do it for three different franchises. [continue reading…]

{ 4 comments }

Bell had a lot of valuable yards last year.

All yards gained on special teams are done outside of the context of the series (down and distance) environment that defines most games. A kickoff return from to the 30 or to the 40 represents a difference of 10 yards, but those 10 yards are not as valuable as the difference between a gain of 5 yards and 15 yards on 3rd-and-10. The former are, quite literally, special teams yards. They don’t provide any value in gaining any additional first downs, or keeping a drive alive. This is why we don’t spend a lot of time thinking about all-purpose yardage leaders, or the difference between a kickoff returner who averages 28.0 yards per return or 24.0. Special teams yards, while obviously valuable, are — just as obviously — the least valuable yards possible.

On a 3rd-and-10, a 15-yard pass provides a significant amount of value by providing a first down. But let’s get a bit more precise: the first 10 of those yards were really valuable. The last 5? Well, those were special teams yards. The difference between gaining 10 yards and gaining 15 yards on 3rd-and-10 isn’t that significant: well, it’s about as significant as returning a kickoff for 30 yards or 35 yards. Those last 5 yards don’t help a team move the chains. [continue reading…]

{ 21 comments }

Two years ago, I wrote this post titled “Take Away His X Best Carries and He’s Average.” The idea was simple: Suppose you sort each running back’s carries in descending order by yards gained. How many carries would we need to take away from him to drop his production to at or below average?

Browns running back Isaiah Crowell ranked 9th in yards per carry last year, with an impressive 4.81 average gain. But that number may be a bit misleading, to the extent it made you think that Crowell was consistently churning out big gains. Crowell was responsible for the longest run of the season last year, an 85-yard run in week 2 against the Ravens. And, for what it’s worth, it was one of the easiest long runs you’ll ever see:

In the last game of the year, Crowell had a more impressive 67-yard run against the Steelers. But here’s the thing: outside of those two runs, Crowell averaged just 4.08 yards per carry on his other 196 carries.

There were 42 running backs last year who had at least 100 rush attempts; those players averaged 4.19 yards per carry last year. So if you remove Crowell’s two best carries, he falls below that average.

An impressive Powell movement

On the other hand, Steelers running back Le’Veon Bell averaged 4.86 yards per carry last year, and his six best runs went for 44, 38, 33, 26, 25, and 24 yards. Remove those, and Bell still averaged 4.23 yards per carry, which means you need to remove his seven best runs to drop him below average.

Jets running back Bilal Powell was the star of this metric.  He averaged 5.51 yards per carry last year, but he was a consistent producer of big gains.  He had 12 runs of 13+ yards, and you need to remove all 12 to bring Powell below average.  Remove those 12 carries and his average finally dips to 4.16 yards per carry.

Below are the 19 running backs to exceed that 4.19 yards per carry average last year, and the fewest number of carries you would need to remove to bring their production below average: [continue reading…]

{ 15 comments }

2016 AV-Adjusted Team Age: Overall

On Tuesday and Wednesday, we looked at the average age for each team’s offense and defense in 2016. Today, let’s look at the overall picture (ignoring special teams). By that measure, the Jaguars, Browns, Rams, Bucs, and Texans have the five youngest teams in the NFL. Take a look: [continue reading…]

{ 3 comments }

2016 AV-Adjusted Team Age: Defense

Being young isn’t by itself a virtue: the Browns ranked in the bottom 5 in points allowed, yards allowed, net yards per attempt allowed, net yards per rush allowed, turnovers forced, and first downs allowed. But Cleveland was, by far, the youngest defense in the NFL last season.

Yesterday, we looked at the age-adjusted offenses from 2016. Today we do the same for defenses, and the Browns were the youngest group in the league last year, with an average age of just 25.2 years. [continue reading…]

{ 1 comment }

2016 AV-Adjusted Team Age: Offense

After each of of the last five years, I’ve presented the AV-adjusted age of each roster in the NFL. Measuring team age in the NFL is tricky. You don’t want to calculate the average age of a 53-man roster and call that the “team age” because the age of a team’s starters is much more relevant than the age of a team’s reserves. The average age of a team’s starting lineup isn’t perfect, either. The age of the quarterback and key offensive and defensive players should count for more than the age of a less relevant starter. Ideally, you want to calculate a team’s average age by placing greater weight on the team’s most relevant players.

My solution has been to use the Approximate Value numbers from Pro-Football-Reference.com, and to calculate age using each player’s precise age as of September 1 of the year in question.  Today, we will look at offenses; tomorrow, we will crunch these same numbers for team defenses. The table below shows the average AV-adjusted age of each offense, along with its total number of points of AV. Last year, the Rams, Jaguars, and Titans were the three youngest offenses. Each of those three are still in the top five this year, joined by the Bucs at #1 and the Seahawks at #4. [continue reading…]

{ 1 comment }

The Colts were 0.2 points per game better than average last year, as measured by the Simple Rating System (which takes the points scored and allowed in each game, and adjusts for opponent strength and home field advantage).

The Vikings were 0.9. points per game better than average in 2016, and hosted the Colts in week 15.  Given those facts, we would expect Minnesota to have won by 3.7 points.  Instead, Indianapolis upset the Vikings, 34-6, beating the expected line by 31.7 points.  That was the least-conforming game of 2016 (you can view the least-conforming games of 2015 here).

The table below shows all 512 regular season games from 2016, and how it differed from expectations. Here’s how to read the first line. The second-least conforming game was came in week 3, and we can use it to help guide us through the table below. The Eagles hosted the Steelers, and Philadelphia had an SRS rating of +3.7, while Pittsburgh had an SRS of +4.7. As a result, we would expect the Eagles to lose by 2 points. Instead, they won 34-3, exceeding expectations by 29 points.
[continue reading…]

{ 1 comment }

2016 Pythagenpat Records

If you’re not familiar with how to calculate Pythagenpat records, you can read this post.

But the short version is, this is a slight upgrade on using Pythagorean records, which I assume most of you are familiar with. The formula to calculate a team’s Pythagorean winning percentage is always some variation of:

(Points Scored^2) / (Points Scored ^2 + Points Allowed^2)

Here, instead of using 2 as the exponent, we use a dynamic exponent that changes based on how much scoring occurs in each team’s games. Here are the 2016 Pythagenpat records: [continue reading…]

{ 5 comments }

Three years ago, I looked at the single-season leaders in percentage of team rushing yards. Then and now, the top two seasons belonged to Edgerrin James: he had 94% and 92% of the Colts rushing yards in his first two seasons in the league. There were only three other seasons where a running back had at least 90% of his team’s rushing yards: Emmitt Smith in 1991, Barry Sanders in 1994, and … Travis Henry in 2002. In that post, I calculated for each team the percentage of his team rushing yards gained by that team’s top rusher. Then I calculated the league average percentage gained by each team’s top rusher, and plotted how that varied over time. This was intended to measure how running back back committee centric the league was in each year.

For a less rigorous method to measure RBBC-ness, you can see this post, which looked at games with more than 15 carries.

Both methods show RBBC being heavy in the ’70s, and the stud RB era peaking about 10 years ago.  But if you want to measure rushing concentration, a better method is probably to use the formula described yesterday. So for each team, I calculated the percentage of team rushing yards gained by every player on the team, squared that result, and then summed those numbers for each player on the team. You can read yesterday’s post for more info on the methodology, but here were the results for 2016: [continue reading…]

{ 9 comments }

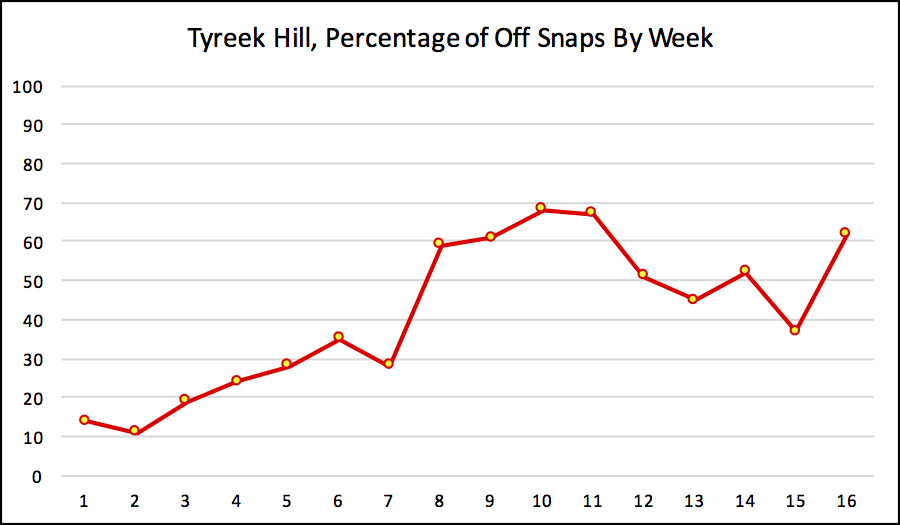
Tyreek Hill was noticeably absent from yesterday’s list of yards from scrimmage leaders. The main reason for that? Hill was a part-time player for the first seven weeks, failing to take the field on even half of Kansas City’s offensive snaps in even a single game.  By the end of the year, he was a more regular part of the offense, although he never participated in 70% or more of the Chiefs offensive plays in any regular season game (and in the playoff loss to Pittsburgh, he was present for 69% of Kansas City’s offensive snaps). The graph below shows the percentage of offensive snaps he was on the field each week of the 2016 regular season:

[continue reading…]

{ 5 comments }

Doug Drinen wrote this article 11 years ago, and it serves as a good reminder to always look at offensive numbers in the context of a player’s team. Yesterday, I looked at tackle leaders as a percentage of team tackles.  Today we will do the same thing with yards from scrimmage.

Arizona running back David Johnson led the NFL in yards from scrimmage last year with 2,118 yards. The Cardinals as a team gained 6,157 yards of offense (before deducting for sack yards lost), which means Johnson gained 34.4% of his team’s total output. That also led the league. However, Steelers RB Le’Veon Bell missed three games due to suspension and sat out a meaningless week 17 game.  Bell averaged 157 yards per game last year, the third-most in NFL history. He was responsible for 30.7% of the Steelers total yards from scrimmage last year, but on a pro-rated basis (i.e., multiplying that by 16/12), that jumps to an insane (although not historically extraordinary) 40.9%.

That’s the column the table is sorted by below. Here’s how to read Bell’s line. He gained 1,884 yards for Pittsburgh, while the Steelers as a team had 6,137 total yards. Bell therefore was responsible for 30.7% of Pittsburgh’s yards, but he only played in 12 games. On a pro-rated basis, he ranks first at 40.9%. The table below shows the top 75 leaders in this metric, minimum 6 games played: [continue reading…]

{ 4 comments }

Positive Air Yards per Attempt: 2017 Update

Adam Steele is back for another guest post. You can view all of Adam’s posts here. As always, we thank him for contributing.


Positive Yards Per Attempt: 2017 Update

If I could only share one thing from my time doing football analytics, it would be the following principle: Positive plays carry more weight than negative plays in determining the winner of a football game. I’ve already written a couple of articles on this subject and hope to further the cause with this update.

Overview

For those of you who don’t feel like reading the previous two posts, I’ll give you the basic gist. Since passing has a far greater impact on winning than running, I’ve focused my research on quarterbacks, but the principle applies to the entire offense (defense, not so sure). Despite everyone constantly harping on turnover avoidance, a potent passing offense is usually able to overcome giveaways. Conversely, avoiding turnovers is normally not enough to overcome a weak passing game. Furthermore, turnovers are highly random and situation dependent, so it follows that turnovers are a very poor method of gauging quarterback performance. Even though sacks are largely the quarterback’s fault, they are also very context dependent and only contribute a small amount in determining game outcomes. More importantly, the majority of signal callers trade sacks for interceptions or vice versa, so it’s no really fair to include one but not the other. [continue reading…]

{ 119 comments }

The Jay Schroeder Index

Yesterday, I looked at the quarterbacks who were the biggest checkdown artists: i.e., which players had the best completion percentages and lowest yards per completion averages. I measured this by calculating how many standard deviations above/below average each quarterback was in those two categories in each year.

Today, the reverse. And the big winner is rookie Terry Bradshaw. We all know Bradshaw stunk as a rookie. He had a whopping 11.0% interception rate, which was horrible even for 1970. In fact, he has the second most attempts in history by a player with an 11% or worse interception rate. And since Bradshaw also ranked dead last in completion percentage, he ranked 2nd to last in ANY/A that year.

Of course, you might wonder: how could someone with the worst completion percentage and by far the worst interception rate not rank last (by a mile) in ANY/A? Well, it’s because Bradshaw ranked 2nd in the NFL in yards per completion as a rookie. He was your ultimate boom/bust passer, finishing 2.75 standard deviations below average in completion percentage and 2.18 standard deviations above average in yards per completion.

The top of the list features a bunch of interesting names, but I’m calling this the Jay Schroeder Index for a reason.  Schroeder only had 8 seasons where he threw at least 200 passes, but he makes the top 200 in 6 of those 8 seasons!  Schroeder made the list in ’86, ’87, and ’88 (despite moving from the Redskins to the Raiders this year), and then in ’90, ’91, and ’92.  He only missed the list in 1989 during this run, and that’s because he threw just 194 passes.  But in 1989, of the 34 quarterbacks with at least 150 pass attempts, Schroeder had the lowest completion percentage (46.9%) and by far the highest yards per completion average (17.0, the best of his career).  In other words, Schroeder had a top-200 season in 6 out of 7 straight years, with the lone exception being perhaps his most Schroeder-esque season! Of course, Schroeder’s love of the deep ball isn’t new to readers of this site.

The table below shows the top 200 seasons based on the Schroeder Index, using the same formula as yesterday: [continue reading…]

{ 24 comments }

The most efficient runner in NFL history? That depends.

Jamaal Charles is now a Denver Bronco, making him the second superstar running back in two weeks to join a new team at the tail end of his career. In his prime, Charles was a very good receiver and a player that could be the centerpiece of an offense. However, he will likely be remembered for a singular skill: rushing efficiency.

Charles has a career YPC average of 5.45, easily the best in history among running backs in the NFL. That number is at least a little misleading. While rushing efficiency has not soared the way passing efficiency has, we are currently in a high-YPC environment. Two years ago, I calculated era-adjusted yards per carry: at the time, Charles was at 5.49, while the league average was 4.21. For reference, the league average during the careers of Jim Brown, Gale Sayers, and Barry Sanders was 4.08, 3.95, and 3.93, respectively.

I am not a big fan of yards per carry as a statistic, but hey, it’s still interesting trivia. It’s a little silly and mostly an academic exercise, but let’s pretend that we replaced every Charles rush attempt with a league average rush attempt. How much worse off would Kansas City have been? Well, a whole lot. Let’s use his 2010 season as an example. He had 230 carries for 1,467 yards, producing an incredible 6.38 YPC average. The league average that season was 4.21, meaning he was 2.17 YPC above-average. Given his 230 carries, we would have expected him to rush for just 968 yards, meaning he produced 499 rushing yards above average. And for his career? Charles is at +1657. [continue reading…]

{ 8 comments }

Peterson with a rare cameo by a good quarterback.

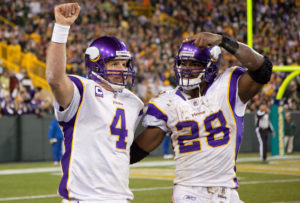
After a ten-year career with the Vikings, Adrian Peterson is now headed to New Orleans where he will get to play with Drew Brees.  It will be the second time Peterson has played with a Hall of Fame quarterback, after Brett Favre’s stint with the team beginning in 2009.

In ’09, the Vikings had a Relative ANY/A of +2.05, easily the best passing game the franchise has produced in the last decade.  In fact, the only other time in the last ten years that Minnesota had an above-average ANY/A was last year, when Peterson rushed for just 72 yards in three games.

Most of his time in Minnesota, though, the team’s passing attack has been below-average — or outright bad.  For example, in 2012, Peterson rushed for 2,097 yards.  That represented 17.9% of his career total, and it came when the Vikings had a Relative ANY/A of -0.94.  Overall Peterson has a weighted average RANY/A — i.e., the Vikings RANY/A in each season of Peterson’s career, weighted by the number of rushing yards Peterson had — for his career of -0.52.  Take a look. [continue reading…]

{ 6 comments }

Manning didn’t have much help during his career

Yesterday, I looked at quarterbacks from 2016 who started at least 8 games and threw at least 150 passes. For those passers, I calculated how many standard deviations above average they were in Relative ANY/A (i.e., how much better they were, statistically, than average) and in winning percentage. I sorted the list by the difference between the two, to find the quarterbacks whose stats and winning percentages diverged by the largest amounts.

What about historically? I performed the same study going back to 1970. And the season that stands out the most is Archie Manning’s 1980 season. That year the Saints were the worst team in the league: New Orleans went 1-15, and every other team won at least 4 games. [1]The Saints’ troubles continued into the draft; New Orleans selected George Rogers first overall, when two of the top four, and three of the top eight players went on to be Hall of Famers. Manning started every game for the team because he actually had a strong season, at least statistically: he ranked 9th out of 30 qualifying passers in ANY/A, and had a Relative ANY/A of +0.53. That, of course, is pretty unusual given his team’s 1-15 record.

That stands out as the biggest example of a divergence of stats being more impressive than team record. The best 100 seasons (although by default, the table only lists the top 20) are below: [continue reading…]

References

References
1 The Saints’ troubles continued into the draft; New Orleans selected George Rogers first overall, when two of the top four, and three of the top eight players went on to be Hall of Famers.
{ 12 comments }

Kessler in a losing effort.

In 2016, Browns rookie quarterback Cody Kessler had an uneven year. He went 0-8, but he ranked 24th in ANY/A out of the 31 quarterbacks who started at least 8 games and threw at least 150 passes. His stats weren’t great, but they weren’t 0-8 bad, either. In PFR’s Adjusted Net Yards per Attempt Index, which attempts to adjust for era, Kessler ranked 15th out of the 43 rookie passers to meet the 8 start/150 attempt threshold. It was a pretty good rookie season that came with an 0-8 record.

And then there was Brock Osweiler.  The Texans quarterback — now on the Browns — was dead last with a pitiful 4.34 ANY/A average last season.  But for the second year in a row, Osweiler produced a winning record despite poor play; Houston went 8-6 with Osweiler under center.

I calculated the winning percentage and Relative ANY/A (i.e., ANY/A adjusted for era) for each passer since 1970 to meet the 8 start/150 attempt threshold.  I then calculated the standard deviations above/below average each passer was in each category.  Here are the results for 2016, and here’s how to read the Kessler line: he started 8 games for the Browns and had a 0.000 winning percentage.  His Relative ANY/A was -0.34, so just a hair below league average.  He was 2.53 standard deviations below average in winning percentage, but only 0.28 standard deviations below average in RANY/A.  As a result, he was 2.24 standard deviations better in RANY/A than he was in winning percentage; that was the highest number on the list.  Passers at the top had much better stats than wins; passers at the bottom (highlighted by Osweiler) had better wins than stats. [continue reading…]

{ 24 comments }

Last year, Tyrod Taylor led all quarterbacks with 580 rushing yards. Colin Kaepernick, in 12 games, ranked 2nd with 468 rushing yards, and no other quarterback had even 400 rushing yards. But Aaron Rodgers, Blake Bortles, Cam Newton, Marcus Mariota, and Andrew Luck all had at least 300 rushing yards, so 7 out of 32 teams had a quarterback with at least that many yards.

How does that compare historically? Two years ago, in one of my favorite posts/methodologies, I looked at how to measure quarterback rushing yards. Here’s what I did.

1) Calculate the percentage of league-wide passing yards by each player in each season. For example, Tyrod Taylor was responsible for 2.3% of all passing yards in 2016.

2) Calculate the weighted average league-wide rushing yards for each season. So we take the result in step 1 and multiply that by each player’s number of rushing yards. For Taylor, this means multiplying 2.3% by 580 for a result of 13.4 rushing yards. Perform this calculation for each player in each season and sum the results to obtain a league-wide total. For 2016, this total was 150.9 rushing yards (obviously Taylor was the biggest contributor among quarterbacks).

3) For non-16 game seasons, pro-rate to 16 games.

Perform this calculation for each season since 1950, and you get the following results: [continue reading…]

{ 6 comments }

Joe Montana had what many consider to be the best performance in Super Bowl history. In Super Bowl XXIV against the Broncos, Montana completed 22 of 29 passes for 297 yards and 5 touchdowns, with 1 sack for 0 yards. Jerry Rice was the biggest beneficiary, catching 7 passes for 148 yards and 3 touchdowns, in a 55-10 blowout of the Broncos.

Do the math, and Montana averaged 13.23 Adjusted Net Yards per attempt that day. Making it even more impressive is that he was facing a Broncos defense that allowed just 3.89 ANY/A to opposing passers during the regular season. That means Montana averaged 9.35 additional ANY/A relative to the average Broncos opponent. Over 30 dropbacks, that’s 280 Adjusted Net Yards of Value that Montana added. That’s the most in Super Bowl history, just ahead of what Doug Williams did two years earlier against the Broncos.

In that game, Williams was 18/29 for 340 yards with 4 TDs and 1 INT, and one sack for 10 yards. That’s an ANY/A of 12.17, but it came against a slightly tougher defense: the Broncos allowed 3.77 ANY/A that season. So Williams was 8.40 ANY/A better than “expected” against Denver, over 30 dropbacks; that means he produced 252 ANY of value in the Super Bowl.

Below are those numbers for each of the 128 passers in Super Bowl history. For Super Bowls prior to 1981, I had to use estimated sack data rather than actual, with the formula for estimated sacks being simply (Team Sacks) * (QB Pass Attempts/Team Pass Attempts). [continue reading…]

{ 40 comments }

Atlanta had a really, really good offense this year. My favorite statistic: the Falcons had 59 drives end in a punt or a turnover, and 58 end in a touchdown.  Atlanta averaged 3.03 points per drive this year, and yet, the offense has been even better in the playoffs.

There was no stopping Matt Ryan and the Falcons against Green Bay, as the group scored 44 points on 9 drives in the NFC Championship Game. In the division round, the Falcons scored 36 points on 9 or 10 drives against Seattle, depending on whether you want to treat the Falcons final drive of the game as a real drive.  In two NFC playoff games, Atlanta’s offense has scored 10 touchdowns, seen 5 drives end on punts, 3 end on field goals, with zero turnovers and one drive end with the clock running out.

Scoring 80 points on 18 or 19 drives translates to an average of 4.21 or 4.44 points per drive. Take an average of those two numbers, and the offense is still averaging a whopping 4.32 points per drive. How remarkable is that? Well, it’s the best average for any of the 102 Super Bowl teams in their pre-Super Bowl playoff games.

The NFL has not historically recorded drive stats, so I previously wrote how one can estimate the number of offensive drives a team has in a game or season.  I used that formula to measure the best playoff offenses entering the Super Bowl; unsurprisingly, the 1990 Bills were the previous hottest offense.

Against Miami in the division round, Buffalo had between 10 and 12 drives, depending on how you treat the final drives of the half (the Bills received the ball with 14 seconds left on their own 32, and took a knee) and the game (Buffalo received the ball with just over one minute to go, and ran three times for a first down to run out the clock). Those other ten drives ended as follows, in order: Touchdown, Field Goal, Field Goal, Touchdown, Touchdown, Interception, Field Goal, Touchdown, Touchdown, Punt. That’s 44 points on 10 real drives.

The next week, in the AFC Championship Game against the Raiders, the Bills had 11 or 12 drives, as the final drive of the game featured Buffalo taking a pair of knees to close out a 51-3 victory. The first 11 drives went: TD, TD, Interception, TD, missed FG, TD, TD, Punt, TD, FG, Punt.  That’s 44 points (Buffalo also scored on a pick six, and one extra point was missed) on 11 drives. [continue reading…]

{ 14 comments }

Background reading:

Part I

Part II

Part III

I’m going to assume you have read the first three parts of this series; today, I want to go through how to adjust passer rating by era while keeping the weights of 5, .25, 20, and 25 on the four variables. As a reminder, here are the formulas used for the four variables in passer rating, once you ignore the upper and lower limits:

A = (Cmp% – .30) * 5
B = (Y/A – 3.0) * .25
C = TD% * 20
D = 2.375 – Int% * 25

Adjusted Completion Percentage

For completion percentage, we can do a simple era adjustment because the multiplier is not directly tied to league average. Instead, league average is intended to be 20% higher than the floor, which is 0.30 in the original formula. So we need to rewrite completion percentage as simply

A = (Cmp% – (League_Avg_Cmp% – 0.20) ) * 5

So in an environment where the league average completion percentage was 50%, you would insert 0.3 in the blue parenthetical; in 2016, tho, you would insert 43.0%. [continue reading…]

{ 13 comments }

The regular season is now over, and it ended with a whimper. Of the 16 games in week 17, 6 featured margins of 17+ points, and a 7th had a Game Script of +15.2. There were two big comebacks, but they came in meaningless games: The Colts overcame a 17-0 deficit to win 24-20, with the final margin coming on a touchdown pass in the final seconds.

The Steelers, with their stars rested, trailed most of the day against the Browns. This game wasn’t meaningless to San Francisco, though: Cleveland led 14-0 early and 14-7 entering the 4th quarter; had the Browns won, the 49ers would have had the number one pick. Instead, Pittsburgh won in overtime, cementing a 1-15 year for the Browns.

Below are the week 17 Game Scripts. [continue reading…]

{ 4 comments }

Note: the 2016 Game Scripts page is now updated through week 16.

The big win of the week, not surprisingly, came from the Patriots over the Jets. New England was a 17-point favorite over New York, and won by 38 with a Game Script of +20.6. That’s the third best Game Script of the season.

In the world of misleading final scores, the Cowboys beat the Lions by 21 points, but with a Game Script of only +6.6. The Lions actually led in this game, 21-14, late in the 2nd quarter, and trailed by only 7 with 20 minutes left. Dallas then scored two quick touchdowns, and neither team scored in the final ten minutes.

And the comeback of the week belongs to San Francisco. With 5:14 left, the 49ers trailed by 14 points, facing 3rd-and-10 from the Rams 13-yard line. Colin Kaepernick scrambled for a 13-yard touchdown, the 49ers defense forced a three-and-out, and the 49ers put together their second straight touchdown drive of 73+ yards. Then, the 49ers went for two — which is silly, given that the 49ers didn’t go for 2 after the first touchdown — and Kaepernick scrambled for the conversion. That’s how San Francisco won, 22-21, with a -5.5 Game Script.

Below are the week 16 Game Scripts results: [continue reading…]

{ 4 comments }

Are Teams Not Throwing Enough Interceptions?

In before the first “Well the Jets sure are” comment…..

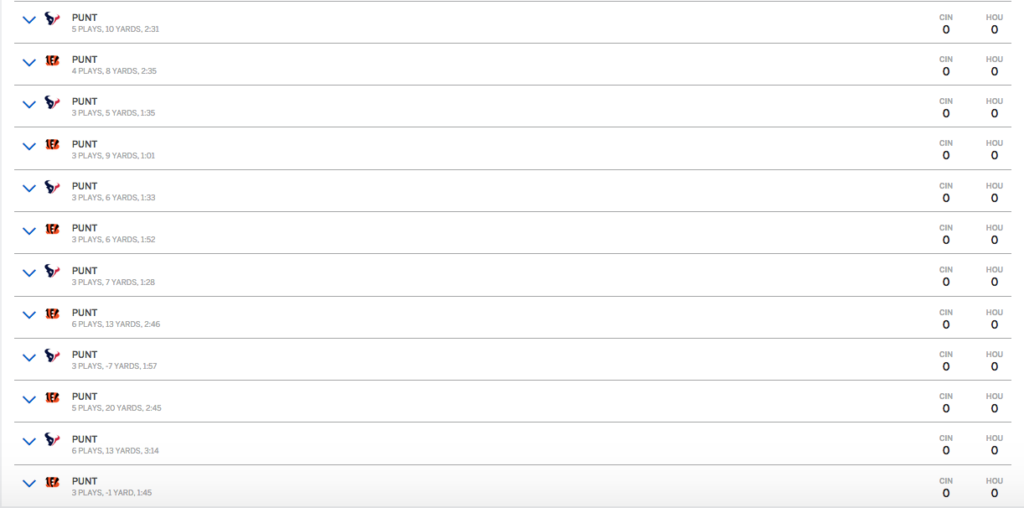
On Saturday night, the Texans/Bengals game opened with 12 straight punts. Here’s the drive chart, in reverse chronological order, after twelve drives:

[continue reading…]

{ 10 comments }

A number of teams produced blowout wins in week 13, with two of those games coming on national television.  The Colts destroyed the Jets on Monday Night Football, 41-10, with a Game Script of +19.9 in a game that was never close. The Ravens murdered the Dolphins, 38-6, producing a Game Script of +18.1. And the Seahawks had a Game Script of +16.8 in a Sunday Night massacre against Carolina.

Only two teams won with negative Game Scripts: Oakland trailed Buffalo for much of the game, and was down 24-9 halfway through the third quarter. The Raiders ultimately won by two touchdowns, despite a Game Script of -1.1. The biggest comeback belonged to Tampa Bay, who won with a -2.2 Game Script in San Diego. The Chargers led for most of the game, including with a 21-17 lead entering the fourth quarter. The Bucs scored 11 points in the final frame to pull out the victory.

Below are the week 13 game scripts: [continue reading…]

{ 0 comments }

The 2016 Bills Are The 1973 Bills, Reincarnate

In 1988, the Dolphins went 6-10. That was the only sub-.500 season the Don Shula/Dan Marino Dolphins ever had.

You probably won’t be shocked to learn that those Dolphins finished dead last in rushing yards and first in passing yards. After all, Miami finished first in pass attempts, and the team ranked 2nd in NY/A; meanwhile, the Dolphins ranked last in rushing attempts, and 23rd in yards per carry. The presence of Marino, a bad running game centered around Lorenzo Hampton and Troy Stradford, and a 6-10 record all paved the way for the 1st/last split.

In 2005, the Cardinals went 5-11, and also ranked 1st in passing yards and last in rushing yards. That team’s running game was terrible: Marcel Shipp and J.J. Arrington were the backs, and the team ranked last in yards per carry *and* rushing attempts (and rushing TDs), as Arizona finished 190 rushing yards behind every other team. But with Kurt Warner at the helm, a bad record, and that running game, Arizona finished 50 passes (including sacks) more than than any other team, and 327 more yards.

That doesn’t sound so weird, does it? But since 1970, those are the only teams to rank 1st in passing yards and last in rushing yards (seven others raked 1st/2nd and last/2nd to last). And only three teams have done the reverse, finishing first in rushing yards and last in passing yards.

The first, unsurprisingly, was the O.J. Simpson-led Buffalo Bills in 1973 during his historic campaign. Buffalo went 9-5 and finished first in YPC and 2nd in attempts, as Simpson had a 332/2003/6.0 stat line, while Jim Braxton (108/494/4.6) and Larry Watkins (98/414/4.2) produced solid numbers in support. Joe Ferguson was not very good at quarterback: Buffalo ranked last in pass attempts, 3rd-to-last in NY/A, and therefore last in passing yards (and TDs).

The presence of the 2003 Ravens in this group is not going to surprise any folks, either. The 10-6 Ravens had a great defense and a fantastic running game led by Jamal Lewis, who rushed for over 2,000 yards. Baltimore finished 1st in rushing attempts and 3rd in yards per carry, with Lewis doing most of the heavy lifting there. With Kyle Boller and Anthony Wright, the passing attack was pretty bad: it ranked 27th in NY/A and 32nd in attempts, so the last-place ranking in passing yards makes sense.

The third team is one most of you could probably guess: it’s the 2006 Michael Vick-led Atlanta Falcons. Atlanta finished 1st in rushing attempts *and* 1st in yards per carry, joining the famous 1978 Patriots as the only teams since the merger to pull off that feat. The Falcons rushed for 2,939 yards, the most by any team since 1984. The passing game led by Vick was not very good: Atlanta ranked 29th in NY/A, and since it ranked 32nd in attempts, it ranked last in passing yards.

So why bring up those teams today? The 2016 Bills rank 2nd to last in pass attempts (by 1, to Miami) and 2nd in rushing attempts (Dallas), in a very 1973 Bills-like fashion. Buffalo easily leads the league in yards per carry (5.3), although right now the Cowboys (thanks to quantity) are only half a yard per game behind the Bills. LeSean McCoy is averaging 5.2 yards per carry, Mike Gillislee is at 5.8, and Tyrod Taylor is at 6.4; that group is powering an insanely efficient running game.

The passing game, meanwhile, is nearly as bad as the running game is good. That’s mainly because of a drop in yards per completion (from 8th last year to 25th in 2016). Taylor averaged 7.10 ANY/A this year and 5.73 this year; Buffalo ranks in the bottom 5 of the league in NY/A, so given the 31st-place ranking in attempts, it’s not too shocking that the Bills are last in passing yards (though the 49ers are less than 50 yards ahead of them).

As a result, the Bills look a lot like the ’73 Bills, and those two teams could make up half of the franchises since 1970 to rank last in passing yards and first in rushing yards.

{ 3 comments }
Next Posts Previous Posts