≡ Menu

Adjusted Completion Percentage

In 1991, Dave Krieg led the NFL in completion percentage. He completed a career-high 65.6% of his passes, and while that mark was very good for that era, it doesn’t mean Krieg was great that season. In fact, he arguably wasn’t even good: Krieg actually finished just 24th in ANY/A that year.

One reason, I think, that Krieg was able to lead the NFL in completion percentage is because Krieg “ate” a lot of his incomplete passes. What do I mean by that? Krieg took a ton of sacks — he was sacked every ten times he dropped back to pass. When under duress, some quarterbacks eat the ball, to avoid an interception; that’s bad (well, it’s better than n interception) but it doesn’t get graded that way when calculating completion percentage. Other quarterbacks will throw the ball away; that’s good (assuming it isn’t intercepted) because no yards are lost, but it does hurt the quarterback’s completion percentage.

Even ignoring the yards lost due to sacks, fundamentally, a sack is no better than an incomplete pass. So why are quarterbacks who take sacks rather than throw the ball out of bounds given an artificial boost when it comes to completion percentage? Well, that’s largely just an artifact of how the NFL always graded things. The NFL was not always good at recording metrics, and somewhere along the way, sacks were either included as running plays, ignored, or included as pass plays. I don’t think a lot of thought went into it, but in my view, it makes the most sense to include sacks in the denominator when calculating completion percentage. Otherwise, we give undue credit to quarterbacks that take a lot of sacks, and penalize quarterbacks who throw the ball away when under pressure. [continue reading…]

{ 35 comments }

The 1978 Patriots, Part II

The 2001 Rams had Kurt Warner, Marshall Faulk, Isaac Bruce, and Torry Holt.

The ’92 and ’93 49ers have prime Steve Young and prime Jerry Rice, along with the first two years of Ricky Watters’ great career.

The ’88 Bengals had MVP Boomer Esiason, Pro Bowler Eddie Brown, HOFer Anthony Munoz and Pro Bowler Max Montoya on the offensive line, and a running back tandem of James Brooks and Ickey Woods. Two years earlier, the ’86 Bengals had those players save Woods, but also had Cris Collinsworth in the prime of his career.

The ’51 Rams had Norm Van Brocklin and Bob Waterfield — two HOFers — at quarterback, along with Elroy Hirsch, Dan Towler, Dick Hoerner, and Tom Fears.

Those are 6 of the 7 teams since 1950 to lead the NFL in both average yards per rush and average yards per pass. Can you guess the 7th team? You have three guesses, but the first two don’t count. [continue reading…]

{ 15 comments }

The 1978 Patriots, Part I

Here’s what I wrote in my first post at Football Perspective:

I’ll be blogging about everything football-related, from Jerry Rice to Bobby Douglass, and from the 1978 Patriots to who is the greatest quarterback of all time.

The New England Patriots rushed for 3,165 yards, an NFL record that still stands. Take a look at the individual players on that team:

Games Rushing
No. Age Pos G GS Att Yds ▾ TD Lng Y/A Y/G A/G Fmb
39 Sam Cunningham* 28 FB 16 14 199 768 8 52 3.9 48.0 12.4 4
23 Horace Ivory 24 rb 15 3 141 693 11 28 4.9 46.2 9.4 5
32 Andy Johnson 26 RB 15 13 147 675 3 52 4.6 45.0 9.8 4
14 Steve Grogan 25 QB 16 16 81 539 5 31 6.7 33.7 5.1 9
44 Don Calhoun 26 rb 14 2 76 391 1 73 5.1 27.9 5.4 1
37 James McAlister 27 16 0 19 77 2 16 4.1 4.8 1.2 3
86 Stanley Morgan 23 PR/WR 16 16 2 11 0 6 5.5 0.7 0.1 6
29 Harold Jackson 32 WR 16 13 1 7 0 7 7.0 0.4 0.1 0
30 Mosi Tatupu 23 16 0 3 6 0 3 2.0 0.4 0.2 0
4 Jerrel Wilson 37 P 14 0 1 0 0 0 0.0 0.0 0.1 1
83 Don Westbrook 25 16 0 1 -2 0 -2 -2.0 -0.1 0.1 0
Team Total 26.2 16 671 3165 30 73 4.7 197.8 41.9 35

[continue reading…]

{ 6 comments }

He gained 120+ yards pretty frequently

He gained 120+ yards pretty frequently

Yesterday, I posted a list of the career leaders in receiving yards after removing “junk” yards gained on an individual game basis. I’ve defined junk games as somewhere between 32 and 40 yards in 2015, and a lower threshold in less pass-friendly eras. You can view the Justin Blackmon example here.

While I presented the career list yesterday, I thought it would make sense to plot the career yards after removing junk yards (using 2.5x as the baseline) against each receiver’s plain career receiving yards (in both cases, since 1960). That’s what I’ve done in the graph below, with actual career receiving yards on the X-Axis and career yards after removing junk yards on the Y-Axis. Jerry Rice is literally off the chart (22,895; 13,786) because including him would require using a much broader (and less helpful) chart. Let’s just ignore Rice and focus on the other 99 receivers: [continue reading…]

{ 9 comments }

[Note: Due to a scheduling blunder, you may have missed yesterday’s post on single-season leaders.]

The GOAT

The GOAT

On Sunday, I explained one methodology to modify receiving yards in a way to give more value to top receivers while devaluing junk games. You can read that explanation here, and see the Justin Blackmon example.

Jerry Rice, of course, will rank as the top receiver by this or any other methodology, especially if that system excludes Don Hutson (today’s data only goes back to 1960). In fact, using a 3X baseline, Rice still gained 15,314 receiving yards after removing junk yards, more than every wide receiver in NFL history has gained including junk yards other than Terrell Owens. Rice was just incredible.

Perhaps the first real surprise on the list is Don Maynard, who ranks 6th among all players since 1960 by this methodology. The Jets Hall of Famer currently ranks 26th in career receiving yards, but 30 years ago, he was the all-time leader in that category. Maynard benefits here for some era adjustments — his 14-game seasons get prorated, the baseline for junk seasons was lower in the ’60s and ’70s — and his dominant play for a long stretch is rewarded.

The table below shows the top players by this methodology since 1960. Here’s how to read the table, using the Owens line. Using a 2.5X baseline, he ranks 2nd all-time. His career began in 1996 and ended in 2010, and he had 9,386 receiving yards above that junk baseline. Using a 3X baseline, he still ranks 2nd, and had 10,493 non-junk receiving yards. [continue reading…]

{ 11 comments }

Adam Steele is back for another guest post. You can view all of Adam’s posts here. As always, we thank him for contributing.


There have been countless attempts at deducing the clutchiness of NFL quarterbacks, most of which involve tallying playoff wins and Super Bowl rings. Today I’m going to take a stab at the clutch conundrum using a different approach: Pythagorean win projection. If a quarterback’s actual win/loss record diverges significantly from his Pythagorean estimated record, perhaps we can learn something from it. I began this study having no idea how it would turn out, so there were definitely some surprises once I saw the end results. This study evaluates the 219 quarterbacks who started at least 32 games since 1950, including playoffs but excluding the 1960-64 AFL (lack of competitive depth).

Here’s how to read the table, from left to right: points per game scored by the QB’s team in games he started, points per game allowed in his starts, total starts, total wins (counting ties as a half win), Pythagorean projected wins based on the points scored and allowed in his starts (using a 2.37 exponent), and the difference between his actual win total and Pythagorean win projection. [continue reading…]

{ 38 comments }

Brad Oremland noted in his last post that Stanley Morgan is the only player in history to average more than 19 yards per catch in a career with at least 500 receptions, and that such distinction will probably stand forever. Brad’s likely right: given today’s environment, Vincent Jackson and Calvin Johnson are the two preeminent deep threats of the last decade with at least 500 catches, and Jackson (16.97) and Johnson (15.89) were far shy of that mark.

That’s a fun bit of trivia, but let’s expand it. You can use reception cut-offs to come up with lots of Yards per Catch Kings. Here’s an exhaustive one:

  • Jerry Rice is the all-time leader in yards per reception (14.78) among players with at least 1,079 receptions.
  • Terrell Owens (14.7811 to Rice’s 14.7805) is the all-time leader in yards per reception among players with at least 1,025 receptions.
  • Isaac Bruce is the career leader in YPR, at 14.85, among players with at least 983 receptions.
  • Randy Moss (15.57) is the only player to average 15 yards per reception and record 820+ receptions.

[continue reading…]

{ 18 comments }

The 2015 season was another spectacular one for wide receivers. Pittsburgh’s Antonio Brown outgained the NFL’s leading rusher by a record 349 yards. On a game-by-game basis, the leading receiver for every team in every NFL game this year, including playoffs, averaged 94.3 receiving yards, a post-merger record.

In fact, the average number of receiving yards gained by the leading receiver of each team has been steadily rising, which isn’t surprising.  The average was below 80 as recently as 1992, and below 70 in 1977, the year before the big passing rules changes went into effect.  But the 1962 NFL season had a slightly higher average, at 95.2, while the average leading receiver in a game in the ’64 AFL even broke 100.

The graph below shows the average number of receiving yards gained by each team’s leading receiver in every game in each season since 1960.  In all graphs today, the NFL line is in blue, while the AFL line is in red. [continue reading…]

{ 2 comments }

The 2000 NFL Draft was supposed to bring an incredible infusion of wide receiver talent. Peter Warrick, Plaxico Burress, and Travis Taylor were top-10 picks, making it one of only four classes since 1970 were three wide receivers drafted in the top ten. In addition, Sylvester Morris, R. Jay Soward, Dennis Northcutt, and Todd Pinkston all went in the top 36 picks, one of only seven classes since the merger with seven wide receivers in the top 36. Avion Black was the 20th wide receiver taken with the 121st pick: add it all up, and the 2000 draft had unmatched levels of quality and quantity. The graph below shows the amount of draft value spent on wide receivers (you can click here for value spent on wide receivers and tight ends) in each draft from 1970 to 2011: [continue reading…]

{ 24 comments }

Over the last couple of days, I’ve been looking at receiving yards by class year. I’ll continue that today, with a look at the best classes in wide receiver history.

The 2014 class looks to be a very special one. It set a rookie record by gaining 18,321 receiving yards in 2014, the most by any set of rookies in NFL history. Then last year, those same players gained 23,727 last year, the most by any class in any single season in history.

Of course, while impressive, we have to remember the pass-friendly environment we are experiencing. The Class of 2014 — which includes all players selected in the 2014 Draft and all undrafted players whose first season began in 2014 — gained 14% of all receiving yards two years ago, and then 18% of all receiving yards in the NFL in 2015. Thought of another way, the class of 2014 has averaged 16% of receiving yards in their first two seasons.

thru 2 years

The 1987 class was a bit inflated by the replacement players who all register as rookies. The only other class since the merger with at least 15% through two years was the 1974 class, which got strong rookie seasons from Charlie Wade, Nat Moore, Paul Seal, Joel Parker, Harrison Davis, and Roger Carr, and then had Lynn Swann, Ken Payne, Moore, Ray Rhodes, Carr, Charlie Smith, and John Stallworth play well in 1975.

The 18% number produced by the 2014 class in year 2 was the highest rate since by a sophomore class since 1958.  That year, second-year players Del Shofner led the NFL in receiving yards, while R.C. Owens and Tommy McDonald finished in the top ten, with Joe Walton, Jon Arnett, and Billy Ray Barnes rounding out the class.

We can also look at the best classes as rookies, and over 2-, 3-, 5-, 7-, and 10-year periods. Finally, the last column simply sums the percentage of receiving yards from each class in every year of their careers.

Year1First 2First 3First 5First 7First 10Total
195018.5%20.7%20.4%19.3%17.3%14.5%147.9%
195118.3%17.9%16.6%16%14.7%11.9%123.2%
195215.8%16.9%15.9%16.8%16.6%14.5%156.2%
195311.8%10.3%10.4%11.4%10.5%8.7%97.5%
195416.1%13.4%14.3%12.8%11.9%9.7%105.1%
195512.9%10.7%9.1%7.3%6%4.4%43.6%
195610.9%13.3%14.5%14.3%13.8%11.6%118.9%
195711.4%16.2%16.7%16.2%16%13.7%144.3%
195810.4%13.2%15.8%15.6%15.3%13.5%137.7%
19596.4%8.2%8.5%9%8.1%7.2%75.5%
19608.6%10%10.1%9.4%8.3%6.7%70.8%
19618.6%12.1%12.7%13.2%12.5%10%102.1%
19625.8%6.9%7.6%8.1%7.6%6.6%67.2%
196310.5%9.8%10.9%11.9%11.6%8.8%90.2%
196413.1%13.3%14.6%14.4%13.3%10.7%112.2%
19658.7%11.8%13.8%15%15.1%13.1%136.7%
19663.9%7%8.4%8.8%8.4%6.6%67%
19678.7%11%12%11.3%10.3%8.2%84.6%
19688.4%9.9%11%10.9%9.8%8.2%89.9%
196911%13.9%14.8%15.1%13.2%10.5%114.6%
197010.7%12.5%13.7%13.7%12.3%9.8%101.3%
197111.5%13.2%14%13.4%11.9%9.7%103.4%
19727.9%10.1%10.7%10.9%9.9%8.1%85%
197310.9%13.9%14.1%13.2%11.2%8.8%90.6%
197413.7%15.2%16.7%17.1%15.7%12.3%129.8%
197511.5%12.3%12.7%12%10.5%8.6%89.4%
197612.7%14.1%15.2%15.6%14.5%12%124.6%
19779.3%11.8%12%12%10.9%9%94.1%
197810.8%12.1%11.8%11.8%11%9.4%100.2%
197910.7%13.8%15%15.9%14.5%11.9%127%
19809.6%9.9%10.8%11.4%9.9%7.7%81.5%
19818.4%9.8%10.8%11%9.8%7.9%80.4%
19828.1%10.4%10.8%10.9%9.8%8%85.6%
198311.7%13.4%14.4%14.2%13.4%11.4%120.3%
19849.8%11.7%11.3%11.6%10.7%8.8%97.4%
19859.6%13%13.3%13.5%13.1%11.6%130%
198612.1%12.7%12.5%12.7%12%10.3%106.4%
198716.5%16.2%15.9%14.4%12.4%9.7%103.2%
198811.1%12.4%12.8%13.9%13.5%11.6%123.4%
198910.9%11%10.7%10.3%9.5%8.3%87.4%
19909%11.1%12.2%12.7%11.6%10.1%110.3%
19917.2%10.4%11.3%12.9%12.8%11.4%123.5%
19925.5%6.6%7.6%7.8%7.6%6.2%66.1%
199310.3%10.5%11.2%10.9%10.3%8.6%90.3%
19948.4%10.4%11.5%11.3%10.8%9.2%98.6%
199510.8%12.3%12.8%12.3%11.5%9.4%100.3%
199610.6%11.4%12.4%13.3%12.9%12%137.1%
19976.5%8.4%9.4%9.8%9.1%7.8%88.8%
19989.5%11.6%11.8%11.2%9.9%8%86.3%
19998%9.5%10.1%10.6%9.6%8.2%87.5%
20009.2%10.3%11%10.5%9.4%7.4%75%
200110.3%12.3%13.7%13.9%12.9%10.9%118.3%
200211%11.6%12.7%12.7%11.5%9.1%91%
200310%11.5%11.9%12%11.5%9.8%107.2%
20049.5%11%12.5%12.4%11.1%8.8%92.2%
20058.6%9.3%9.9%9.6%8.8%7.3%74.9%
200610.2%11.7%12.3%12.1%11.5%9.7%97.4%
20079.3%11.1%12.4%12.2%11%86.6%
200810.2%12.3%12.8%12.6%11.5%85.4%
200911.3%13.7%13.5%12.4%10.9%76%
201012.1%13.7%14.2%13.7%77.4%
201111.7%12.6%13.1%12%60.1%
201211.8%13.4%12.9%48.7%
201313.4%14.3%14%42%
201414.2%16%32.1%
201512.6%12.6%

The 1996 class, with Marvin Harrison, Terrell Owens, Keyshawn Johnson, Muhsin Muhammad, Joe Horn, Eric Moulds, Amani Toomer, et. al., is often considered one of the best classes ever. That’s not quite so clear early on — a number of classes have them beat through 7 years — but the longevity is incredible.  Take a look at this graph, which just shows the total percentages; that’s obviously going to be biased against active classes, but it’s a fun graph to look at anyway:

overall wr perc

As always, please leave your thoughts in the comments.

{ 1 comment }

It’s easy to think that as the NFL becomes more of a passing league — a statement that’s undeniably true — that the best teams would be passing most frequently. But that just isn’t the case. The three best teams in Adjusted Net Yards per Attempt last year were Arizona, Cincinnati, and Seattle; those three teams ranked 19th, 26th, and 28th, respectively, in pass attempts. The Saints and Patriots did rank in the top five in both pass attempts and pass efficiency, but that just balances things out; it doesn’t mean the best passing teams are the most pass-happy teams.

There’s a pretty easy way to track this throughout history. The common way to calculate league-average Adjusted Net Yards per Attempt is to measure the league totals of its components: figure out how many league-wide passing yards, touchdowns, interceptions, sacks, and sack yards lost there were in any given season, and run through the calculation.

Another way, though, is to measure each team’s ANY/A average, and take an average of those averages. This approach gives each team the same weight when calculating league-average ANY/A; as a result, if this approach leads to a higher average than the traditional approach, that means the best passing teams are passing less frequently. And if the traditional approach has a higher average, that means the better passing teams are passing more often, because giving those teams extra weight (because of more pass attempts) is leading to a higher average. [continue reading…]

{ 10 comments }

You remember the 1987 Draft, right? It was a terrible draft for pass catchers.  The first TE drafted was Robert Awalt in the third round; only two more, Ron Hall and Jim Riggs, went before the sixth round, and Ron Embree was the final TE selected before the seventh round. At wide receiver, Haywood Jeffires was the first off the board at #20; the only other first rounders were Ricky Nattiel and Mark Ingram. The only other receiver in the top 50 was Lonzel Hill.  Mark Carrier, Kelvin Martin,Curtis Duncan, and Bruce Hill went in the later rounds,  but it was a terrible draft for pass catchers.

Using the Draft Value Chart, there were 177.4 points of draft value used on wide receivers and tight ends in the 1987 Draft.  That was the second year in a row when the league moved away from pass catchers.  Well, in this past draft, less draft capital was spent on wide receivers and tight ends than on any year since 1987. Take a look: [continue reading…]

{ 1 comment }

Consecutive Playoff Losses For a Franchise

From 1993 to 2015, the New York Islanders lost eight consecutive playoff series, beginning with a loss in the conference finals to Montreal in 1993, and culminating in a heartbreaking, 7-game series loss last year to Washington. Last night, the Isles came from behind and defeated Florida, to win the series, four games to two.

So the streak stopped at eight for the Islanders; as it turns out, the longest streaks for consecutive playoff losses in NFL history is also at eight, with two of those streaks being active. [continue reading…]

{ 6 comments }

Yesterday, I wrote how the NBA seemed to undervalue the three-point shot for many years. While the 3-point shot was consistently the better EV play, and the ratio of three-point shots to overall shots was increasing, it didn’t seem to increase quickly enough. As pointed out in the comments, one could make a pretty similar claim about pass/run ratio in the NFL.

It’s a little misleading to start things in 1970, since that’s really the beginning of the dead air era in football history. Pass efficiency was very high in the late ’40s and parts of the ’60s, so a chart beginning in 1970 would inaccurately imply a linear progression of the passing game. That said, because first down data is spotty the farther back we go, and because of the complexity involved in deciding how to treat the AFL, I’m going to limit myself today to the period from 1970 to 2016. [continue reading…]

{ 5 comments }

Yesterday, I looked at the Pythagenpat records for all teams since 2000. Since I crunched all that data, I thought it would be fun to look at the biggest outlier teams.

The 2003 Steelers were not very good. Pittsburgh went 6-10, scoring 200 points and allowing 327 points. Because of regression to the mean, the ’04 Steelers were expected to be a little better, and finish with 7.2 wins. Instead, behind a rookie Ben Roethlisberger and an outstanding running game and defense, the Steelers went 15-1, exceeding expectations by 7.8 wins.

Last year’s Panthers also went 15-1, and have a similar story. Cam Newton, the AP MVP, was more of the driving force, of course, but a great running game and defense powered the team. But based on a mediocre ’14 season, Carolina was expected to win only 7.8 games, so the 2015 Panthers exceeded expectations by 7.2 wins.

The third biggest outlier? That would be the ’07 Patriots, who went 16-0 with a projection of just 9.5 wins. The next year, New England was projected to win 10.99 games, and… went 11-5.

The table below shows each team since 2000, and their number of projected and actual wins. The table is sorted by the difference column: [continue reading…]

{ 2 comments }

The Browns have been running in place

The Browns have been running in place

A good read from ESPN yesterday about new Clevleand Chief Strategy Officer Paul DePodesta, who is being labeled as the man who will (attempt to) bring Moneyball philosophies to the NFL. Putting aside the inaccuracy of that statement — Moneyball philosophies mean different things to just about everyone, and such philosophies are already a staple in many organizations — there will be a certain spotlight cast on DePodesta in Cleveland. And, according to some statistical analysts, that’s a bad thing.

At MIT Sloan Sports Analytics Conference in March, unilateral fear existed inside analytics community that systemic ineptitude of Browns franchise will be too substantial for even DePodesta to repair. Failure would damage legacy of beloved industry pioneer and set field of sports data science back decades. “If you love analytics and want it to grow and succeed in the NFL, then you know Cleveland is a nightmare scenario,” states NFL executive with 20 years of experience in analytics. “Cleveland is a crazy, terrible place for this to be tested in football.”

The idea that Cleveland is too toxic to be resurrected is…. well, it’s more supported by the data than you might think. Certainly DePodesta could turn things around, but if he doesn’t, he’ll just be the next man in a long line of failed Browns executives. You won’t be surprised to learn that Cleveland has the worst winning percentage in the NFL since re-entering the league in 1999. But even accounting for the fact that the Browns have been bad, Cleveland has still underperformed to the tune of about 26 wins over the last 16 years, most in the NFL.

How did I arrive at that number?

  • First, I calculated each team’s Pythagnpat winning percentage in each season beginning in the year 1999, which is based solely on the number of points scored and allowed by each team. For example, in 2014, the Browns scored 299 points and allowed 337, which translates to a 0.429 Pythagenpat winning percentage (the Browns actually beat that slightly, by going 7-9).
  • Next, I ran a regression on the years 1999 to 2014, using Year N Pythagenpart winning percentage to predict Year N+1 wins. This would, in theory, help out the Browns, because Cleveland would be expected to win fewer games than the average team in Year N+1 because the Browns typically have a poor Year N performance. The best-fit formula was 0.311 + 0.376 * Yr_N_Pyth_Win%. This shows that regression to the mean is a large factor, because past performance only accounts for 38% of what goes into a team’s projection for Year N+1; the remainder is a constant for all teams.

Using Cleveland’s 2014 line as an example, the 2015 Browns would have been expected to win 7.6 games, because the 2014 team had 6.9 Pythagenpat wins, and regression to the mean drives that number towards 8 wins. But Cleveland won just 3 games last year, falling 4.6 wins shy of expectation. And that’s only the second-most disappointing season of the new Browns era: in ’08, Cleveland fell 4.7 wins shy of its Pythagenpat prediction. Take a look at every Cleveland season from 2000 to 2015 (obviously there was no prediction for ’99, since there was no ’98 team): [continue reading…]

{ 4 comments }

Yesterday, I measured the age of each team’s passing attack by calculating the yards-weighted age of each player who gained either a passing or receiving yard. Today, the historical results.

I’ve written a bit about Terry Bradshaw and his terrible rookie season of 1970, mostly in the context of number one picks taking a long time to break out. But here’s something that often gets lost in the mix: Bradshaw was just one of many inexperienced players on the ‘70 Steelers.

Bradshaw played as a rookie that year at age 22 (Terry Hanratty also started 6 games, and was also 22). The top 6 players in receiving yards on the ’70 Steelers were wide receiver Ron Shanklin (age 22), wide receiver Dave Smith (23), tight end Dennis Hughes (22), fullback John Fuqua (24), wide receiver Hubie Bryant (22), and wide receiver Jon Staggers (22). Incredibly, five of those six players were rookies, with Frenchy Fuqua being the sole exception — and he was drafted in 1969! In the ’70 draft, Pittsburgh took Bradshaw with the 1st overall pick, drafted Shanklin at 28, Staggers in the 5th round, and Smith in the 8th round, while both Hughes and Bryant were undrafted free agents that year. That’s unbelievable, and makes the ’70s Steelers passing attack akin to an expansion team — or rather, an expansion team with almost no access to the veteran market. As a result, Pittsburgh’s 1970 passing attack ranks as the youngest in history: [continue reading…]

{ 5 comments }

Bortles led the 2nd youngest passing offense in the NFL

Bortles led the 2nd youngest passing offense in the NFL

After a 1-4 start to the season, it might have felt like an odd time to write about how the Jacksonville Jaguars could have the next great offense. But in many ways, Jacksonville’s passing attack only got better as the season went along. Some (the majority?) of the big numbers were more of a function of quantity than quality, but the numbers really were big. Consider:

  • Blake Bortles finished tied for 2nd in passing touchdowns and 7th in passing yards
  • Allen Robinson finished tied for 1st in receiving touchdowns and 6th in receiving yards. He also had the highest yards per reception average of any player with 1,000 receiving yards
  • Allen Hurns also hit the 1,000-yard mark, and had the 6th highest yards per reception average of any player with 1,000 receiving yards. Hurns and Robinson were one of just four duos (Jets, Broncos, Cardinals) to have two players gain 1,000 receiving yards.

That’s an impressive trio by any standard, but what’s incredible is that Hurns was born in November of 1991, and he is the oldest of the three! So how young is the Jaguars passing attack compared to other teams? I have decided to create a passing yards-weighted age grade for each passing attack. And in doing so, I chose to count passing yards and receiving yards equally, which of course has the effect of making the quarterback(s) equal to half of the team’s passing game. I’m OK with that. [continue reading…]

{ 2 comments }

AV-Adjusted Team Age (Offense) from 2012-2015

Background:

In 2012, the Jaguars went 2-14 with an offense centered around Blaine Gabbert/Chad Henne, Maurice Jones-Drew, Cecil Shorts, and Justin Blackmon. Since then, the team has been rebuilt, and gotten better and younger. Among offensive players, only Marcedes Lewis was on the team during each of the last four years. I’ll have more on the Jaguars tomorrow, but given the way the Jets have moved from young and bad to old and good, I think that’s the more interesting team to analyze today.

Here’s how to read the table below. In 2012, the Jets offense had an age-adjusted AV of 26.9; that dropped to 26.4 in 2013, then rose to 27.5 in 2014 and up to a league-high 29.2 last season. That’s an average of 27.5, but more interesting (to me) is the variance of 1.1 years. [continue reading…]

{ 0 comments }

2015 AV-Adjusted Team Age

In each of the last four years, I’ve presented the AV-adjusted age of each roster in the NFL. Measuring team age in the NFL is tricky. You don’t want to calculate the average age of a 53-man roster and call that the “team age” because the age of a team’s starters is much more relevant than the age of a team’s reserves. The average age of a team’s starting lineup isn’t perfect, either. The age of the quarterback and key offensive and defensive players should count for more than the age of a less relevant starter. Ideally, you want to calculate a team’s average age by placing greater weight on the team’s most relevant players.

My solution has been to use the Approximate Value numbers from Pro-Football-Reference.com.  The table below shows the average age of each team, along with its average AV-adjusted age of the offense and defense. For the second year in a row, the Jaguars and Rams were the two youngest teams in the NFL; this year, though, the team formerly known as St. Louis took the top spot.

The average AV-adjusted team age last season was 27.1 years; the Rams (25.6) and Jaguars (25.8) were the only teams below 26, while the Jets (28.2) and Colts (28.6) were the only teams above 28 years. Here’s how to read the table below, using the St. Louis line: the Rams were the youngest team in the NFL in 2015, with an average age of 25.6 years as of September 1, 2015. The team’s offense had an AV-adjusted average age of 25.0, the youngest in the NFL, while the defense was at 26.0, the second-youngest. [continue reading…]

{ 2 comments }

Bob Ford, a longtime fan of Pro-Football-Reference and Football Perspective, has contributed a 2-part guest post on Yards Per Carry Leaders. Bob is the owner and founder of GOATbacks.com, which looks at the greatest running backs of all time. Thanks to Bob for yesterday’s and today’s articles!


Yesterday, I looked at the YPC leaders for the 46 seasons since the merger was completed, 1970-2015 at the 100/120/180-carry cutoffs. Today, a look at the YPC leaders since 1970 at three higher thresholds. [continue reading…]

{ 17 comments }

Farewell to one of the greats

Farewell to one of the greats

Detroit Lions superstar wide receiver Calvin Johnson has likely retired. He had a pretty incredible six-year peak: Megatron gained 8,548 receiving yards in his last six years, the most by any player during their age 25-30 seasons. I don’t think there’s much of a debate that Johnson is a Hall of Famer, although I do think he’s not quite an inner circle member of the Hall.

The big reason for that is Johnson’s numbers have always been inflated by playing on a pass-happy team.  I’ve looked at this before, but (a) those numbers are now two years stale and (b) I want to use a different methodology today. So here’s what I did:

1) Calculate the number of pass attempts per game for each team in every season.

2) For the top 200 players, I then calculated the number of career games for that player.

3) Then, in each season, weight the number of team pass attempts per game by the percentage of games that player played relative to his entire career. For example, Johnson played 11.9% of his career games in 2012, and that year, the Lions threw 46.3 pass attempts per game. Therefore, for Johnson’s career, 46.3 pass attempts per game will be given a weight of 11.9%. Do this for every season of each player’s career, and you will derive the average pass attempts per game for that player. [continue reading…]

{ 20 comments }

In 2015, the average points differential was just 11.06 points per game.  That may not mean much in the abstract, but it’s the lowest in 20 years.  Take a look:

pt diff 1950

What was driving the close games this year?  It’s mostly because the “losing teams” wound up scoring more points, but the average points scored by the winning team did dip slightly in 2015, too: [continue reading…]

{ 4 comments }

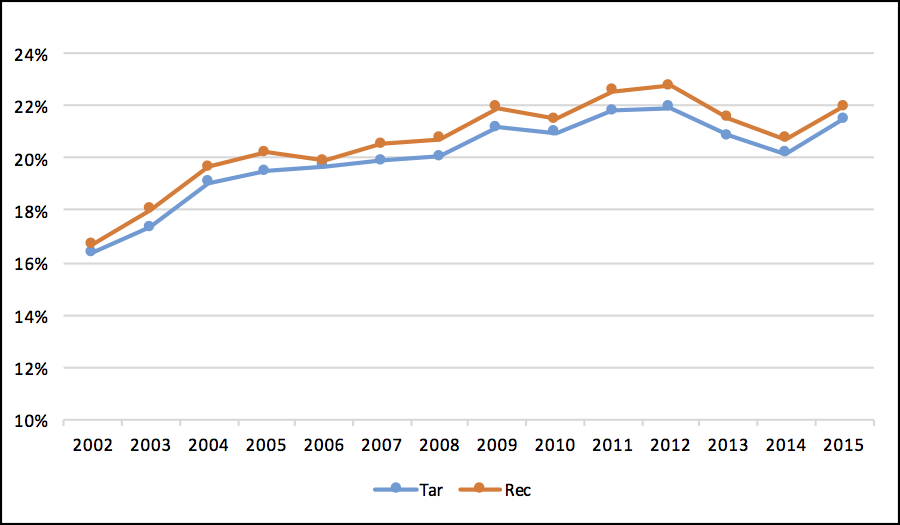
Yesterday, I posted some graphs on league-wide passing distribution. In that post, I noted that tight ends grabbed about 16% of all receiving yards in 2002-2003, but that number has increased to over 20% in recent years.  But that’s just receiving yards: as you might expect, targets and receptions have seen a similar climb:

te rec tar
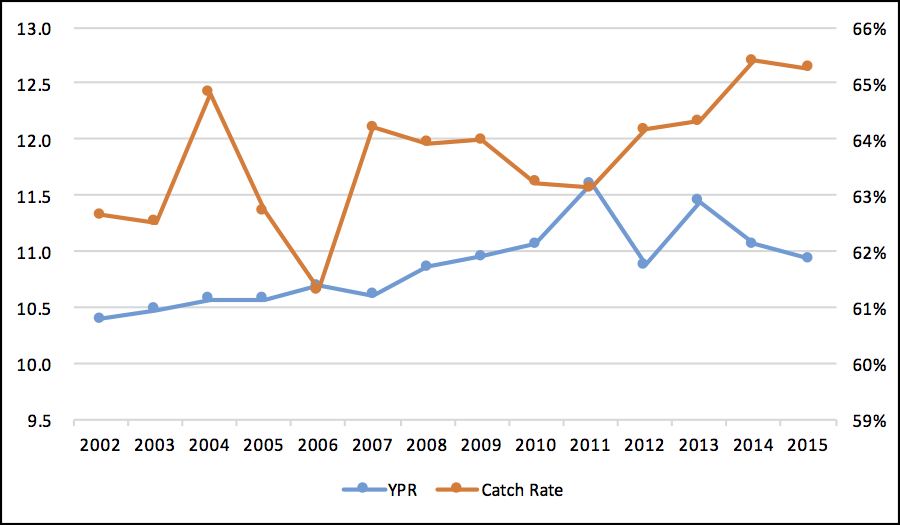
But more targets aren’t the only thing driving the increase.  Tight ends are also averaging slightly more yards per catch, too.  That increase has come despite the general decrease in yards per completion, so this may be a sign that tight ends are more athletic than they were 15-20 years ago, and that teams are sending them on more downfield rights.  In addition, catch rate has also been increasing, although in a more volatile way; still, tight ends are catching more passes, at higher rates, and for more yards.  In the picture below, yards per reception is plotted against the left Y-Axis, and catch rate is plotted against the right Y-Axis.
tar catch rate

Whatever the reason, tight ends seem to be a larger part of NFL offenses they were a decade ago, and for good reason: they’re getting better.

{ 1 comment }

Yesterday, Bob Ford wrote DeMarco Murray and, how his 2014 season stands out as a career outlier. Today, I want to look at where it stands among the biggest year-to-year declines.

I looked at all players who rushed for at least 5 games in consecutive years, and rushed for at least 60 yards per game in the first season. For example, Murray rushed for 1,845 yards in 2014, an average of 115.3 yards per game. Last year, in 15 games, Murray averaged only 46.8 rushing yards per game. That’s a dropoff of 68.5 rushing yards per game, which is the second most in NFL history. The first? That honor goes to Lee Suggs.

Suggs was a star at Virginia Tech, rushing for 27 touchdowns in 11 games as a sophomore at Virginia Tech before tearing his ACL as a junior. In his senior year, he had another great season, rushing for 1,325 yards and 22 touchdowns. He was a 4th round pick of the Browns in 2003, where he served as the team’s backup. In ’04, he stole the job from William Green, and rushed for over 100 yards in each of Cleveland’s final three games. He averaged 74.4 rushing yards per game in ’04, but lost his job to Reuben Droughns in ’05. As a result, Suggs saw his average decline by 72.5 yards per game, an even more dramatic dropoff than Murray. [continue reading…]

{ 3 comments }

2015 Billick/Coryell Team of the Year

In 2014, I came up with the Billick Index and the Coryell Index, which provide a simple measure of the degree to which a team is one-sided.

Let’s use the 2015 Broncos as an example. Denver’s offense scored 32 touchdowns this year, while the average offense scored 37.7. As a result, Denver’s offense was 5.7 touchdowns below average. Meanwhile, the defense allowed only 29 touchdowns, meaning the Broncos were 8.7 touchdowns below average here. Add those two together, and there were 14.4 fewer offensive touchdowns scored in Denver games than in the average 16 games in 2015.

That would put Denver pretty high on the Billick Index, which measures touchdowns scored at lower rates than average. The strongest Billick Index team was the Rams, who finished in the bottom five in offensive touchdowns scored and whose defense ranked in the top five in touchdowns allowed. There were just 55 touchdowns scored in St. Louis games this season.

But the Rams were not the most extreme team this year. Consider that the Saints allowed more touchdowns to opposing offenses — 57 — than offensive touchdowns scored in Rams games on both sides of the ball! [continue reading…]

{ 3 comments }

2015 Playoff Game Scripts Data

With the playoffs over, let’s take one last look at Game Scripts data from the 2015 season. Some high-level notes:

  • In the wild card round, all four road teams won. No road team won another game in the postseason.
  • Just two teams won playoff games this year with negative Game Scripts: the Broncos against the Steelers (-0.5) and the Seahawks against the Vikings (-2.5). The Steelers led 10-6 for much of the 2nd quarter, and 13-9 in the third quarter. In fact, Denver trailed 13-12 until there were three minutes left in the game. The frigid game in Minnesota was a tale of three quarters… and a disastrous fourth. The Vikings entered the 4th quarter up 9-0, but Seattle scored the final points of the game to emerge with a 10-9 win.
  • The most pass-happy game by a winning team in the playoffs? That came by the Patriots in the division round against the Chiefs. Even without adjusting for Game Script, it was pass-happy, but a 76.4% pass ratio with a +8.3 Game Script is incredible. Remember, New England attempted a pass on 24 of its first 26 plays, and the Patriots finished with just 10 non-kneel runs.

Below are the 2015 playoffs Game Scripts data: [continue reading…]

{ 12 comments }

Munir Mohamed, a reader of Football Perspective, is back for another guest post. And I thank him for it. You can read all of Munir’s posts here.


How do the Broncos stack up with the best playoff defenses?

The Broncos just capped off a run that saw the defense carry Peyton Manning and a below-average offense to a Super Bowl title. Denver held the highest scoring team in the league to just 10 points in the Super Bowl. As a result, debate ensued as to where the Broncos ranked among other great Super Bowl winning defenses. And just last week, Chase looked at the net points allowed by each Super Bowl champion. [continue reading…]

{ 30 comments }

Guest Post: Adam Harstad on Sammy Watkins

Today’s guest post comes from Adam Harstad, a co-writer of mine at Footballguys.com. You can follow Adam on twitter at @AdamHarstad.


It’s probably not really news at this point, but the 2014 WR class has been pretty good. How good?

Well, Jarvis Landry just broke the old record for receptions through two seasons… by 26 grabs. Jordan Matthews joined the short-list of receivers to top 800 yards and 8 touchdowns in each of their first two seasons, (a list which, since the merger, contained just five names prior to last year). Mike Evans joined Randy Moss and Josh Gordon as the only players in history with 2200 receiving yards through their age 22 season.

Allen Robinson just became the youngest player to top 1400 yards and 14 touchdowns in the same year. And 2nd-4th on that list? Randy Moss, Jerry Rice, and Lance Alworth.) Outside of the first two years of the AFL, no undrafted receiver in history has produced more yards or touchdowns in his first two years than Robinson’s teammate, Allen Hurns. [continue reading…]

{ 6 comments }

Friend of the program Bryan Frye is back for another guest post. As regular readers know, Bryan operates his own fantastic site, http://www.thegridfe.com. You can view all of Bryan’s guest posts here, and follow him on twitter @LaverneusDingle.


Despite a fourth trip to the Super Bowl, 2015 has been the worst year of Peyton Manning’s storied career. Statistically speaking, he has never been worse, even as a 22 year old rookie starting all sixteen games for a 3-13 team. [1]A team that also went 3-13 the prior year and earned the right to draft him first overall. Relative to league average, Manning produced the worst completion rate, yards per attempt, touchdown rate, interception rate, passer rating, and adjusted net yards per attempt of his career. [2]Using Pro Football Reference’s Advanced Passing Index Scores as my measurement of choice. Manning ranked last among the 36 qualifying passers in Adjusted Net Yards per Attempt. And his normally stellar sack rate also took a hit, with the second worst output of his career (behind only 2001). [3]Of course, being Peyton Manning, he was still better than average; his Sack%+ score was 110 in the regular season.

If we look to advanced metrics to try to uncover some hidden gem about his performance that may be overlooked by standard box score stats, we don’t have much luck. ESPN’s QBR (which only goes back to 2006, mind you) takes into account far more than any other popular metric, and it normally adores Manning. From 2006-2014 (excluding 2011, obviously), Manning ranked 1st, 3rd, 1st, 1st, 1st, 1st, 2nd, and 3rd in Total QBR. [4]Among all quarterbacks with at least 224 action plays. His second place rank in 2013 becomes a first place rank if you finagle the threshold to exclude Josh McCown’s 269 play, 85.2 QBR bout. This year, he ranked 30th with a subpar 45.0 rating.

Football Outsiders’ DVOA and DYAR don’t do Manning any favors either. Not only was 2015 by far the worst season of his career by both metrics, it was also the only below average season of his career. From 1998-2014, his average season was 32.47% better than average by passing DVOA. His worst season by the metric was a 7.70% effort as a doe-eyed rookie. Over that same period, he averaged 1,664 passing DYAR per season, and his average season was worth 2.89 DYAR per pass. [5]Using the average of his averages rather than a weighted average of all DYAR on all pass plays. The point here is to show his average season, not his average performance over the course of his career. This year, Manning was 26.00% below average, as measured by DVOA, and he lost 328 DYAR from his career total. His -0.95 DYAR per play was easily worse than his previous low of 1.18 in his inaugural season.

If the stats aren’t enough, the infamous “eye test” also backs up the belief that this was Manning’s worst-ever season. He struggled to jive with Gary Kubiak’s offense, especially when asked to run bootlegs and throw on the run. His limited power to make pre-snap adjustments, in concert with his decreased mobility, resulted in him taking more abuse in the pocket than he ever had before. [6]I covered this in more detail after his poor week 2 performance. You don’t have to call me a prophet, but I won’t stop you. He threw errant passes and made uncharacteristically poor decisions, causing him to lead the league in interceptions until week 17, despite missing six games. He struggled with nagging injuries, had the worst game of his entire career, and was benched for an inexperienced and marginally talented fourth-year backup. [continue reading…]

References

References
1 A team that also went 3-13 the prior year and earned the right to draft him first overall.
2 Using Pro Football Reference’s Advanced Passing Index Scores as my measurement of choice.
3 Of course, being Peyton Manning, he was still better than average; his Sack%+ score was 110 in the regular season.
4 Among all quarterbacks with at least 224 action plays. His second place rank in 2013 becomes a first place rank if you finagle the threshold to exclude Josh McCown’s 269 play, 85.2 QBR bout.
5 Using the average of his averages rather than a weighted average of all DYAR on all pass plays. The point here is to show his average season, not his average performance over the course of his career.
6 I covered this in more detail after his poor week 2 performance. You don’t have to call me a prophet, but I won’t stop you.
{ 35 comments }
Next Posts Previous Posts