≡ Menu

Manning/Brady 18 will use Manning's uniform number instead of Roman Numerals

Manning/Brady 18 will use Manning’s uniform number instead of Roman Numerals

Tom Brady and Peyton Manning have now played seventeen games against each other. Brady has posted an 11-6 record against Manning, which tends to fuel some of the Brady/Manning narrative. The beginning of their “rivalry” was dominated by Brady and the Patriots: from 2001 to 2004, New England went 6-0 against Indianapolis, including two playoff wins in the snow in Foxboro.

Those four seasons anchored the narrative for the 15-year rivalry of the two players. Since then, Manning has a 6-5 record against Brady, including a 3-0 mark in the playoffs. Each player has also won “only” one Super Bowl despite the two quarterbacks dominating the AFC for most of the last decade (Manning, of course, could win another next week).

The table below shows the statistics from both players for each of the 17 head-to-head games: [continue reading…]

{ 22 comments }

This pass probably wasn't completed.

This pass probably wasn’t completed.

In the NFC Championship Game, Carson Palmer was really bad.  He completed 23 of 40 passes for 235 yards, with three sacks that lost 8 yards.  That by itself is not very good — it translates to a 5.3 net yards per attempt average — but the real damage came when it comes to turnovers.  Palmer threw one touchdown againt four interceptions, giving him an Adjusted Net Yards per Attempt average of just 1.56.  And even that inflates things a bit, as Palmer also fumbled twice, with both fumbles being recovered by Carolina. On the season, Carolina allowed 4.46 ANY/A to opposing passers, the best in the NFL, so that does mitigate things a bit.  As a result, Palmer’s game is considered -125 ANY below expectation, because he was 2.9 ANY/A below expectation over 43 dropbacks.

That’s bad, but nowhere near as bad as the worst performance from even this year’s playoffs (Brian Hoyer) or the last Cardinals playoff loss (thank you, Ryan Lindley).  But the reason Palmer’s performance appeared so bad was precisely because it came from someone like Carson Palmer, and not a Hoyer or a Lindley.  Palmer, after all, was arguably the best passer in the NFL this season.  He led the NFL in Adjusted Net Yards per Attempt, at 8.11, which was 2.14 ANY/A better than league average. [continue reading…]

{ 33 comments }

2015 Team Efficiency Ratings

Let me begin with the ratings; then we’ll get to the explanation.

RkTeamOff RushOff PassOff AvgDef RushDef PassDef AvgTeam Avg
1Arizona Cardinals6.5211.129.515.47.76.92.61
2Carolina Panthers6.949.928.885.486.756.312.57
3Seattle Seahawks7.0810.319.185.227.636.792.39
4Cincinnati Bengals6.0310.398.866.37.346.971.89
5Kansas City Chiefs7.558.788.355.987.226.791.56
6New York Jets6.38.938.014.837.656.661.35
7New England Patriots6.3510.098.785.698.397.441.34
8Pittsburgh Steelers7.19.328.545.068.897.551
9Denver Broncos6.247.687.185.36.776.260.92
10Buffalo Bills7.189.058.396.88.527.920.47
11Houston Texans5.588.47.416.187.627.120.3
12Tampa Bay Buccaneers6.719.38.395.549.628.190.2
13Minnesota Vikings6.988.127.726.358.517.75-0.03
14Green Bay Packers6.298.137.496.518.067.52-0.03
15Oakland Raiders5.768.47.486.578.37.7-0.22
16Atlanta Falcons5.99.067.956.768.958.18-0.23
17Washington Redskins5.139.978.286.689.578.56-0.28
18Chicago Bears6.188.887.936.79.538.54-0.61
19St. Louis Rams6.447.266.975.918.537.61-0.64
20Detroit Lions5.538.987.776.69.458.45-0.68
21New York Giants5.759.27.996.479.948.73-0.73
22Miami Dolphins6.518.347.76.429.748.58-0.88
23San Diego Chargers5.039.067.657.259.348.61-0.96
24Jacksonville Jaguars5.558.547.496.149.728.47-0.98
25Philadelphia Eagles6.197.987.356.799.178.34-0.98
26Baltimore Ravens5.837.797.115.749.458.15-1.04
27New Orleans Saints6.5410.028.86.7211.559.86-1.06
28Indianapolis Colts5.497.456.776.18.967.96-1.2
29Dallas Cowboys6.647.547.237.029.368.55-1.32
30Tennessee Titans5.397.887.016.319.778.56-1.55
31Cleveland Browns5.877.847.156.710.319.04-1.9
32San Francisco 49ers5.757.496.886.9410.058.96-2.08

[continue reading…]

{ 6 comments }

In 1974, Terry Bradshaw was not very good. He threw for just 785 yards on 148 pass attempts, while throwing only 7 touchdowns against 8 interceptions. That translates to a 2.92 Adjusted Net Yards per Attempt average, which is terrible even for 1974. He ranked 25th in ANY/A among the 32 quarterbacks with at least 120 pass attempts. Given the league average of 3.91, that means Bradshaw finished the year with a Relative ANY/A of -0.99.

That’s the worst of any quarterback who wound up winning the Super Bowl. But that doesn’t mean Bradshaw wasn’t a big part of why Pittsburgh won its first title. He was excellent in the team’s three playoff games, particularly in Pittsburgh’s first win. [continue reading…]

{ 11 comments }

Courtesy of Bryan Frye, let’s look at some graphs of the four quarterbacks in the conference championship games. The stat we will be using today is Total Adjusted Yards per Play, which is like ANY/A on steroids.

First, let’s start with Cam Newton. His Total Adjusted Yards per Play is in blue; the average TAY/P allowed by his opponent each week is in black. As you can see, in 6 of 17 games, he was below-expectation, but he’s been above-expectation in five of his last six games. (Note that for each quarterback, the bye week is included, and the division round matchup is plotted below as Week 18.) [continue reading…]

{ 3 comments }

Guest Post: Marginal YAC, 2015 in Review

Adam Steele is back to discuss Marginal YAC, this time in the context of the 2015 season. You can view all of Adam’s posts here.


Marginal Air Yards: 2015 Year In Review

Today I will be updating my Marginal Air Yards metric for the now completed 2015 season. New readers who aren’t familiar with Marginal Air Yards can get up to speed by reading my three part intro-series and 2014’s year in review.

There were 44 quarterbacks who threw at least 100 passes in 2015, and they are ranked by mAir below: [continue reading…]

{ 15 comments }

Friend of the program Bryan Frye is back for another guest post. As regular readers know, Bryan operates his own fantastic site, http://www.thegridfe.com. You can view all of Bryan’s guest posts here, and follow him on twitter @LaverneusDingle.


The 2015 regular season is in the books, and all the relevant stats are at our disposal to poke and prod as our hearts desire. Chase already discussed the fact that, statistically, this has been the best passing season in NFL history. League and team passing records fell on a seemingly regular basis, and a few receiving records were in serious jeopardy by season’s end. [1]We probably all know by now that Julio Jones and Antonio Brown became just the third and fourth receivers ever to break the 1,800 yards mark in a single season. It’s also pretty common knowledge … Continue reading [continue reading…]

References

References
1 We probably all know by now that Julio Jones and Antonio Brown became just the third and fourth receivers ever to break the 1,800 yards mark in a single season. It’s also pretty common knowledge that the two dynamic receivers also tied for the second most receptions in a single season. However, what you won’t hear in the mainstream is that Jones happened to break one of the more significant single season records when he hauled in his 93rd receiving first down in week 17.
{ 16 comments }

Houston/Kansas City

Last year, after the Ryan Lindley disaster in the playoffs, I looked at the worst passing performances in playoff history.  At the time, Lindley had the 9th worst passing game ever.  Well, now it’s the 10th.

Against Kansas City yesterday, Brian Hoyer completed 15 of 34 passes for just 136 yards with 0 touchdowns and 4 interceptions. He also lost a fumble on his three sacks, which lost 17 yards.  Calculating Adjusted Net Yards per Attempt doesn’t factor in fumbles, but Hoyer still finished with -68 Adjusted Net Yards for Brian Hoyer on those 37 dropbacks.   That’s a -1.84 ANY/A average.  On the season, Kansas City allowed 4.91 ANY/A. [continue reading…]

{ 4 comments }

Week 17 Game Scripts: The Patriots Get Run Heavy

Week 17 often brings about weird results, and this year was no different. Seattle posted a Game Script of +17.6 against Arizona, which is an extreme outlier. Consider that the Cardinals had just one negative Game Script in the team’s first 15 games, a -3.8 score against St. Louis back in week 4.

Oh, and the Patriots do something really crazy (for them), but we’ll get to that in a bit. For now, the week 17 Game Scripts data. Note that this page is now updated to include the Game Scripts data from each of the 256 games this season. [continue reading…]

{ 1 comment }

This week at the New York Times, a look at how this season was, yet again, the best passing season in history:

First, a look at quantity. N.F.L. teams averaged 35.7 pass attempts per game, the most in league history, breaking the record of 35.4 set in 2013. Teams used those attempts to also set per-game records for completions (22.5) and passing yards (243.8). Passing touchdowns per game were also at a new N.F.L. high. The record had been 1.63 a game, set, remarkably, in 1948. The league had been inching toward that mark — teams averaged 1.57 and 1.58 passing touchdowns per game in 2013 and 2014 — before surpassing it with 1.64 passing touchdowns per game in 2015.

For the first time in N.F.L. history, 12 quarterbacks threw for 4,000 yards. In addition, 11 quarterbacks threw at least 30 touchdown passes; that breaks the record of nine set last season. Before 2014, no N.F.L. season had more than five quarterbacks with at least 30 touchdown throws.

You can read the full article here.

{ 4 comments }

Teddy Bridgewater and Quarterback Help

No offense has had it easier this year than the Denver Broncos. What do I mean by that? Denver ranks 4th in points allowed, at 276, but that’s a little misleading. The Broncos have thrown three pick sixes, all from Peyton Manning, and those have put 20 points on the scoreboard (one pick six was followed by a failed two-point attempt). In addition, Denver’s defense/special teams has scored six touchdowns. Those obviously go in the “Points Scored” column for Denver, but in terms of the offense, they didn’t earn those points. So instead, let’s subtract all non-offensive touchdowns scored by the Broncos by the points allowed by Denver. Do that, and the Broncos defense has allowed 214 net points, after excluding pick sixes and crediting the defense for non-offensive touchdowns.

That’s the fewest in the NFL. Last offseason, I wrote an article about Andrew Luck and quarterback help.  It was pretty basic, but I found it interesting enough to recreate today.  Here is the methodology: [continue reading…]

{ 13 comments }

Nobody wants to watch this Saints defense with their eyes open

Nobody wants to watch this Saints defense with their eyes open

In short, maybe.

New Orleans has allowed 4,217 passing yards this year (which includes yards lost by the opposing team on sacks) on 538 dropbacks, which is already pretty bad.  That translates to a 7.84 Net Yards per Attempt allowed average, which is the worst in the NFL by half a yard per attempt.  But where things get really bad is in touchdowns and interceptions.  New Orleans has allowed an unbelievable 43 passing touchdowns through 15 games, the most in NFL history. In addition, the Saints have intercepted just 8 passes, tied for third fewest in the league this year.

That translates to an 8.77 Adjusted Net Yards per Attempt average, after giving 20 yards for each touchdown pass and subtracting 45 yards for each interception.  That is, by a decent measure, the worst rate in NFL history.  The current record belongs to the 0-16 Detroit Lions, who allowed 8.53 ANY/A.  Only three other teams — the ’81 Colts, the ’69 Saints, and the ’63 Broncos — have even allowed 8.00 ANY/A over a full season. [continue reading…]

{ 4 comments }

Week 16 Game Scripts: Denver Flips The Game Script

In week 14, no team lost with a better Game Script than Denver. The Broncos dominated the Raiders in the first half, although the team only took a 12-0 lead into the locker room. Oakland came back to win, 15-12, despite Denver posting a +3.5 Game Script.

In week 15, no team lost with a better Game Script than Denver. The Broncos held a 27-10 lead over the Steelers in the 2nd quarter, but wound up losing, 34-27, despite a Game Script of +5.0.

In week 16, no team won with a worse Game Script than Denver. The Bengals dominated the game early, jumping out to a 14-0 lead that looked even more impressive than on the scoreboard. But Denver battled back, and won, 20-17, in overtime, despite a Game Script of -5.2.

And yet, despite three straight weeks of crazy comebacks, it was five weeks ago that produced the oddest game of Denver’s season: against New England, the Broncos won with a Game Script of -7.1.

There have been just 18 games this season where the winning team posted a Game Script of -3.5 or worse, and Denver has been involved in four of those games.

Below are the Game Scripts data from week 16. As always, you can view the full season results here. [continue reading…]

{ 1 comment }

Week 15 Game Scripts: Carolina Goes Pass-Heavy

Let’s get to the Week 15 Game Scripts data! As always, you can view the full season data here.

TeamH/ROppBoxscorePFPAMarginGame ScriptPassRunP/R RatioOp_POp_ROpp_P/R Ratio
WASBUFBoxscore35251013.7292751.8%323150.8%
STLTAMBoxscore3123813.2193336.5%502665.8%
NWETENBoxscore33161713372658.7%392066.1%
SDGMIABoxscore30141612.6373650.7%371966.1%
DET@NORBoxscore3527812.4282354.9%531874.6%
KAN@BALBoxscore34142010.2282850%471971.2%
CIN@SFOBoxscore24141010.1253641%541776.1%
MINCHIBoxscore38172110.1213537.5%422067.7%
ARI@PHIBoxscore4017239.9353947.3%432068.3%
CAR@NYGBoxscore383538.8482863.2%462763%
SEACLEBoxscore3013176.3323547.8%351767.3%
GNB@OAKBoxscore3020105.8412859.4%502566.7%
ATL@JAXBoxscore231764.9363352.2%402066.7%
NYJ@DALBoxscore191630412661.2%352162.5%
HOU@INDBoxscore16106-3.3313745.6%351964.8%
PITDENBoxscore34277-5581777.3%462465.7%

Let’s break teams down into two categories: [continue reading…]

{ 1 comment }

After ten weeks, I calculated the pass identities of every team in the NFL. At the time, I noted that it was weird how Denver was the 4th most pass-happy team in the NFL despite, you know, Peyton Manning playing like the worst quarterback in football and the Broncos owning the league’s top defense. Of course, there’s one problem: the Broncos rushing attack is pretty bad, too.

Since then, the Broncos have played three games. The first came against the Bears, who have a terrible rush defense. As a result, Ronnie Hillman and C.J. Anderson rushed 33 times for 161 yards, and the Broncos ran on over half of their plays. The next week, against the Patriots, things changed dramatically after Dont’a Hightower went down:

As masslive.com’s Kevin Duffy noted, the Broncos ran the ball 15 times for a total of just 43 yards with Hightower in the lineup. After Hightower left, Denver ran the ball 17 times for a whopping 136 yards, averaging an even 8 yards per carry. Three of Denver’s four touchdowns came on the ground, including a sweep that produced two long scores from short yardage on second-and-1 and third-and-1.

Denver trailed 21-7 at the start of the 4th quarter, but wound up winning the game, in large part thanks to the rushing attack. Of course, with #QBWinz being what they are, Brock Osweiler received a lot of credit for running his record to 3-0. Then, the Raiders game happened.

Denver dominated the Raiders in the first half, as Oakland gained negative 12 yards — that’s NEGATIVE TWELVE YARDS — in the first 30 minutes. But the Broncos only led 12-0, in part because of the team’s struggles on the ground. Hillman and Juwan Thompson finished the game with 17 carries for just 28 yards. Meanwhile, Osweiler recorded 56 pass attempts! In some ways, it is incomprehensible that a team could have a positive Game Script, a 12-0 half time lead, and yet put the ball in the hands of its first-year starting, below-average quarterback 39 more times than in the hands of all of your running backs combined. But when your running backs are averaging 1.6 yards per carry, there may not be much of an alternative.

Osweiler struggled, of course, finishing with 4.92 ANY/A on his 56 pass attempts, and also taking a safety, while Denver went just 4-18 on third downs. The Broncos passed a ton under Manning despite Manning struggling all season; now, with the running game ineffective, the same thing is happening under Osweiler (to be fair, there were a number of drops by the Broncos receivers, making this more of a passing game issue than a pure quarterback issue). The Broncos defense is awesome, but the team may not be able to get very far if the offense is throwing on 70%+ of its plays. Anderson missed the Raiders game with an ankle injury, and while he hasn’t been the star back he was at the end of last year, the Broncos offense sorely needs a healthy Anderson.

Below are the week 14 Game Scripts data:
[continue reading…]

{ 1 comment }

The 2007 Patriots set all sorts of records, and are as good as you remember.  In fact, that New England team was even great when compared among great teams.  Through 13 games, the Patriots outscored opponents by 281 points, by far the best differential among teams since 1970.  Carolina’s +168 points differential, while good enough to lead the league in 2015, looks downright unimpressive by comparison.

But what’s often forgotten about that New England team is that it slowed down considerably during the season, perhaps due to age (the Patriots were the third oldest team in the NFL that year, by AV).  In case you forgot:

  • The 2007 Patriots outscored opponents by 25.4 points per game in New England’s first 10 games.
  • In the team’s final six games, the Patriots outscored opponents by 10.2 points per game.
  • In three playoff games, New England outscored opponents by 5.7 points per game.

We think of the ’07 Patriots as a dominant team, and they of course were.  But they were also a team that ran out of gas as the season went along, culminating in the Super Bowl loss.  New England covered the point spread, often by large amounts, in nine of the team’s first ten games. Then, the Patriots covered the spread in just one of New England’s final nine games.   While the ’07 Patriots were one of the greatest teams in football history, it’s also true that their story was a tale of two halves: an absurdly dominant first half, and a less-than-overwhelming second half, that failed to meet expectations. [continue reading…]

{ 20 comments }

2015 And Unique Scores

A fun couple of articles for you to read today, courtesy of Eldorado (@eldo_co) (with a hat tip to Football Outsiders).

Part I

Part II

The full articles are worth your read, but the premise: a record number of made field goals, a high number of missed extra points, and a ton of successful two-point conversions have lead to a record low number of “Football Scores.”

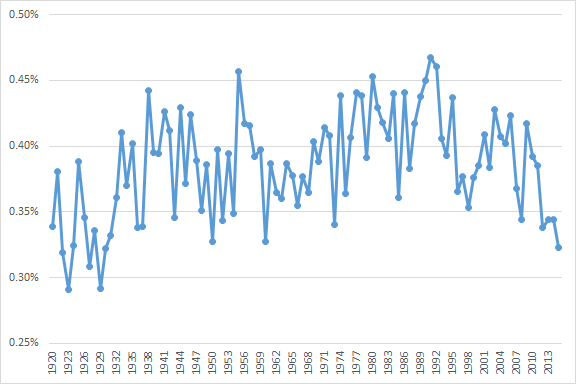
I wanted to run my own numbers on this, and while the effect using my methodology isn’t quite as extreme, 2015 does still stand out. I looked at the likelihood of every score occurring in NFL history (for example, (20-17 has occurred 1.6% of the time throughout NFL history, 17-14 and 27-24 1.3%, 23-20 and 13-10 at 1.1%, and so on). I then took the average likelihood of each score in each season, plotted below:
unique scores

From 1995 to 2014, the “average” final score score had a 0.38% likelihood of occuring; this year number has dropped to 0.32%. Again, that’s not quite as extreme as Eldorado’s results, but it is consistent in direction: 2015 is having some very unusual scores. In fact, the last time the average rate was at 0.32% was in 1930. This year, Tennessee beat Jacksonville 42-39, Pittsburgh beat San Francisco 43-18, and Pittsburgh beat Seattle 39-30; in each instance, those scores had never occurred before in NFL history.

{ 1 comment }

Cam waits for the 4th quarter to arrive

Cam waits for the 4th quarter to arrive

In the 4th quarter and in overtime this year, Carolina quarterback Cam Newton has been really, really good.  Newton has completed 54 of 83 passes for 733 yards with 6 touchdown throws and just one interception, along with five sacks for -35 yards.  Newton is therefore averaging an impressive 8.78 Adjusted Net Yards per Attempt after 45 minutes have gone by in each game; among quarterbacks with at least 40 pass attempts this year, that’s the second best average in the league, a hair behind Tom Brady (8.81) and just ahead of Carson Palmer (8.59). (Although I will note that noted clutch quarterback Tony Romo is averaging 9.77 ANY/A on 21 4th quarter/overtime pass attempts this year.)

Below are the passing stats from every quarterback this year in the 4th quarter and overtime so far in 2015: [continue reading…]

{ 7 comments }

Last Thursday, the Lions hosted the Packers, and jumped out to a 17-0 lead before the end of the first quarter. A field goal attempt midway through the 3rd made it 20-0, although the Packers then responded with two quick scores. With seven minutes left in the 4th, Detroit made it a 9-point game, and seemed to have this one locked up. In fact, when the clock hit triple zeroes, the Lions were ahead, 23-21.

Of course, a phantom face mask penalty meant the game was not yet over, and Green Bay won on the final play of the game. For the game, Green Bay had a Game Script of -10.1, which represents the average score in the game, from the Packers perspective, across the 3600 seconds of action. That’s the worst Game Script by a winning team since San Diego won in similarly remarkable fashion against the 49ers in week 16 of the 2014 season.

Below are the Game Scripts data for week 13: [continue reading…]

{ 3 comments }

Antonio Brown, after hearing he leads the league in ACY/TmAtt

Antonio Brown, after hearing he leads the league in ACY/TmAtt

Last year, Antonio Brown edged Jordy Nelson in Adjusted Catch Yards per Team Attempt by a few thousands of a yard. Brown beat Nelson for the True Receiving Yards crown in 2014, too, repeating as champion after a great 2013 campaign. Antonio Brown is awesome, so seeing him lead the league in a metric isn’t very surprising anymore. But let’s run through the process for new readers.

  • We begin with each player’s number of receiving yards. Then, we add 20 yards for every touchdown catch, and 9 yards (here’s why) for every first down gained (other than first downs that resulted in touchdowns). For Brown, this gives him exactly 1,900 Adjusted Catch Yards, as he has totaled 1,310 receiving yards, 57 first downs (including touchdowns), and 7 touchdowns this season.
  • Next, we divide that number by the number of team pass attempts, excluding sacks, [1]Why am I excluding sacks? Just to save time. In the offseason, I will re-run these numbers and include sack data. by that player’s offense in the games he played. Now Brown hasn’t missed a game this season, so it’s pretty simple: Pittsburgh has thrown 426 passes so far in 2015, which means Brown is averaging 4.46 ACY/TmAtt. By comparison, Julio Jones — who leads all players in Adjusted Catch Yards with 2,016 (1,338 receiving yards, 68 (!) first downs, 6 touchdowns) — is averaging “only” 4.21 ACY/TmAtt, because the Falcons have thrown 479 passes. Think of it this way: Jones has essentially played in one more, super high-volume passing game than Brown, yet has “only” 116 more Adjusted Catch Yards than him (and Brown is averaging 158 ACY/G). As a result, after adjusting for pass attempts, Brown is number one in this metric.
  • One player who really stands out by looking at Adjusted Catch Yards per Attempt but excluding games that player missed is Alshon Jeffery. The Bears wide receiver has had a somewhat quiet season: after all, he’s scored just two touchdowns and has missed five games. But the Bears have been pretty run-heavy this year, and Jeffery has been a first down machine. He has 47 catches for 690 yards and 37 first downs, good enough for 1,045 Adjusted Catch Yards in seven games. Chicago has thrown only 236 pass attempts in those games, giving Jeffery a remarkable 4.43 ACY/TmAtt average this year. Thought of another (perhaps simpler) way, Jeffery ranks 3rd in the NFL in receiving yards per game. In fact, the Bears have totaled just 49% of the pass attempts in Jeffery games as the Falcons have in Jones games, while Jeffery has 52% as many ACY. As a result, he slides past Jones into the number two slot.

[continue reading…]

References

References
1 Why am I excluding sacks? Just to save time. In the offseason, I will re-run these numbers and include sack data.
{ 4 comments }

In week 1, the Titans blew out the Bucs, in Tampa Bay, by the score of 42-14. Right now, the Bucs have an SRS rating of -5.9, but the Titans are even worse, at -7.7. Given the location of the game, we would “expect” Tampa Bay to have defeated Tennessee by about five points. So with the Titans winning by 28 points, that means Tennessee exceeded expectations by about 33 points. That’s the largest outlier of any game this year. Note that the Titans exceeded expectations by 36.5 points in week 1 of 2014, making it the second least-conforming game of last season.

Let’s start with the SRS ratings, presented below. These are through week 12, but also include the Packers/Lions game from Thursday night. [continue reading…]

{ 11 comments }

New York Times Checkdowns: Packers/Lions Preview

In advance of tonight’s game, some thoughts on the Lions and Packers have been trending in very different directions.

At the end of October, the Packers were 6-0 and Super Bowl front-runners. Little has gone right for the team since: Green Bay has won only one of their last five games, with the passing game being the biggest reason for the team’s struggles. The Packers have been defined by Aaron Rodgers, but the efficiency of the passing attack has declined significantly since the start of the season. Rodgers’s adjusted net yards per attempt has been trending in the wrong direction.

When the Lions met the Packers in Week 10, they were 1-7 and had not won on the road against the Packers since 1991. The Packers were 10.5-point favorites, but Detroit was victorious that day, marking the largest upset of the season to date. The Lions followed that win up with two more.

You can read the full article here.

{ 0 comments }

WP: Pre-Week 13 – Time of Knockout

One of my favorite articles of the year is now live at the Washington Post.

Many games are decided in the final minutes. For proof, look no further than the Baltimore Ravens. While the team is just 4-7, Baltimore has played a truly remarkable set of games. Every Ravens game this year has been either tied in the final two minutes, or seen the trailing team possess the ball in a one-possession game. The Ravens won their last two games on the final play; another two Ravens games went to overtime. A fifth game, against Jacksonville, saw Baltimore lose on the final play of the game, and losses to Arizona and San Francisco were decided in the final 15 seconds.

It has been a remarkable roller coaster ride for Ravens fans. It also means the team’s record can be a bit deceiving.

Games decided in the final few minutes can be a bit of a crap shoot: the difference between winning and losing can down down to one play, and often, one play that’s the result of an unsustainable set of factors. Conversely, if a team can knock out its opponent early, that’s a pretty good indicator of team strength. So what’s the best way to measure how early (or late) in games the winning team puts the game away?

You can read the full article here.

{ 0 comments }

Week 12 went down as the most pass-happy week of the season. Most weeks this year have fluctuated with a pass ratio in the neighborhood of 59%, but teams attempted passes on over 62% of all plays in week 12. As a result, a number of teams — New England, Pittsburgh, Jacksonville, Cleveland, New Orleans, Miami, the Giants, and Detroit — all graded as very pass-happy. On the flip side, just two teams (the Eagles and Vikings) were run-heavy.

Brock Osweiler, shockingly, helped the Broncos pull off one of the biggest comebacks of the year. Denver trailed New England 21-7 in the 4th quarter, and you simply don’t expect the Patriots to give up a lead of that size. But the Broncos, powered by both Osweiler and the running game, pulled off the win despite having a -7.1 Game Script, making it the third largest comeback (as measured by Game Script) of 2015.

The other thing that stood out this week: there were a lot of blowouts! Five teams won handily, with 18 point margins of victory and double-digit game scripts. In addition, Washington won with a 9.4 Game Script, although the Giants made a game of it at the end. Below are the week 12 Game Scripts data! [continue reading…]

{ 3 comments }

Analyzing Team Stats Through 11 Weeks (And 3 Games)

The Carolina Panthers defense is really, really good. Let’s begin with the pass defense. Carolina has faced 444 pass attempts, and allowed 2,462 yards, 13 TDs, and 18 INTs. Carolina has also sacked opponents 33 times for 199 yards. That translates to an impressive 4.0 ANY/A allowed average, the best in the league. But let’s try to get a more precise measure of the passing game. First, we can add passing first downs: Carolina has allowed 134 of those (including the 13 TDs), so let’s add 9 yards for each non-TD first down allowed. Then, we should remove the 4 spikes the defense has faced. [1]Thanks to the great Bryan Frye, of The GridFe, for the spikes and kneels data. Now, Carolina has allowed 6.34 Adjusted ANY/A. That may not mean much in the abstract, so here’s some context: Denver has allowed 6.31 Adjusted ANY/A, and the Cardinals are 3rd at 7.27 ANY/A. The Chiefs, Jets, and Rams are the only other teams that have allowed less than 8 Adjusted ANY/A. So the Carolina pass defense has been pretty fantastic.

What about the run defense? Carolina has faced 255 rush attempts, and allowed 976 yards, 7 TDs, and 49 first downs. The Panthers are also the only team in the league that has not faced a kneel, but for every other defense, we need to back out those data as well. Therefore, using 20 yards per touchdown and 9 per (non-TD) first down, Carolina has allowed 5.86 Adjusted YPC this season. That’s the second best mark in the league, behind only Baltimore.

In the graph below, I’ve plotted each team’s defense.  The X-Axis represents Adjusted ANY/A allowed, while the Y-Axis shows Adjusted YPC allowed.  Given that I like to see the best units in the upper right corner, I have plotted all values in reverse order. [continue reading…]

References

References
1 Thanks to the great Bryan Frye, of The GridFe, for the spikes and kneels data.
{ 3 comments }

Week 11 Game Scripts: Analyzing Patriots/Bills 2

In week 11, there were four large blowouts from a Game Scripts perspective: Carolina over Washington, Seattle over San Francisco, Tampa Bay over Philadelphia, and Kansas City over San Diego. There were also two large comebacks: Baltimore won with a -4.6 Game Script: the Ravens trailed 13-3 entering the 4th quarter, and took the team’s only lead after the clock hit triple zeroes. The Colts trailed 14-0 and 21-7 against the Falcons, and ultimately won with a -5.9 Game Script.

Below are the Game Scripts data from week 11. There were no extreme results this week: every team passed on between 41% and 76% of all plays. So let’s take a different approach this week. After ten weeks, I calculated the pass identities of each of the 32 teams. Well, week 11 brought a fascinating matchup from a Game Script perspective in New England/Buffalo. Let’s take a look: [continue reading…]

{ 0 comments }

The math has been clear for so long, and been presented by so many writers, that this topic is essentially beating a dead horse. Late in games, it has always made sense for a team, after scoring a touchdown to cut a lead from 14 to 8 points, should go for two. The trailing team gets two bites at the apple: if it converts, a touchdown now wins the game. If the team fails, they get a second chance to erase that mistake. Only if the odds of missing *both* attempts were higher than the odds of making the first attempt would this strategy fail to make sense.

Yet it never happens. In fact, Brian Billick with the 2001 Ravens was the last coach to go for 2 late in a game after scoring a touchdown to cut the lead to 8 points.

More astonishingly, just once since the 2-point conversion rule was introduced in 1994, has a team ever been trailing by 14 points, scored a touchdown, and then converted a 2-point attempt. Once! And it came by none other than Bill Belichick as coach of the 1994 Cleveland Browns.

Trailing 20-6 in the 4th quarter against the Denver Broncos, the Browns were in a tough spot. Starting quarterback Vinny Testaverde was out with a concussion, leaving Mark Rypien as the team’s hope for a comeback. After a Cleveland touchdown early in the fourth, Rypien hit Derrick Alexander to cut the lead to 20-14. [continue reading…]

{ 18 comments }

Week 10 Game Scripts – The Saints Give Up

Reminder: the 2015 Game Scripts page is now updated.

Drew Brees threw just 28 passes last week, and was sacked two more times. For some teams, that’s not unusual, but the Saints have always been very pass-happy under Brees. In fact, since Brees came over in 2006, there have been only 48 games where New Orleans had less than 35 pass attempts (excluding sacks). In only four of those games were the Saints losing after three quarters, and in only one of those games were the Saints trailing by more than 7 points through three quarters.

Until Sunday. New Orleans trailed by 23 points entering the 4th quarter, which would be prime territory for a pass-happy game for most teams. In fact, since 2006, there had been 31 games where New Orleans trailed by double digits entering the 4th quarter; on average, the Saints threw 45 passes (excluding sacks) in those games, with only one game (a 29-attempt game in week 17 against Carolina in 2009 which Brees did not play in) coming in with fewer than 36 attempts!

That makes the Saints game in week 10 all the more remarkable. A 28-pass attempt game by Brees when the Saints get blown out? That’s unheard of. The Saints ran Tim Hightower on the game’s final seven plays. Running out the clock while getting blown out is one strategy, I suppose. Obviously New Orleans wasn’t going to win once they were down by 33 points, but it is pretty rare to see a team just sit on the ball like that. Frankly, they would have been better off from a health perspective having Brees take a knee on each play.

Below are the Game Scripts data from week 10.

TeamH/ROppBoxscorePFPAMarginGame ScriptPassRunP/R RatioOp_POp_ROpp_P/R Ratio
KAN@DENBoxscore29131616.4333250.8%491675.4%
WASNORBoxscore47143313.9283147.5%302554.5%
PITCLEBoxscore3092111.3382164.4%511478.5%
CHI@STLBoxscore3713248.5263741.3%372163.8%
MIN@OAKBoxscore3014167.1263344.1%451970.3%
BUF@NYJBoxscore221755.5313249.2%352459.3%
ARI@SEABoxscore393275.5503360.2%341865.4%
CAR@TENBoxscore2710175.2313447.7%251956.8%
DET@GNBBoxscore181621.8382560.3%641878%
JAX@BALBoxscore222020.8482268.6%462168.7%
HOU@CINBoxscore1064-0.4362559%412166.1%
NWE@NYGBoxscore27261-1.4452366.2%472367.1%
TAMDALBoxscore1064-2.2402660.6%332161.1%
MIA@PHIBoxscore20191-3.7392660%523559.8%

In addition to New Orleans, Chicago was a team that checked out as very run-heavy. The Bears ran 37 times and on 69% of all plays; both numbers were the highest of any team in week ten.

On the other side, the Steelers and Browns were both very pass-happy. Cleveland passed nearly 80% of the time, which is very high even given the -11.3 Game Script. Meanwhile, the Steelers still passed on 64% of all plays. Then again, neither team could get the running game going: the Browns rushed 14 times for 15 yards, while Pittsburgh produced an only-good-by-comparison 21 for 60 stat line.

Green Bay threw on 78% of all plays in a game that was close throughout with the Lions. And Jacksonville and Baltimore both threw on just over two-thirds of their plays in a game that was close throughout. This isn’t too surprising, though, as all three of these teams have exhibited pass-happy tendencies in the past.

{ 1 comment }

WP: Pre-Week 11 – Stats Comparison


This week at the Washington Post, comparing how teams are faring this year in DVOA, the SRS, and ESPN’s new FPI:

The Patriots and Panthers are the two remaining undefeated teams in the NFL, but many stats-based rating systems do not have them as them as the top two teams in football.

Bill Parcells famously said: “You are what your record says you are.” That tautology makes for a good sound clip, but for a very boring set of rankings.  For determining which teams should make the postseason, it makes sense to focus on records.  But for predicting how teams will play in the future, there’s no need to be bound by the binary result from each game.  Today, let’s compare how teams fare in terms of record and three rating systems: the Simple Rating System ratings from Pro-Football-Reference.com, the DVOA ratings from Football Outsiders, and ESPN’s Football Power Index ratings.

You can read the full article here.

{ 0 comments }

How many interceptions will a team throw in a game?  That’s dependent on a number of things, of course, but I want to focus on three things: how interception prone the team is, how interception prone the opposing defense is, and the Game Script.

Suppose you knew what the Game Script of a game would wind up being; given that you have a general sense of the offense’s and defense’s interception rates, what weight would you put on each variable to predict a team’s interception rate?

The same is true for other statistics.  For example, what about rushing yards?  How many yards would you project Team A to run for against Team B, if you knew the rushing stats for  Team A’s offense, Team B’s defense, and the Game Script?

Or passing yards.  Or completion percentage.  The interplay between offense and defense is always interesting — some research suggests about 60% of the result is due to the offense, with 40% based on the defense — but throwing in Game Scripts adds an interesting element.

Oh, and one final thought: how would you go about trying to answer these questions.  What studies would you run?  What would you like me to do?

{ 8 comments }
Next Posts Previous Posts