The 2014 Cowboys had a lot of continuity on offense. Each of the team’s 11 main starters on offense started at least 11 games. Quarterback Tony Romo started 15 games, while running back DeMarco Murray, wide receivers Dez Bryant and Terrance Williams, and tight end Jason Witten each started 16 games. The sixth non-lineman starter was usually James Hanna who started 12 games, but even that sells the team short. Hanna played in all 16 games, but started only 12; in four other games, Dallas instead started off with either slot receiver Cole Beasley, third-string tight end Gavin Escobar, or fullback Tyler Clutts on the field over a healthy Hanna.
On the offensive line, Tyron Smith, Travis Frederick, and Zack Martin each started 16 games and made the Pro Bowl; left guard Ronald Leary started 15 games, with the most major injury hitting right tackle Doug Free, who missed three games in the middle of the year with a foot injury, and the final two games (and both playoff games) with an ankle injury.
Things were only slightly hairier on defense. In the secondary, safeties Barry Church and J.J. Wilcox started every game, while cornerback Brandon Carr also played the full slate. Orlando Scandrick started the final 14 games of the year at corner after being suspended for the first two games of the year.
On the defensive line, Jeremy Mincey and Nick Hayden started 16 games, Tyrone Crawford started 15, and George Selvie started 13 games (but played in all 16). The most serious injuries came at linebacker: Rolando McClain started 12 games, Anthony Hitchens started 11, and Bruce Carter started 8 games. Of course, Sean Lee also missed the entire season after tearing his ACL in May.
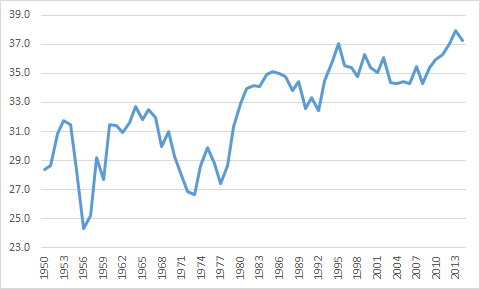
If you sort the Cowboys roster by number of starts, the top 22 players started 318 games, or 14.5 games per play. That, as you might have guessed, was the most of any team last season:
While Dallas looks pretty good in this analysis, it’s far from exceptional historically. Since 1978, 185 teams have had their top 22 starters average at least 14.5 starts.
The table below lists the top 56 teams (a 9-way tie at 48 enlarged a top-50 list) by this metric since 1978. I’ve also displayed each team’s winning percentage in Year N and in Year N+1, with Year N being the initial year in question.
As you might suspect, these teams tended to fare better in Year N than they did the following year. While some regression to the mean is expected, these 56 teams had an average winning percentage of 0.640 in Year N, and then 0.519 in Year N+1. This is too general a study from which to conclude much, if anything, about the 2015 Cowboys. It should go without saying that “starts” are not a perfect proxy for “team health” and even if it were, “team health” is not a good proxy for “amount by which a team was helped/harmed by injuries.” But I did find today’s results interesting enough to share.


