≡ Menu

In April, I looked at how each defense fared at recording sacks. Today, we flip things around and look at it from the offensive perspective.

In 2014, there were 17,879 pass attempts in the NFL, and another 1,212 dropbacks that ended up as quarterback sacks, translating to a sack rate of 6.35%.

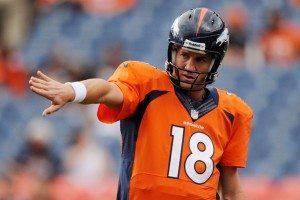
Peyton Manning offenses are always excellent, and they’re always particularly excellent at avoiding sacks. In 2014, the Broncos had 624 dropbacks; given the league average, we would “expect” that Denver’s quarterbacks would have been sacked 39.6 times. In reality, Manning was sacked just 17 times, of 22.6 fewer sacks than “expected” last season. Only one other team, the Joe Flacco and the Ravens at 17.4, had 15 fewer sacks than expectation.

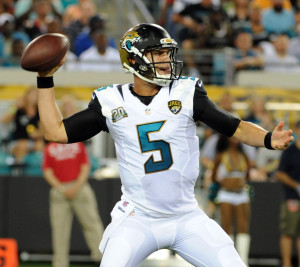
The worst team, by over 10 expected sacks, was Jacksonville. The Jaguars had 628 dropbacks and were sacked an incredible 71 times. Using the league average as our guide, we would have expected Blake Bortles and the Jaguars quarterbacks to have been sacked 38.4 times, which means the Jaguars were sacked 31.1 more times than “expectation.” [continue reading…]

{ 3 comments }

Justin Houston had 22 sacks last year for the Chiefs, just one sack shy of breaking the modern NFL record. Houston did it while playing a full slate of games for the Chiefs, and Kansas City faced 591 pass attempts last year (including sacks). That means Houston recorded a sack on 3.7% of Kansas City’s opponent dropbacks.

That’s very good, although it’s just the 11th best rate since 1982. But we have to remember that sack rates have been steadily declining over the past few decades. For example, from 1982 to 2014, the average sack rate was 6.87%, but the 2014 rate was just 6.35%. In other words, we would need to increase the sack rate last year by 8.2% in order to adjust for era. So if we adjust for Houston’s 3.7% average by multiplying that average by 108.2%, his adjusted sack rate jumps to 4.03%. And that’s the second best rate since 1982. [continue reading…]

{ 9 comments }

Andrew Healy, frequent contributor here and at Football Outsiders, is back for another guest post. You can also view all of Andrew’s guest posts at Football Perspective at this link, and follow him on twitter @AndHealy.


For a stats guy, the Wells Report is gripping reading, particularly the appendices provided by the consulting firm Exponent. The conclusion there is pretty simple. Compared to referee Walt Anderson’s pregame measurements, the Patriots’ footballs dropped significantly further in pressure than the Colts’ footballs did. Therefore, even if Tom Brady’s involvement is unclear, a Patriots’ employee probably deflated the balls.

At first glance, that evidence seems pretty convincing, maybe even strong enough to conclude more definitively that tampering occurred. And it is kind of awesome that the officials even created a control group. But there is a problem with making firm conclusions: timing. As Exponent acknowledges, the measured pressure of the balls depends on when the gauging took place. The more time that each football had to adjust to the warmer temperature of the officials’ locker room at halftime, the higher the ball pressure would rise.

And, not surprisingly given the Colts’ accusations, the officials measured the Patriots’ footballs first. This means that the New England footballs must have had less time to warm up than the Indianapolis footballs. Is that time significant? We will get to that, but it does make for a good argument that the Indianapolis footballs are not an adequate control group for the New England footballs. Given the order of events, we would expect the drop of pressure from Anderson’s initial measurements to be lower for the Colts’ balls that had more time indoors at halftime. As the Wells report notes, the likely field temperature was in the 48-50 degree range, compared to the 71-74 degree range for the room where the footballs were measured.

So, how much lower? Here it gets a little fuzzy. The report is clear that the Patriots footballs were gauged first during halftime, but it is unclear about whether the second step was to reinflate the Patriots’ balls or to measure the four Colts’ balls. In Appendix 1 (see p. 2 of the appendix), Exponent notes “although there remains some uncertainty about the exact order and timing of the other two events, it appears likely the reinflation and regauging occurred last.” If events unfolded this way, it would make the Indianapolis footballs at least a better sort of control group. [continue reading…]

{ 34 comments }

2014 AV-Adjusted Team Age

NFL: Preseason-Tampa Bay Buccaneers at Jacksonville JaguarsIn each of last three years, I’ve presented the AV-adjusted age of each roster in the NFL. Measuring team age in the NFL is tricky. You don’t want to calculate the average age of a 53-man roster and call that the “team age” because the age of a team’s starters is much more relevant than the age of a team’s reserves. The average age of a team’s starting lineup isn’t perfect, either. The age of the quarterback and key offensive and defensive players should count for more than the age of a less relevant starter. Ideally, you want to calculate a team’s average age by placing greater weight on the team’s most relevant players.

My solution has been to use the Approximate Value numbers from Pro-Football-Reference.com.  The table below shows the average age of each team, along with its average AV-adjusted age of the offense and defense. Here’s how to read the Jaguars line. In 2014, Jacksonville was the youngest team in the league, with an AV-adjusted team age of 25.8 years (all ages are measured as of September 1, 2014). The average AV-adjusted age of the offense was 24.5 years, giving the Jaguars the youngest offense in the NFL (and by over a year!). The average age of the defense was 26.6 years, and that was the 10th youngest of any defense in football in 2014. [continue reading…]

{ 5 comments }

Bryan Frye, owner and operator of the great site http://www.thegridfe.com/, is back for another guest post. You can also view all of Bryan’s guest posts at Football Perspective at this link, and follow him on twitter @LaverneusDingle.


Last week, I posted a quarterback performance metric that accounts for both passing and rushing. The base stat, Total Adjusted Yards per Play, is easy to comprehend and easy to figure out yourself with basic box score data. My original post only included performance that occurred during or after the 2002 season, because I don’t have spike and kneel data going back further than that. For the sake of consistency, I wanted to maintain the same parameters when calculating career values.

Before we get into the tables, I’d like to first briefly talk about what these numbers are and what they are not.

The formula, in case you forgot: [continue reading…]

{ 22 comments }

Bryan Frye, owner and operator of the great site www.thegridfe.com/, is back for another guest post. You can also view all of Bryan’s guest posts at Football Perspective at this link, and follow him on twitter @LaverneusDingle.


I spent a few weeks this offseason parsing out quarterback spike and kneel numbers from post-2002 play by play data. Chase published the findings, which I believe are a useful resource when trying to assess a QB’s stats. [1]For instance, 180 of Peyton Manning’s 303 rush attempts since 2002 have been kneels. He has lost 185 yard on those plays. Why in the world should we include those in his total output? … Continue reading Since I have the data available, I thought it would be good to use it.

Regular readers know Chase uses Adjusted Net Yards per pass Attempt as the primary stat for measuring quarterback performance. [2]It’s not perfect, but it’s at least easy to understand and calculate, and is not proprietary like DVOA, ESPN’s QBR, or PFF’s quarterback grades. I am going to do something similar, but I am going to incorporate rushing contribution as well. This is something Chase talked about doing awhile ago, but we didn’t have the kneel or spike data available. [3]For another thing Chase wrote on combining rushing and passing data — while (gasp) analyzing Tim Tebow — click here. I’ll call the end product Total Adjusted Yards per Play (TAY/P). The formula, for those curious: [4]I use 25 as the modifier for fumbles based on the idea that a QB fumble is worth roughly -50 yards, and fumble recovery is a 50/50 proposition.

[Yards + Touchdowns*20 – Interceptions*45 – Fumbles*25 + First Downs*9] / Plays, where

Yards = pass yards + rush yards – sack yards + yards lost on kneels
Touchdowns = pass touchdowns + rush touchdowns
First Downs = (pass first downs + rush first downs) – touchdowns
Plays = pass attempts + sacks + rush attempts – spikes – kneels [continue reading…]

References

References
1 For instance, 180 of Peyton Manning’s 303 rush attempts since 2002 have been kneels. He has lost 185 yard on those plays. Why in the world should we include those in his total output? Similarly, Ben Roethlisberger has spiked the ball 44 times, by far the most in the league since 2002. Why count those 44 “incomplete passes” in his completion rate?
2 It’s not perfect, but it’s at least easy to understand and calculate, and is not proprietary like DVOA, ESPN’s QBR, or PFF’s quarterback grades.
3 For another thing Chase wrote on combining rushing and passing data — while (gasp) analyzing Tim Tebow — click here.
4 I use 25 as the modifier for fumbles based on the idea that a QB fumble is worth roughly -50 yards, and fumble recovery is a 50/50 proposition.
{ 36 comments }

Last week, I looked at how many top carries needed to be removed in order to bring the best running backs below league average. Today, I want to do the same thing, but for quarterbacks, using pass attempts. [1]The same caveat from last time applies: because I used the play-by-play logs to conduct this exercise, there may be slight differences between the numbers in this table and the official numbers.

Aaron Rodgers averaged 7.7 net yards per attempt last year, the best rate in all of football. But as it turns out, he’s not the leader in this metric. You may be surprised to learn that one “only” needs to remove Rodgers’ 15 best pass plays to bring his NY/A average below the 2014 league average rate of 6.35. Meanwhile, you have to remove 19 of Peyton Manning’s top plays to bring his 7.5 NY/A average below league average. That’s because Rodgers’ ten best pass plays went for 642 yards, while Peyton Manning’s top ten pass completions gained 499 yards. [2]It also helped Manning’s cause that he had more dropbacks.

Regular readers know the drill; if you need more info on how to read the table, check last week’s post. The table below displays all quarterbacks who had at least 100 dropbacks last season and finished with a NY/A average above 6.35; the final column displays how many of each player’s top pass attempts need to be removed to bring his NY/A average below league average.

QuarterbackDBNetYdNY/ANum
Peyton Manning61446087.519
Ben Roethlisberger64247657.4215
Aaron Rodgers54742097.6915
Tony Romo46534657.4512
Drew Brees68747716.9410
Andrew Luck64345837.1310
Matt Ryan65844946.837
Philip Rivers60440856.766
Ryan Fitzpatrick33323897.176
Kirk Cousins21216407.746
Eli Manning62942276.724
Joe Flacco57438346.684
Brian Hoyer46331776.864
Mark Sanchez33022696.884
Tom Brady60539696.563
Andy Dalton50432826.512
Russell Wilson49232376.582
Drew Stanton25116456.552
Carson Palmer23315636.712
Nick Foles32120916.511
Zach Mettenberger19612746.51
Colt McCoy1459476.531

I’ll again leave the commentary to you guys.

References

References
1 The same caveat from last time applies: because I used the play-by-play logs to conduct this exercise, there may be slight differences between the numbers in this table and the official numbers.
2 It also helped Manning’s cause that he had more dropbacks.
{ 9 comments }

On Friday, I asked the question: how many carries would we need to take away from DeMarco Murray in order to drop his YPC average to at or below league average?

Today, I want to look at it from the other side. How many of Trent Richardson’s worst carries would we need to erase to bring his YPC above league average? For this experiment, assume that we are sorting each running back’s carries in ascending order by yards gained. I’ll give you a moment to think about the answer.

[Final Jeopardy Music]

[Keep thinking…]

[Are you ready?]

[Your time is now up. Post your answer in the comments!] [continue reading…]

{ 12 comments }

DeMarco, how many Cowboys fans still think you're great?

DeMarco, how many Cowboys fans still think you’re great?

DeMarco Murray was really, really good last year. He rushed 393 times for 1,845 yards, producing a strong 4.69 YPC average. Jamaal Charles was also really, really good — he averaged 5.07 yards per rush last year, albeit on “only” 205 carries. The NFL average yards gained per rush was 4.16 last season, down a tick from in previous years. But that brings us to the question of the day:

Suppose we sort each running back’s carries in descending order by yards gained. How many carries would we need to take away from Murray in order to drop his YPC average to at or below league average? Same question for Charles. I’ll give you a moment to think about this one.

[Final Jeopardy Music]

[Keep thinking…]

[Are you ready?]

[Your time is now up. Post your answer in the comments!]
[continue reading…]

{ 50 comments }

Regression to the mean and Team Wins

The two Texas teams had much better seasons in 2014 than they did in 2013. Houston jumps from 2 to 9 wins, while Dallas improved from 8 to 12 wins. Which season was more impressive as far as team improvement?

If you like math, you probably are thinking that improving by 7 wins is more impressive than improving by 4 wins. But if you love math, you are probably thinking about regression to the mean. After all, sure, Houston won only 2 games in 2013, but nobody expected them to be that bad last year. In fact, the Texans were arguably projected to be the best team in the state last year! [1] Just before the season, both Houston and Dallas had Vegas over/under odds of 7.5 wins, but the way the money lines were set up hinted that Vegas wanted to get more action on Dallas and the over.

But instead of using Vegas odds, I thought it would be interesting to take a quick look at the effects of regression to the mean on team wins. I looked at every team season from 2003 to 2014, and noted how many wins each team won in the prior year and in the current year. I then ran a linear regression using prior year (Year N-1) wins to create a best-fit formula for current (Year N) wins. That formula was:

5.51 + 0.31 * Year N-1 Wins

What this means is that to predict future wins, start with a constant for all teams (5.51 wins), and then add only 0.31 wins for every prior win. In other words, three additional wins in Year N-1 aren’t even enough to project one full extra win in Year N! That’s a remarkable amount of regression to the mean, even if not necessarily surprising. [2]Since this has been studied to death. For those curious, the R^2 was just 0.094, another sign of how not valuable it is to just know how many games a team won in the prior year. [continue reading…]

References

References
1 Just before the season, both Houston and Dallas had Vegas over/under odds of 7.5 wins, but the way the money lines were set up hinted that Vegas wanted to get more action on Dallas and the over.
2 Since this has been studied to death.
{ 1 comment }

Career RANY/A Rankings

Adjusted Net Yards per Attempt is my preferred basic measurement of quarterback play. ANY/A is simply yards per attempt, but includes sacks and sack yardage lost, and provides a 20-yard bonus for touchdowns and a 45-yard penalty for interceptions.

RANY/A, or Relative ANY/A, measures a quarterback’s ANY/A average to league average. Let’s use Aaron Rodgers as an example. This past season, he threw 520 passes and gained 4,381 yards and 38 touchdowns, while throwing five interceptions and being sacked 28 times for 174 yards. That translates to an 8.65 ANY/A average, best in the NFL in 2014.

The league average rate in 2014 was a record-high 6.14 Adjusted Net Yards per Attempt; as a result, this means that Rodgers averaged 2.52 ANY/A above average, or had a RANY/A of +2.52. [1]Difference due to rounding. But that is just for one season. To measure Rodgers’ career RANY/A, we need to do that for every season of his career, and weight his RANY/A in each season by his number of dropbacks.

For example, Rodgers had 14.7% of his career dropbacks come in 2014, which means 14.7% of his career RANY/A is based off of the number +2.52. During his other MVP season in 2011, Rodgers had a RANY/A of 3.49 on just 10 fewer dropbacks; as a result, 14.4% of his career RANY/A is based off of +3.49. If you multiply his RANY/A in each year by the percentage of dropbacks he had in that season relative to his entire career, and sum those results, you will get a player’s career RANY/A. Here, take a look: [continue reading…]

References

References
1 Difference due to rounding.
{ 8 comments }

Sam Bradford and Breaking Out At Age 27

Bradford will move from St. Louis to Philadelphia via 195,000 eight-yard passes.

Bradford will be moving from St. Louis to Philadelphia, presumably via 195,000 eight-yard passes.

As a rookie at age 23, Sam Bradford averaged 4.73 Adjusted Net Yards per Attempt [1]Defined as Passing Yards + 20 * PTDs – 45 * INTs – Sack Yards Lost, all divided by total dropbacks (i.e., including sacks). at a time when the league average ANY/A was 5.73; as a result, we could say that Bradford had a Relative ANY/A of -1.00. The next year, he averaged 4.49 ANY/A with a RANY/A of -1.41. In 2012, he was at 5.64  and -0.30, and in seven games in ’13, he averaged 6.10 and +0.23.  In other words, he’s been mostly below-average for his career.

In order to calculate his career RANY/A to-date, we need to weight his production by his number of dropbacks, which were 624 in ’10, 393 in ’11, 586 in 2012 and 277 in his last season of play. Do the math, and Bradford has a career RANY/A of -0.68 entering the 2015 season. But could he have a breakout year playing with Chip Kelly in Philadelphia?

I decided it would be interesting to look at the question from the reverse angle: how many of the quarterbacks that were really good at age 27 were not so good before that? I defined “really good” to mean a RANY/A of +1.00 on at least 224 dropbacks since 1970 (i.e., a quarterback who had an ANY/A average at least one full yard better than league average, had a significant number of dropbacks, and did so since the merger). I also required that such quarterback had at least 500 career dropbacks through age 26 (Bradford has 1,880 career dropbacks prior to the 2015 season.)  There were 24 quarterbacks who met those criteria.

The best RANY/A season since the merger by an age 27 quarterback was Craig Morton; the Dallas quarterback hadn’t played much prior to 1970 (just 615 career dropbacks), but he had been effective in limited time before then (a career RANY/A of +1.58 prior to the ’70 season).

The second best age 27 season came from Boomer Esiason, in his MVP season of 1988. That year, he had 418 dropbacks and averaged 2.77 ANY/A better than the league average; prior to 1988, he had 1,531 career dropbacks, and a career RANY/A of +1.32. The table below shows that data for all 31 quarterbacks: [continue reading…]

References

References
1 Defined as Passing Yards + 20 * PTDs – 45 * INTs – Sack Yards Lost, all divided by total dropbacks (i.e., including sacks).
{ 7 comments }

As a general rule, shorter and heavier guys tend to dominate the bench press. When I looked at this last year, the best-fit formula to predict the number of reps of 225 a prospect could achieve was:

Expected BP = 30.0 – 0.560 * Height + .1275 * Weight

What does that mean? All else being equal, if Prospect A is 7 inches shorter than Prospect B, we would expect Prospect B to produce about 4 more reps than Prospect A. And for every eight pounds of body weight a player has, we would expect one additional rep out of that prospect.

Which brings us to Clemson outside linebacker Vic Beasley. Standing 6’3 and “only” 246 pounds, Beasley doesn’t exactly fit the profile of a bench pressing machine. But in Indianapolis, he pumped out an incredible 35 reps, tied for the third most at the combine (no other player under 300 pounds had even 33 reps). Given his height and weight, the formula above would project Beasley for 19.4 reps, which means he exceeded expectations by a whopping 15.6 reps. No other player came close to exceeding expectations to such a significant degree.

The table below shows the results of all players who participated in the bench press at the combine.  All data comes courtesy of NFLSavant.com.

[continue reading…]

{ 2 comments }

One of the biggest headlines from the combine were the jumps from Byron Jones, a cornerback from Connecticut. Most impressive was his broad jump, which was not only 8 inches better than everyone else in Indianapolis, but also 8 inches better than anyone else in combine history. More on his broad jump in a future post, but Jones’ 44.5″ vertical too shabby, either: it was the best since 2009, when Ohio State and eventual Chiefs safety Donald Washington jumped 45 inches (a feat later matched by one other player at this year’s combine).

But Jones didn’t have the most impressive vertical at the combine, because at 199 pounds, there’s an expectation that he would do fairly well in that drill.  Given his weight, we would expect Jones to jump about 35.5 inches, based on the best-fit formula derived here, and defined below:

Expected VJ = 48.34 – 0.0646 * Weight

One way to think of that formula is that for every 15.5 pounds of player weight, the expectation on the vertical is one fewer inch.  So at 230 pounds, the expectation would be 33.5 inches.  Which brings us to Alvin “Bud” Dupree, whom we lauded yesterday for the top performance in the 40-yard dash.  At 269 pounds, he would be expected to jump roughly 31.0 inches.  Instead, the Kentucky edge rusher jumped a whopping 42.0 inches — or 11.0 inches over expectation — making it the best weight-adjusted performance of any player in Indianapolis.

Below are the results of the Vertical Jump for every player at the combine. All data comes courtesy of NFLSavant.com. [continue reading…]

{ 5 comments }

Forsett, praising his Excess Yards

Forsett, praising his Excess Yards

In the comments to the Greatest Running Back of All-Time Post — and reminder, entries are due by midnight Thursday — a debate broke out between sn0mm1s and Jay Beck, among others, about how to value running backs generally, and specifically, the value of long runs.

One idea I’ve had before is that the yards a player gains after picking up a first down are similar to the yards picked up by a returner. For example, when a punt returner gains 10 yards instead of 5, that’s obviously worth 5 additional yards of field position to his team. But it’s not as valuable as 5 yards on 3rd-and-5; the return yards were gained outside of the context of the down-and-distance/series-of-downs nature of the game.

Does this mean that all yards gained after a first down are exactly as valuable as return yards? I’ll leave up that to the reader to decide. But I do think one thing is noncontroversial: Lamar Miller ran for a 97-yard touchdown on 1st-and-10 against the Jets in week 17, the most valuable 10 yards during that run were the first ten. The last 87 yards were slightly less valuable (on a per-yard basis), or akin to the yards a player would gain on a return.

At this point, you might be thinking, “Who cares?” And that’s a very good question: after all, return yards are valuable. And the last 87 yards of Miller’s run were certainly more valuable to Miami than the first 10 yards, even if that may not be true on a per-yard basis.

But I thought it would be interesting to look at all running plays this season, and break them into two categories: yards that came after a first down had already been achieved, and all other rushing yards. So a 10-yard run on 3rd-and-5 has five yards in each bucket; if it was 3rd-and-1, 9 yards get assigned to the “excess yards” bucket, and 1 yard to the “going towards picking up a first down” bucket. [continue reading…]

{ 19 comments }

Quarterbacks and Passing Milestones

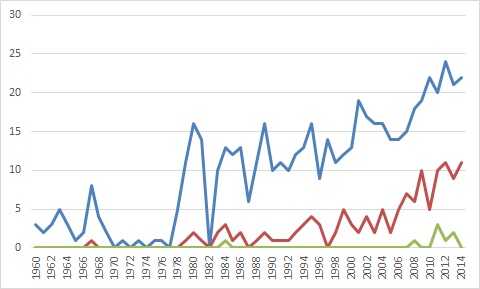
The first 3,000 yard passer came in 1960, when Johnny Unitas reached such feat in the NFL and Jack Kemp and Frank Tripucka did so in the AFL. Joe Namath became the first 4,000-yard passer seven years later, and Dan Marino in 1984 was the first to reach 5,000 yards.

The graph below shows the number of 3,000 yard passers in blue, 4,000-yard passers in red, and 5,000-yard passers in green in each season since 1960.  As you can see — and no doubt already knew — passing productivity is on the rise:

YardPassers [continue reading…]

{ 11 comments }

An Early Look at 2015 Vegas Win Totals

Like last year, CG Technology (formerly Cantor Gaming) is the first Las Vegas book to release win totals. For your convenience, I have produced them below, and sorted the list by the difference between 2015 Vegas wins and 2014 wins. [continue reading…]

{ 3 comments }

Last year, I wrote a post on the plays that had the biggest impact on the eventual Super Bowl champion. These were the plays that affected the Super Bowl win probability by the biggest amount among teams that did not win the title. At the time, the Buffalo Bills were on the short end of the most influential play in the Super Bowl era. When Frank Reich put the ball down for Scott Norwood, I estimated that the Bills had a 45% chance on winning the Super Bowl. [1]Recent research by Chase suggests something similar. After the kick went wide right, the Bills’ win probability fell to zero. The 45 percentage point fall was the biggest change for a non-champion of any play in the Super Bowl era. Over 48 years, a bunch of plays fell in that range, but no team could point to a single play as having lowered its championship chances by so large an amount.

A couple weeks ago, that long-held record got broken kind of like Michael Johnson broke the 200-meter record in the Atlanta Olympics. Malcolm Butler’s pick obliterated the old mark. My estimate has the Butler interception as increasing the Patriots’ chances of winning by 0.87. There is no doubt that what some have called the Immaculate Interception is on an island by itself as the most influential play in NFL history.

To get that change in win probability from Butler’s play, I am going to assume that the Seahawks would have run on third and fourth down. I am going to give a run from the one a 60% chance of working. That might seem high, but the Patriots were the worst team in football in stuffing the run in important short-yardage situations either on third or fourth down, or down by the goal line. And their limited success mostly came against terrible running teams. It is not a huge sample, but against teams outside the worst quarter of rushing teams by DVOA, the Patriots had allowed opponents to convert 16 of 17 times with two yards or less to go for a first down or touchdown. If we add the playoffs, they actually had three more stops against good running teams (Baltimore and Seattle), albeit in games where the opponent had a good amount of success on the ground. [2]Note that the stop against Baltimore should not even count. In an otherwise great game for Gary Kubiak, he called for a reverse to Michael Campanaro on third-and-1 in the second quarter. The run was … Continue reading With Seattle being the best rushing team in football by a mile and the Patriots being at best not great in run defense in that situation, it seems hard to think that Seattle had anything less than a 0.60 chance of scoring on a run. [continue reading…]

References

References
1 Recent research by Chase suggests something similar.
2 Note that the stop against Baltimore should not even count. In an otherwise great game for Gary Kubiak, he called for a reverse to Michael Campanaro on third-and-1 in the second quarter. The run was stopped for a loss. The Patriots basically could not stop Justin Forsett, making the reverse call very unnecessary.
{ 31 comments }

2014 Fumble Recovery Data

There are few statistics more random in all of sports than fumble recoveries. When a football is on the ground, it’s not the case that better teams are more likely to fall on the ball than bad teams: in the NFL, recovering fumbles is nearly all luck and little skill. This is a fact widely accepted by all statisticians, and I also ran a study which confirmed such intuition just last year.

The 49ers fumbled 18 times in 2014; San Francisco also forced 18 fumbles. When the 49ers fumbled, they managed to recover (or have the ball go harmlessly out of bounds) just six fumbles; when they forced a fumble, they… also only recovered just six times! So of the 36 times the ball hit the ground, San Francisco recovered 12 times, and lost it 24 times. [continue reading…]

{ 4 comments }

Brown was number one in 2014

Brown was number one in 2014

On Monday, I noted that Pittsburgh wide receiver Antonio Brown led the NFL in True Receiving Yards for the second straight season. He also, by the slimmest of margins, your leader in Adjusted Catch Yards per Attempt, too.

On October 1st, I looked at the leaders in Adjusted Catch Yards per Team Pass Attempt; at the time, Jordy Nelson had a big lead on the rest of the NFL, although Brown was in second place. You can read the fine details of the system in that post, but the short version is:

  • Begin with each player’s number of receiving yards. Add 9 yards for every first down gained, other than first downs that resulted in touchdowns, to which we add 20 yards. For Brown, this gives him 2,624 Adjusted Catch Yards (1,698 receiving yards, 87 first downs, 13 touchdowns).
  • Divide that number by the number of team pass attempts, including sacks, by that player’s offense. Pittsburgh recorded 645 dropbacks in 2014, which means Brown averaged 4.07 ACY/TmAtt. Jordy Nelson (1519/71/13) had 2,301 Adjusted Catch Yards and the Packers had 566 team pass attempts. That translates to .. 4.07 ACY/TmAtt, too. But go to three decimal places, and Brown (4.068 to 4.065) becomes your winner.
  • I have also included a column for Adjusted Catch Yards per Estimated Team Dropback; here, we use the same formula, but multiply the numerator by 16, and the denominator by the number of games played by the receiver. Let’s use Odell Beckham as an example. The Giants wide receiver finished with 1,959 ACY (1305/58/12) and New York had 637 dropbacks, giving Beckham 3.08 ACY/TmAtt. But if we adjust for the fact that Beckham missed four games, he gets credited with 4.10 ACY/EstTmAtt, which is the highest rate in the NFL.

The table below shows the top 50 receivers in ACY/TmAtt: [continue reading…]

{ 5 comments }

Additional Thoughts on Turnover Rates

On Sunday, I looked at turnover rates for every year in the NFL since the merger. Today, I want to re-examine turnover data but in a different light. In 2014, the average team committed 23.7 turnovers. As you might suspect, there’s a strong relationship between turnovers and winning percentage, with a correlation coefficient of -0.56. This says nothing about causation, of course, and the causal arrow does in fact run in both directions (committed fewer turnovers leads to more wins, and winning in games leads to fewer turnovers).

Here’s another way to think about the relationship between winning percentage and turnovers. The Patriots were responsible for 4.7% of all wins this year and committed 13 turnovers; as a result, when calculating a weighted league average turnover total, I made New England’s 13 turnovers worth 4.7% of that total. Meanwhile, the Buccaneers and their 33 turnovers were only worth 0.8% of the weighted league average turnover total, since Tampa Bay was responsible for just 0.8% of all wins.

Using this methodology, the weighted league average turnover total in the NFL was 22.5 per team, or 95% of the unweighted league average. I used that same methodology to calculate the percentage of “weighted league average turnover total” to “unweighted league average turnover total” for each year since 1960. In the graph below, the blue line represents the NFL ratio, while the red line represents the AFL ratio. [continue reading…]

{ 6 comments }
Brown was number one in 2014

Brown was number one in 2014

You may recall that in 2013, Antonio Brown led the NFL in True Receiving Yards, which felt controversial at the time. Remember, Calvin Johnson and Josh Gordon were the runaway choices by the Associated Press as the top receivers in the NFL; in addition, A.J. Green also received more votes, and Demaryius Thomas finished with as many votes as Brown.

Well, Brown has done it again, but I doubt it will surprise many people this time around. Brown led the NFL in receptions and receiving yards, and received 49 of 50 first-team All-Pro votes. Regular readers are familiar with the concept of True Receiving Yards, but let’s walk through the system using Brown and Dez Bryant, who jumps from 8th in receiving yards to 4th in True Receiving Yards. [continue reading…]

{ 4 comments }
Bettis ran for only five yards on this play

Bettis ran for only five yards on this play

Congrats to the newest members of the Pro Football Hall of Fame. You can read my thoughts on the candidates here; while this class is not exactly the one I would have picked, Jerome Bettis, Tim Brown, Charles Haley, Junior Seau, Will Shields, and Mick Tingelhoff were all outstanding players. In addition, Bill Polian and Ron Wolf were the inaugural selections for the Contributors spots, so congratulations to them as well.

The Bettis candidacy is an interesting one. Many want to focus on his underwhelming 3.9 career yards per carry average. But as I have written many times, I am not keen on putting much weight on YPC as a statistic. Brian Burke has also written about how coaches don’t view running backs in terms of yards per carry, but rather by success rate (which correlates poorly with yards per carry). Danny Tuccitto calls yards per carry essentially “a bunkum stat.” [continue reading…]

{ 17 comments }

Rams/Raiders was the Least-Conforming Game of 2014

50/50 chance these guys show up

50/50 chance these guys show up

They’re baaack! In November 2013, the St. Louis Rams blew out the visiting Indianapolis Colts in what was the least-conforming game of the 2013 season.

In November 2014, the Rams blew out the visiting Oakland Raiders in what was the least-conforming game of 2014 (although for my money, the runner-up game between the Titans and Chiefs was probably still the strangest result of the year). The Rams finished the season with a -0.8 SRS rating, eight points better than the 2014 Raiders SRS rating of -8.8. Given that the game was in St. Louis, we would have expected the Rams to win by around 11 points.

In reality, the Rams shut out the Raiders, 52-0. That gave St. Louis a single-game SRS score of 40.2, meaning the Rams were 40.2 points better than average that day. [1]Technically, this bit of information is superfluous for the main point of this post, but I always err on the side of including interesting data. Since St. Louis won by 52 when the Rams were expected to win by 11, they exceeded expectations by a whopping 41 points.

That 41-point total — the amount by which St. Louis exceeded expectations — was the highest of any game in 2014. The table below lists all relevant information from every regular season game this year, with the “diff” column showing the difference between the expected and actual margins of victory. I have also included a link to the boxscore of each game embedded in the “Wk” cell. Note that the table, by default, lists only the top 10 games, but you can view more using either the dropdown box, the search bar, or the previous/next buttons at the bottom of the table. [continue reading…]

References

References
1 Technically, this bit of information is superfluous for the main point of this post, but I always err on the side of including interesting data.
{ 1 comment }

Quite the clickbait title, I know. But given where this post is going, I thought precision was more important than anything else.

Over the last three seasons, Seattle has allowed 15.2 points per game. That’s really, really good. How good?

pa2012

There are flaws with using points allowed as a measure of defensive play, of course. Seattle is known for its long drives on offense, which limits the number of possessions an opponent might have. And the Seahawks offense generally puts the team’s defense in pretty good situations. Using points allowed per drive might be preferable, or using DVOA, or EPA per drive, or a host of other metrics. And adjusting these results for strength of schedule (or, at least, removing non-offensive scores) would make sense, too.

But hey, it’s Friday, and I wanted to keep things relatively simple. [1]In about ten minutes, we can all have a good laugh at this line. Points allowed is a number we can all understand. Given our era of inflating offenses, it’s quite possible that Seattle’s 15.2 points per game average doesn’t stand out as particularly impressive to you. After all, the ’76 Steelers once allowed 28 points over a nine-game stretch! But consider that since 2012, the NFL average has been 22.6 points per game, which means the Seahawks have allowed 7.4 fewer points per game than the average defense.

How good is that? [continue reading…]

References

References
1 In about ten minutes, we can all have a good laugh at this line.
{ 11 comments }

Guest Post: Marginal YAC, 2014 in Review

Adam Steele is back to discuss Marginal YAC, this time in the context of the 2014 season. You can view all of Adam’s posts here.


Manning is more of a downfield thrower than you think

Manning is more of a downfield thrower than you think

Back in September, I posted a three part series introducing Marginal Air Yards and Marginal YAC. Today, I’m going to update the numbers for 2014 and analyze some interesting tidbits from the just completed season. [1]A big thanks to Chad Langager at sportingcharts.com for helping me compile this data.

League-wide passing efficiency reached an all-time high in 2014 with a collective 6.13 Adjusted Net Yards per Attempt average. However, this past season was also the most conservative passing season in NFL history; 2014 saw the highest completion rate ever (62.6%), the lowest interception rate ever (2.5%), and also the lowest air yards per completion rate ever (5.91 Air/C). Passing yards were comprised of 51.4% yards through the air and 48.6% yards after the catch, the most YAC-oriented season in history. [2]Even though YAC data only goes back to 1992, I feel safe in using the phrase “all-time” with regard to YAC dependency. The offensive schemes of yesteryear emphasized downfield passing, which … Continue reading This trend shows no sign of reversing itself, so expect more of the same in 2015.

Here are the 2014 Marginal Air Yards (mAir) and Marginal YAC (mYAC) for quarterbacks with at least 100 pass attempts. The 2014 leader in Marginal Air Yards is…Peyton Manning? Yes, the noodle-armed, duck-throwing, over-the-hill Peyton Manning averaged 4.54 Air Yards per pass Attempt; given that the average passer on this list averaged 3.70 Air Yards per pass Attempt, this means Manning averaged 0.84 Air Yards per Attempt over average. Over the course of his 597 attempts, this means Manning gets credited with 500 marginal Air Yards, the most of any quarterback in the NFL. [continue reading…]

References

References
1 A big thanks to Chad Langager at sportingcharts.com for helping me compile this data.
2 Even though YAC data only goes back to 1992, I feel safe in using the phrase “all-time” with regard to YAC dependency. The offensive schemes of yesteryear emphasized downfield passing, which generated far less YAC than the short passing games of today.
{ 12 comments }

Probably was picked off

Probably was picked off

I still can’t quite comprehend what happened. Leading 19-7 with less than three minutes remaining, Green Bay somehow lost the NFC Championship Game. It was the most remarkable comeback in conference championship game history since at least 2006, when Peyton Manning and the Colts came back from the dead against the Patriots.

But this game had the added element of Russell Wilson looking like he had no idea what he was doing out there. With four minutes remaining, Wilson had one of the ugliest stat lines in playoff history: he was 8/22 for 75 yards with no touchdowns, four interceptions, and four sacks for 24 yards. He was averaging -4.96 Adjusted Net Yards per Attempt. It was worse than Ryan Lindley against Carolina, a performance that would rival Kerry Collins in the Super Bowl against the Ravens for worst playoff passing performance ever.

Wilson’s stat line was straight out of a 1976 boxscore featuring a rookie quarterback against the Steelers. Yet, somehow, minutes later, the game would be in overtime. Wilson ended regulation with a still miserable stat line of 11/26 for 129 yards, with 0 touchdowns (to be fair, he did run one in), 4 interceptions, and 4 sacks for -24 yards. That translates to an ANY/A average (which gives a 45-yard penalty for interceptions, and a 20-yard bonus for touchdowns, while penalizing for sacks) of -2.50.

If the Seahawks returned the overtime kickoff for a touchdown, the game would have easily gone down as the worst performance by a playoff-winning quarterback in history. But in overtime, Wilson did his best work: first, he found Doug Baldwin for ten yards. Then, after taking a one-yard sack, he hit Baldwin on 3rd-and-7 for 35 yards. The next play, Wilson hit Jermaine Kearse for a 35-yard touchdown, and Seattle was headed back to the Super Bowl.

Wilson finished 14/29 for 209 yards, with 1 touchdown, 4 interceptions, and five sacks for -25 yards. That translates to an anemic ANY/A average of +0.71. How does that compare historically? I thought it would be worthwhile to compare the ANY/A average of every winning quarterback in a playoff game to the league average ANY/A that season. So, in 2014, the NFL averaged 6.13 Adjusted Net Yards per Attempt per pass. This means Wilson finished 5.42 ANY/A below average. And given that Wilson had 34 dropbacks, it means that Wilson produced -184 Adjusted Net Yards over average. As it turns out, that’s only the … third worst ever by a winning quarterback. [continue reading…]

{ 19 comments }

Guest post: Expected Touchdowns

Munir Mohamed, a reader of Football Perspective, is back for another guest post. And I thank him for it.


Methodology: I looked at the expected touchdown rate on each yard line from inside the five-yard line in goal-to-go situations, then assigned touchdowns over expectation based on the number of scores above or below average the expected rate. For example, passes from the 1-yard line score a touchdown 50% of the time. Therefore, if a quarterback throws a touchdown when the line of scrimmage is the one, he receives +0.5 touchdowns over expectation. If he didn’t throw a touchdown, he is credited with -0.5 touchdowns over expectation. The numbers in this article are from 1998-2014. Note that touchdowns, like nearly every other statistic in football, is a reflection of not just a player, but his team. A player who scores highly in this metric may simply be great at scoring touchdowns, may have played with coaches or teammates who significantly aided his production, may be lucky over a small sample size, or a combination of several of those factors. But we can discuss the reasons behind the data in the comments: let’s get to the data, and begin with passing touchdowns. [continue reading…]

{ 1 comment }
Brady was happy to have the game put in his arm on Saturday

Brady was happy to have the game put in his arm on Saturday

Every week during the season, I compile Game Scripts data, which measures the average points margin during every second of every game. Since most people don’t have a chance to watch every game, it’s helpful to have this information.

During the playoffs, most of us are watching each game, so we know what’s going on. But after two weeks, I thought it was still worthwhile to check in on the numbers. There have been two big comebacks during the playoffs: the Cowboys against the Lions during the wildcard round, and the Patriots against the Ravens last weekend.

The Dallas comeback against Detroit would rank as the 4th biggest comeback of 2014, or the 4th worst Game Script produced by a winning team. Those with longer memories may recall that in 2011, the Lions beat the Cowboys despite having a Game Script of -9.4, and last year, the two teams scored 41 combined fourth quarter points. In other words, don’t turn off the game early when the Lions and Cowboys are playing.

The Patriots also pulled off a big comeback. New England trailed 14-0 and for most of the first half, and entered the locker room down seven. The Patriots are no strangers to these sorts of comebacks, though: since 2001, New England has the third best winning percentage when trailing at halftime by between 7 and 14 points.

Here are the full numbers from the first two rounds of the playoffs:

TeamH/ROppBoxscorePFPAMarginGame ScriptPassRunP/R RatioOp_POp_ROpp_P/R Ratio
INDCINBoxscore2610167.8452564.3%382164.4%
CARARIBoxscore2716115.8333945.8%321568.1%
SEACARBoxscore3117145.8242747.1%382956.7%
BAL@PITBoxscore3017134.6302554.5%531973.6%
IND@DENBoxscore2413113.8432860.6%482070.6%
GNBDALBoxscore26215-0.4362955.4%232845.1%
NWEBALBoxscore35314-4.8531380.3%452861.6%
DALDETBoxscore24204-8.1372163.8%452267.2%

[continue reading…]

{ 0 comments }

There are lots of bad things one could write about the NFC South. But for the most part, the Atlanta Falcons had been a competitive team this year, and not just by NFC South standards. Entering week 17, Atlanta had posted an average Game Script of +0.7; sure, that’s not very good, but it’s above average! The Falcons had not been embarrassing, and in fact, had outscored opponents by 40 points through three quarters.

Sure, Atlanta had issues maintaining leads in the fourth quarter, but they were rarely soundly beaten from start to finish. The Falcons had (prior to Sunday) four bad Game Scripts this year. Three of them came on the road: -12.8 in Baltimore, -10.6 in Green Bay, and -8.5 in Cincinnati, and all three of those teams are notable for being much stronger at home in recent years. The fourth was a -8 against the Steelers, but even then, Atlanta had the ball down by just seven with 6 minutes remaining.

Then, week 17 came. The Panthers led by 10-0 after the first quarter, the largest deficit Atlanta faced after one quarter all year. Carolina upped that margin to 21 points at halftime, the second largest halftime lead an opponent had against the Falcons this year (Green Bay was up by 24 points). The 31-point margin after three quarters was easily the largest margin, too. It was a start-to-finish beating by the Panthers, who posted a Game Script of 16.4 in the process.

That was the second largest Game Script for Carolina this year, and by quite a large margin. Other than another December blowout over a division rival (New Orleans), the Panthers didn’t have a Game Script of over +7. But are the Panthers peaking at the right time, or just beating up on NFC South opponents? Tune in next week: actually, never mind. The Cardinals are an NFC West team in name only; with Ryan Lindley under center, Arizona is actually the fifth member of the NFC South. [continue reading…]

{ 1 comment }
Next Posts Previous Posts