≡ Menu

San Francisco 49ers rookie quarterback Brock Purdy is on the verge of making NFL history. If the 49ers can upset the Eagles in the NFC Championship Game, Purdy would become the first rookie quarterback to ever start in a Super Bowl.

Only a few rookie “quarterbacks” have ever led a team to an NFL title, with quarterbacks in quotation marks the farther back in time we go. In 1946, a 25-year-old Otto Graham led the Cleveland Browns to an AAFC title in his first season. The prior year, a 25-year-old Bob Waterfield led the NFL in touchdown passes as a rookie and then threw two touchdown passes in the NFL title game to help lead the Rams to their first ring. Perhaps the best rookie season of them all came from Sammy Baugh in 1937, as he led Washington to the championship. And three years earlier, rookie Ed Danowski helped the Giants stage a fourth quarter comeback to beat the Bears in a famous title game.

Purdy has only started five regular season and two playoff games in his NFL career so far, and he sports a perfect 7-0 record. An appearance in Super Bowl LVII would be his 9th NFL start; believe it or not, that would only rank as the third fewest by a starting quarterback in the Super Bowl. On the other hand, at just over 23 years old, Purdy would in fact be the youngest quarterback to start a Super Bowl. [continue reading…]

{ 1 comment }

On paper, the Buccaneers added a lot of big names in the offseason. Tom Brady and Rob Gronkowski from the Patriots, a former top-5 pick at running back in Leonard Fournette, and an All-Pro wide receiver in Antonio Brown. Tampa Bay also hit home runs with its first two draft picks, offensive tackle Tristan Wirfs and cornerback Antoine Winfield Jr..

But the Buccaneers did not have a particularly large amount of turnover compared to recent Super Bowl champions. In fact, by one measure, each of the five previous Super Bowl champions had bigger turnover than Tampa Bay. Other than Brady, most of the big names didn’t have a big impact for Tampa Bay, at least until the Super Bowl. Leonard Fournette had just 367 rushing yards during the regular season; Brown had just 483 receiving yards in 8 games; Gronk averaged 39 yards per game, the lowest mark in his career other than during his rookie season (in ’19, O.J. Howard averaged 33 yards per game for Tampa Bay). Of course, in Super Bowl LV it was a different story: our lasting image of the 2020 Bucs will be Gronkowski scoring 2 touchdowns, Brown catching a touchdown, and Fournette picking up 135 total yards and a touchdown.

How do we compare one team to its squad from the prior year? Great question! It’s tricky: we want to compare not just roster turnover, but the value of those players. The Chiefs added both Brady and LeSean McCoy, but that should not count as equal moves. Similarly, you have to look at how the player was used in the prior season. For example, Kurt Warner was on both the ’98 Rams and the ’99 Rams, but it would be poor analysis to say that the ’99 Rams had the same quarterback as they did the prior year.

Really we want to look at two things: how much was the player a part of the Super Bowl team (to avoid overemphasizing the McCoys of the world) and for players on the team, how much was that player a part of the team the prior year (to avoid the Warner problem). To measure how valuable a player was, I am going to use PFR’s AV, which does as good a job as any other metric to compare the value of players across positions and eras. For each player on each Super Bowl team, I will measure how much AV they produced as a percentage of the team’s total AV. I will also do that the year before, and then take the lower of those two values.

Let’s use a few examples. The 2020 Buccaneers had 243 points of AV, and Brady had 15 of them; therefore, he was responsible for about 6% of the team’s value. He was not on the team in 2019, of course, so Brady gets a 0 when we calculate how much of the 2019 Bucs were on the 2020 Bucs. That’s a big deal, because there is only 94% of the AV left to allocate. McCoy had just 1 point of AV, or 0.4% of the team’s AV; he also gets a zero since he wasn’t on Tampa Bay in 2019, but that has a much smaller impact. Donovan Smith had about 4% of the AV on the 2019 Bucs and 4% of the AV on the 2020 Bucs; therefore, taking the minimum doesn’t change things; he gets assigned 4%.

If we do this for every player on the 2020 roster, and take the minimum value between the percentage of AV they had for the ’20 Bucs and the percentage of AV they had for the ’19 Bucs, and then sum the results, we get a value of 60%. This may not mean a ton to you in the abstract — it wouldn’t be quite right to say that 40% of the roster turned over — but it is very helpful if we are comparing teams. [continue reading…]

{ 0 comments }

Clyde Edwards-Helaire has had a really good 13 months. He’s gone 13-1 as a starter for the 2020 Chiefs, including a win in the AFC Championship Game. This is a nice continuation of his time at LSU, where Edwards-Helaire went 15-0 as the leading rusher for the Tigers. Since January 1, 2019, Edwards-Helaire has gone 29-1 in his 30 games.

CEH is on the verge of winning the national championship and the Super Bowl in back to back seasons, a pretty rare feat. There have been 14 players to win a national championship and an NFL championship in back to back seasons. [1]The NFL qualifier excludes two other seasons. In 1947, when Frank Kosikowski was on Notre Dame’s back-to-back champions in 1946 and 1947; as a rookie, he played in the AAFC with the Cleveland … Continue reading [continue reading…]

References

References
1 The NFL qualifier excludes two other seasons. In 1947, when Frank Kosikowski was on Notre Dame’s back-to-back champions in 1946 and 1947; as a rookie, he played in the AAFC with the Cleveland Browns, who also won the the championship. In 1961, end Tommy Brooker was a key member of the undefeated Crimson Tide team. In 1962, he was drafted by the Dallas Texans (now the Chiefs), and he played both end and kicker for the team. In fact, he kicked the game-winning field goal in overtime to capture the AFL title that season.
{ 0 comments }

Leading Rusher For Each Super Bowl Team

The 2014 Patriots were not very reliant on the ground team. Jonas Gray led the team in rushing yards with just 412 in 8 games, while Shane Vereen was second with 391 over the full season. Stevan Ridley had 340 in 6 games, while LeGarrette Blount had 281 in five appearances. Even as a team, New England only ranked 18th in rushing yards. And while Blount ran all over the Colts (30/148/3) in the AFC Championship Game, he was held to just 40 yards on 14 carries in the Super Bowl, which still managed to lead the team.

Among the now 110 teams to make the Super Bowl, the 2014 Patriots rank last when it comes to rushing yards gained by their leading rusher. The 1998 Broncos, of course, rank first: Terrell Davis rushed for 2,008 yards that season. The graph below shows the rushing yards (pro-rated to 16 game seasons for years with shorter schedules) for the leading rusher on each Super Bowl team: the winners are shown in black, the losers in green, and the Bucs and Chiefs are shown in team colors. [continue reading…]

{ 0 comments }

LeSean McCoy Is Looking For Back To Back Rings

Since the start of the 2010 season, no player has more rushing yards than LeSean McCoy. It is easy to forget, but McCoy spent some time as the starting running back for the 2019 Chiefs, even though he did not get a carry in the playoffs. McCoy rushed for 465 yards and 4 touchdowns in the regular season and did earn a ring with Kansas City and his former head coach.

It might be even easier to forget that McCoy is a member of the 2020 Buccaneers. He was signed in early August, before Leonard Fournette would make his way to Tampa Bay.  McCoy has been the team’s fourth string running back, behind Ronald Jones, Fournette, and Ke’Shawn Vaughn. But no matter: McCoy is, technically, back in the Super Bowl, for the second year in a row.

If Tampa Bay wins, McCoy — who was arguably the best running back of the 2010s — will close out his career with a pair of rings with two teams that nobody will ever associate him with. That said, he would join a pretty exclusive list. Here are the eight players who have won back to back rings with different teams.

  • The two famous members of the club pulled off this trick in 1994, as members of the San Francisco 49ers, and in a surrounding year with the Dallas Cowboys. One was Deion Sanders, who left Atlanta for San Francisco in 1994, and then San Francisco for Dallas in ’95. The other was Ken Norton, Jr., who spent the first six years of his career with Dallas, and won the Super Bowl in 1992 and 1993. Norton then joined the 49ers in ’94, where he spent the final seven seasons of his career. Hochstein and Norton are the only two players to win Super Bowls in three consecutive seasons.
  • Guard Russ Hochstein was the next player to do so. He was drafted by Tampa Bay in 2001 and played in one game in 2002; he was waived in October and signed by the Patriots a week later. He stayed in New England through 2008, so Hochstein picked up a Super Bowl ring for his cup of coffee with the Bucs and then earned two more the next two seasons in New England. Hochstein was also a freshman with Nebraska in 1997, when the Cornhuskers were named national champions by USA Today and ESPN. He’s got a lot of hardware!
  • Defensive back Derrick Martin played in five games for the Packers in 2010 and 14 for the Giants in 2011. Sure, Martin had just 1 interception and 14 tackles during those two years, but it counts!
  • Brandon Browner was the next to do it, and he had a big role in both title teams.  He was a star on the ’13 Seahawks, although he was suspended towards the end of the season and did not play in the team’s postseason run. He joined New England in 2014, and then made the play of the game — or, perhaps, the assist of the game — to help the Patriots defeat his former team. [1]Caylin Hauptmann was also a member of the 2013 Seahawks, and he was signed by the 2014 Patriots.  I don’t believe he should be included, but if you want to, feel free!
  • LeGarrette Blount led the NFL in rushing touchdowns in 2016 with New England, picking up a ring with the Patriots that season.  The next year he joined the Eagles, and scored a touchdown in Philadephia’s Super Bowl win over his former team. Chris Long was also a rotational defensive linemen on both the ’16 Patriots and ’17 Eagles.
  • Surely you don’t remember that Kenjon Barner was the kickoff returner for the ’17 Eagles, do you?  Barner, a star of Oregon under Chip Kelly, joined Philadelphia under Kelly’s watch and survived with the team through 2017.  The next season, he was signed by the Patriots and rushed for 71 yards before being cut in midseason.  No matter: when the ’18 Patriots went on to win the Super Bowl, Barner received a ring.  Literally.  Oh, and guess what? Barner is also a member of the ’20 Buccaneers, although he is unlikely to play in Super Bowl LV.  But I assume he is definitely ready for a third ring in four years.


References

References
1 Caylin Hauptmann was also a member of the 2013 Seahawks, and he was signed by the 2014 Patriots.  I don’t believe he should be included, but if you want to, feel free!
{ 0 comments }

How do Kansas City and Tampa Bay compare to previous Super Bowl participants when it comes to scoring and preventing points? Without any adjustments for era, these two teams look like awful defensive teams and very good (but not historically great) offensive teams.

In the graph below, the X-Axis shows points scored per game, while the Y-Axis shows points allowed per game. The best teams would be in the lower right, at least according to this metric. The Bucs and Chiefs are color-coded, with Super Bowl winners in black circles and losers in white circles. The ’99 Rams are in the lower right corner at 33 points per game and 15 points allowed per game; the ’13 Broncos are the team at the far upper right, while the ’11 Giants, of course, are in the upper left: they are the only Super Bowl team to allow more points than they scored. [continue reading…]

{ 1 comment }

Yesterday, I looked at how both the NFL and the upstart AFL dealt with the issue of integration in pro football. The common reframe is that the young, nontraditional AFL was more innovative and enlightened than the NFL, particularly on the issue of black players in pro football and the scouting of talent from small historically black colleges. The numbers don’t bear that out with black players generally, but today I want to focus on the game that is most responsible for creating that narrative: Super Bowl IV. [continue reading…]

{ 0 comments }

Leading Rushers In Each Super Bowl

The last running back to win the Super Bowl MVP was Terrell Davis, which happened over 20 Super Bowls ago. One reason for that is a decline in big rushing games in the Super Bowl, particularly with respect to the winning team. Just once in the last 16 Super Bowls — Dominic Rhodes back in SuperBowl XLI — has the winning team had a 100-yard rusher. Perhaps more interesting is that in the last 9 Super Bowls, the losing team had the game’s leading rusher more than half the time.

The graph below shows the leading rusher for both the winning and losing teams in the Super Bowl. The winning team’s leading rusher is in a full black circle, while the losing team’s leading rusher is in a white circle with a black outline. In addition, in the 13 of 53 Super Bowls where the game’s leading rusher was on the losing team, I’ve put that in a white circle with a red outline. [continue reading…]

{ 0 comments }

Super Bowl Teams In Year N-1

Last year, the Kansas City Chiefs were the #1 seed in the AFC, while the 49ers had the second-worst record in the NFL. This year, the two teams are in the Super Bowl. Today, let’s look at how each of the 108 Super Bowl teams fared in Year N-1 — that is, the year before making the Super Bowl.

For each team, I calculated their Pythagenpat record in Year N-1. The best Super Bowl team by Year N-1 Pythagenpat record was, unsurprisingly, the 1973 Dolphins. As we all know, the year before Miami went 14-0 and won the Super Bowl.

The 2019 Chiefs don’t fare all that well in this regard, mostly because the 2018 team ranked 24th in points allowed. Kansas City was the #1 seed, but it was not a dominant team by these standards. The 49ers, however, do stand out as particularly bad (although I’ll note that San Francisco, despite finishing with the 2nd pick in the 2019 Draft, “only” had the 6th worst Pythagenpat rating of 2018). The 2018 49ers are one of the worst 5 teams to make the Super Bowl the following season. [continue reading…]

{ 0 comments }

Super Bowl History: Test Your Knowledge

Can you name the winner and loser from each Super Bowl?

How about the Super Bowl MVP? The final score? The points spread? The stadium?

Test your knowledge below, by filling in as much as you can. Answers appear after the jump.

YearWinnerLoserSpreadPts WPts LSBMVPBoxscoreStadium
1966
1967
1968
1969
1970
1971
1972
1973
1974
1975
1976
1977
1978
1979
1980
1981
1982
1983
1984
1985
1986
1987
1988
1989
1990
1991
1992
1993
1994
1995
1996
1997
1998
1999
2000
2001
2002
2003
2004
2005
2006
2007
2008
2009
2010
2011
2012
2013
2014
2015
2016
2017
2018

[continue reading…]

{ 0 comments }

[Editor’s note: this is a repost from last year, with a few updates.]

The first four Super Bowls were all played on grass stadiums: the first Super Bowl was at Memorial Coliseum in Los Angeles, the Orange Bowl in Miami hosted Super Bowls II and III, and Tulane Stadium in New Orleans was the venue for Super Bowl IV.

But the dreaded AstroTurf revolution came to football in the ’70s. For Super Bowl V, the Orange Bowl in Miami was again the host site, but by now, the natural grass surface had been replaced with Poly-Turf, making it the first Super Bowl played on artificial turf.

[continue reading…]

{ 0 comments }

In Super Bowl II, Green Bay quarterback Bart Starr completed 13 of 24 passes for 202 yards, with 1 TD and no interceptions. He also took three sacks for 30 yards, and his backup was sacked once for 10 yards.

That means on 28 dropbacks, the Green Bay passing attack picked up 162 yards and produced 1 TD and 0 INTs, which translates to 142 Adjusted Net Yards. That’s an Adjusted Net Yards per Attempt average of 6.50 in Super Bowl II for Green Bay.

So was that a good performance by Starr and the Packers passing attack? No.

It was a great one. Passing efficiency was a lot different in 1967 than it is today, and the Raiders had a great pass defense. In 1966, Oakland allowed 3.14 ANY/A to opposing passers, the 3rd-best in the AFL; in 1967, that number dropped to just 2.23, the best in the AFL and third in all of pro football. And in 1968, opposing QBs averaged just 2.81 ANY/A against the Raiders. (And in 1969, it was just 2.64.)

The graph below shows every game for the Raiders defense from 1966 to 1968, in chronological order. Joe Namath consistently gave the Raiders problems, including in the famous Heidi Game in 1968. But otherwise, the Raiders pass defense tended to overwhelm most quarterbacks. On the X-Axis, we have games played in order. The Y-Axis shows the ANY/A allowed by the Raiders, shown from -6 to 14 (since the league average ANY/A was around 4.0). [continue reading…]

{ 0 comments }

On January 3, 2019, the St. Louis Blues had the worst record in the NHL. But by the end of the year, the Blues had captured their first championship. There is no similar success story in NFL history, but I was curious: which Super Bowl champion had the worst record after X games, for all X?

There have been 9 Super Bowl champions that began the year 0-1. That is not a very big hole from which to escape. But only three teams — the 1993 Cowboys, the 2001 Patriots, and the 2007 Giants — have won the Lombardi Trophy after an 0-2 start. And in the first two cases, it’s noteworthy that Emmitt Smith and Tom Brady were not part of that 0-2 start, but entered the starting lineup in week 3.

What about the worst team after 3 games to win a Super Bowl? 5 teams have begun the season with a 1-2 mark; the three teams mentioned above, along with the 1981 49ers and the 2018 Patriots.

After 4 games? Just one team has started 1-3 and won the Super Bowl: the 2001 Patriots.

After 5 games? Two teams have started 2-3 and won the Super Bowl: the 2001 Patriots and the 1980 Raiders.

After 6 games? No team has been 2-4, with the ’01 Patriots, ’80 Raiders, and the 2010 Packers.

After 7 games? Only team, the 2001 Patriots, had a losing record at 3-4 after 7 games.

After 8 games? Only the 2001 Patriots were 4-4 after 8 games; the other 52 Super Bowl champions had a winning record at this point in the season.

After 9 games? No team had a losing record and won the Super Bowl; in addition to the ’01 Patriots, the ’00 Ravens were the only other team at 5-4 after 9 games that won it all in the Super Bowl era (the ’57 Lions also pulled off this feat).

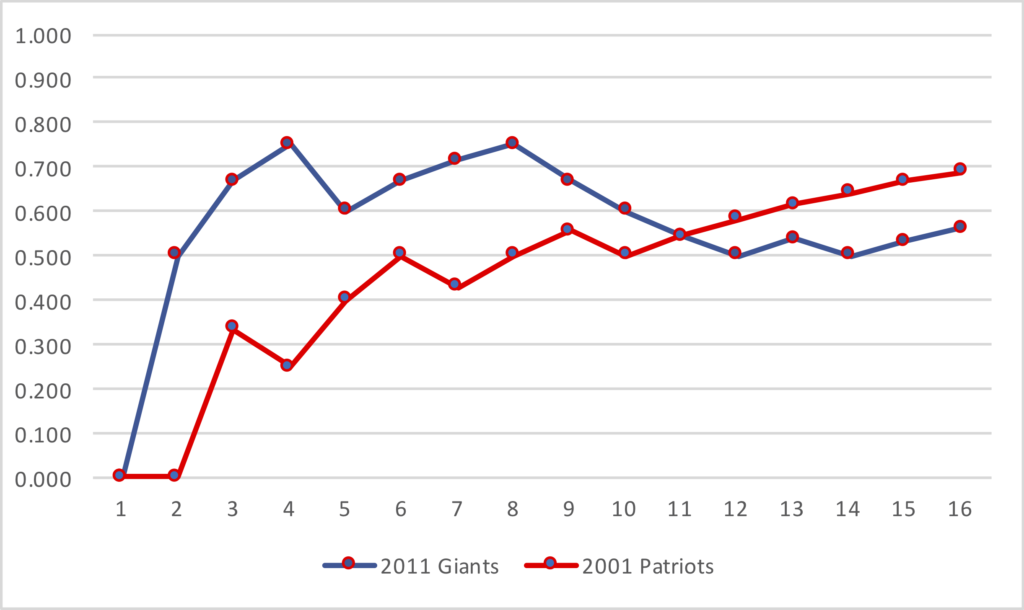
After 10 games? Yes, once again, we have a field of one: the 2001 Patriots are the only team without a winning record after 10 games, as New England began this season 0-2, 1-3, 3-4, and 5-5. That was the team’s last loss of the season.

After 11 games? Three teams started 6-5: the ’88 49ers, ’01 Patriots, and a new entry: the ’11 Giants.

After 12 games? Just one Super Bowl champion, the 2011 Giants, failed to have a winning record at this point in the season.

After 13 games? The 2011 Giants, at 7-6, are the lone entry here.

After 14 games? The 2011 Giants were 7-7! Only one other team, the 2010 Packers at 8-6, had even 6 losses after 14 games.

The 2011 Giants were the only team to win the Super Bowl with 7 losses, so they are the Super Bowl champion with the worst record after 15 and 16 games, too.

So the Patriots had the single worst record, either alone or tied with other teams, of any Super Bowl champion through X games, for all values of X from 1 to 11. At 6-5, the 2011 Giants were tied with the Patriots (and ’88 49ers) for worst record, and the 2011 Giants hold the mark for worst record of any Super Bowl champion through X games, for all values of X from 11 to 16. The graph below shows the winning percentages of both teams after each game of the regular season.
What do you think?

{ 0 comments }

Yes, this was the lowest-scoring Super Bowl ever. Just as the game ended, I tweeted this graph:

But this game was even more anemic than you think, once you consider the two teams in the game. Consider that in the regular season, Los Angeles averaged 32.9 points per game, just 1/16th of a point per game more than the famed ’99 Rams. In fact, the ’18 Rams were the 6th-highest scoring offense to ever make the Super Bowl, behind five other Super Bowl losers: the ’13 Broncos, ’07 Patriots, ’83 Redskins, ’16 Falcons, and ’67 Raiders. But by being held to just 3 points, Los Angeles came in at a whopping 29.9 points below their regular season average. That narrowly (by, in fact, 1/16th of a point per game) bests the ’13 Broncos as the biggest underachieving result in the Super Bowl. There have been 106 teams to play in the Super Bowl, and despite being the 6th-highest scoring team to make it, LA finished as one of just two teams to score only 3 points in the Super Bowl (no team has ever been shut out).

Edelman didn’t score and the Patriots went 3/12 on 3rd downs…. and he was still the best player on the field.

But the Patriots don’t get off easy here. In the regular season, New England averaged 27.3 points per game, but in Super Bowl LIII, the Patriots couldn’t even get halfway to that total. With just 13 points, New England finished 14.3 points below their regular season average, the single worst result by any of the 53 Super Bowl winners.

So there you have it: the Rams were the lowest scoring team (relative to their average) of any team to lose in the Super Bowl, and the Patriots were the lowest scoring team (relative to their average) of any team to win the Super Bowl. With just 16 points, this was the lowest scoring Super Bowl, of course, but it was expected to be the third highest scoring Super Bowl ever! The Over/Under was 55.5 points, which trails only the ’16 Super Bowl (New England/Atlanta, with an O/U of 57.0 points and 62 points actually scored) and the ’09 Super Bowl (New Orleans/Indianapolis, 56.5, 48). [continue reading…]

{ 1 comment }

The first four Super Bowls were all played on grass stadiums: Memorial Coliseum in Los Angeles, the Orange Bowl in Miami for Super Bowls II and III, and Tulane Stadium in New Orleans.

But the dreaded AstroTurf revolution came to football in the ’70s. For Super Bowl V, the Orange Bowl in Miami was again the host site, but by now, the natural grass surface had been replaced with Poly-Turf, making it the first Super Bowl played on artificial turf.

The same thing happened the next year, at Super Bowl VI, as Tulane Stadium followed suit and resurfaced its field with Poly-Turf. And after a return to Memorial Coliseum for Super Bowl VII, the Dolphins and Vikings met in the first Super Bowl played on nylon texturized AstroTurf in Super Bowl VIII:

[continue reading…]

{ 0 comments }

There have been 52 Super Bowl games played so far, but they have featured just 17 upsets. But a Super Bowl upset was once extremely rare. The Jets and Chiefs produced the first two Super Bowl upsets, in Super Bowls III and IV, respectively. But then there wasn’t a single Super Bowl upset during the decade of the 1970s! (Excluding, of course, Super Bowl IV, which concluded the 1969 season but took place on January 11th, 1970).

In the 1980s, there were 4 Super Bowl upsets, all featuring the Raiders or the Redskins (or both). Oakland beat Philadelphia in 1980, Washington beat Miami in 1982, the Raiders beat the Redskins in ’83, and the Redskins upset the Broncos in ’87. All featured point spreads of 3.5 or fewer points, in contrast to the two double digit upsets from the AFL teams.

In the ’90s, there were just TWO upsets in the Super Bowl: the Giants over the Bills and the Broncos over the Packers. When Tom Brady and the Patriots took the field as underdogs in Super Bowl XXXVI, but 8 of the first 35 Super Bowls had featured upsets. But beginning with that first Patriots/Rams Super Bowls, there have been a whopping 9 upsets in 17 games (and the denominator is really 16 here, since one Super Bowl had an even point spread and therefore couldn’t feature an upset)! In other words, we’ve gone from an upset happening less than 25% of the time to an upset happening over 50% of the time.

Beginning with the first Patriots Super Bowl, and excluding the New England/Seattle Super Bowl (which featured the even points spread), there have been 16 Super Bowls with a favorite during the Brady/Belichick era. Of those 16 Super Bowls, the favorites have lost 9 times, and failed to cover in 3 of the 7 times that they actually won! There have been just 6 times in Super Bowl history that the favorite won but failed to cover the point spread, so that means half have occurred in relatively recent history.

From 1966 to 2000, favorites went 22-11-2 against the spread during the first 35 Super Bowls. In the 16 Super Bowls since 2001 to feature a favorite, those favorites have gone just 4-12 against the spread. The graph below shows the point spread (in red) and margin of victory (in blue) for the Super Bowl winner in each game. The point spread is shown as an expectation of how much the winner was expected to win by (so the Jets in Super Bowl 3, rather than shown as +18, are shown as -18). All Super Bowl upsets feature red bars that are negative.

What stands out to you?

{ 0 comments }

Today’s guest post/contest comes from Thomas McDermott, a frequent guest contributor. As always, we thank him for his hard work.


Author’s note regarding the numbers: The Win Probability (WP) numbers shown below were, for the most part, generated using a formula presented by Wayne Winston in his book Matheletics, and subsequently improved upon by Pro Football Reference for their WP model. [1]While in the process of messing around with PFR’s WP Calculator, I have noticed differences between the results from the Calculator and the results from using the formula as shown on their web … Continue reading

The heart of the formula is the Excel NORMDIST function, which returns the normal distribution (the probability) for a given mean and standard deviation. I have made some minor adjustments to this formula, but it is basically the same. The formula requires the use of Expected Points data; the EP dataset I use comes from Brian Burke’s Advanced Football Analytics site (when it was active), and I have adjusted those numbers for era. Since the formula falls apart in certain areas – most importantly, the 4th quarter when the game is close – I abandon it and use other data to generate a WP number. Field goal success rates, 4th down success rates, drive results, PFR’s Play Index and the recently provided play-by-play data from Ron Yurko on GitHub, are some of my alternate sources. I realize there’s a “black box” aspect to Win Probability analysis (if you can find two models that completely agree, let me know), since it’s not something that can be easily checked, and perhaps especially suspect when the author openly states that he adjusts the numbers “manually”. To that I can only say that my intent is to provide as accurate a picture as possible of the games that I analyze, and I’m open to any suggestions, comments or questions. Thanks. [continue reading…]

References

References
1 While in the process of messing around with PFR’s WP Calculator, I have noticed differences between the results from the Calculator and the results from using the formula as shown on their web page. I have a hunch that PFR has probably moved on from the formula and is using a more sophisticated model (which perhaps incorporates the formula?), but I’m not sure.
{ 0 comments }

Brady flexed his passing muscles in Super Bowl LII

Tom Brady had a Super Bowl performance for the ages. He completed 28 of 48 passes for 505 yards, with 3 TDs and 0 INTs, while taking only one sack (which, of course, was a strip-sack that ultimately decided the game). That translates to 560 Adjusted Net Yards (giving 20 yards for a touchdown and removing sack yards), which over 49 dropbacks, is 11.43 Adjusted Net Yards per Attempt.

In the regular season, the Eagles defense allowed just 5.10 Adjusted Net Yards per Attempt to opposing quarterbacks. Therefore, Brady was a whopping 6.32 ANY/A above expectation; over the course of 49 dropbacks, it means Brady produced 310 Adjusted Net Yards above expectation.

The beauty of this formula is that it inherently adjusts for both schedule and era. Below are the best passing performances in Super Bowl history. Nobody can match the efficiency over such a high number of passing plays as what Brady did last night: [continue reading…]

{ 137 comments }

Today’s guest post comes from Miles Wray, a long-time reader of the site. You may know him as the host of the daily NBA podcast The 82 Review. You can also find him on Twitter @mileswray. What follows are Miles’ words: as always, we thank our guest writers for their contributions.


It’s not a career goal that anybody would — or even could — shoot for, but it’s a goal that any player would still be proud of: to win the Super Bowl with two separate teams. There are 38 players in the league’s history who have accomplished the feat — it’s an achievement more rare, at the very least, than a Hall of Fame career.

It feels reasonable to assume that most of those 38 dual-winners played in the 21st century, during the sport’s highest-ever era of roster churn. But no: there are only two active players who are dual winners — perhaps because there are more NFL teams than ever today, meaning that any individual team of yesteryear had a greater percentage chance of getting to the Super Bowl. [1]The 36 retired players with this distinction are, in alphabetical order: Herb Adderley, Matt Bahr, Robert Bailey, Jim Burt, Bill Curry, Billy Davis, Dave Duerson, Marv Fleming, Andy Frederick, … Continue reading One of those two active players has a credible Hall of Fame case: Adam Vinatieri, victor in 2001, 2002, and 2004 with the Patriots, and also in 2006, his very first year with the Colts. The other is an undrafted linebacker who just went through a 3-13 season: Jonathan Casillas won the 2009 Super Bowl with the Saints — where he helped recover the infamous surprise onside kick at the start of the second half — and also was acquired as a special-teamer in a fortuitous midseason trade by the Patriots in 2014.

One way or another, Vinatieri and Casillas will have company after this Super Bowl Sunday. On the Patriots roster, there is hired mercenary James Harrison, winner in both 2005 and 2008 with the Steelers. The Eagles, on the other hand, have apparently made it an intentional strategy to sign past winners. The Philadelphia roster is flush with eight ring-wearers. Since the Eagles have never won a Super Bowl, all eight of these players acquired their hardware with other squads: [continue reading…]

{ 11 comments }

In 2017, just 15 of the 352 starts (4.3%) by the New England Patriots came from rookies.  Just four rookies produced any points of Approximate Value for the 2017 Patriots: three defensive linemen (Adam Butler, Deatrich Wise Jr., and Eric Lee) combined to just 10 points of AV, with third-string TE Jacob Hollister gaining 1 point. No team got less out of rookies in 2017 than New England, which makes sense given that (a) New England did not have a first or second round pick, (b) the team had just four picks (with only Wise producing AV or a start), and (c) the Patriots had quality starters at most positions throughout the team, leaving few opportunities for rookies to steal playing time.

For the Eagles, rookies didn’t contribute much more. Kicker Jake Elliott, backup CB Rasul Douglas, backup RB Corey Clement, and DE Derek Barnett (the team’s first round pick who played on 41% of snaps) each produced 3 points of AV, the most for any Eagles rookie. Linebackers Joe Walker and Nathan Gerry, and wide receiver Mack Hollins, each had two points of AV, with third-string QB Nate Sudfeld and backup OL Elijah Qualls bringing one point of AV.

Rookies produced only 8% of the AV by all Philadelphia players this year. Yes, every player is valuable, but compared to the rest of the NFL, the Super Bowl participants — again — didn’t get much from rookies.

The table below shows the percentage of team AV that came from rookies for all teams this year. The Saints were the only team in the top 5 that made the playoffs, although the Bills, Jaguars, and Chiefs also saw substantial contributions from rookies. [continue reading…]

{ 5 comments }

Yesterday, I analyzed whether having a great quarterback is more important than ever when it comes to winning it all. The evidence provides a straightforward answer: no.

Today I want to examine the question from another perspective: what about how the eventual Super Bowl-winning quarterback looked prior to the season? From ’99 to ’02, we had four straight quarterbacks come out of nowhere to win the Super Bowl. In 1998, Kurt Warner threw 11 passes. In ’99, Warner won the Super Bowl, while Trent Dilfer ranked 29th among qualifying passers in ANY/A. But in 2000, Dilfer won the Super Bowl, while Tom Brady threw just three passes. In 2001, Brady won the Super Bowl, while a 33-year-old Brad Johnson looked past his prime, as he ranked 24th in ANY/A; the next year, of course, Johnson won the Super Bowl.

Nobody even thought about Warner or Brady in May of the year they won their first Super Bowls, and Dilfer and Johnson were veterans who did not fit within any definition of the words “great quarterback.” And yet, for four straight years, they shocked the football world.

So I wondered: how did each passer rank the year before they won the Super Bowl? A brief departure:

  • Jeff Hostetler and Doug Williams each started just two games in 1990 and 1987, respectively, but both won the Super Bowl. Neither played much in the year before they won the Super Bowl, either. For purposes of this study, I am going to use Phil Simms and Jay Schroeder as the starting quarterbacks of the ’90 Giants and ’87 Redskins, although using Hostetler and Williams obviously makes the case even stronger for the “come out of nowhere” theory.
  • Earl Morrall led the first 4th quarter comeback in Super Bowl history, but because Johnny Unitas was both the Colts starter for nearly all of 1970, and the starter in Super Bowl V, I am listing Unitas as the quarterback for that Colts team. Morrall does, however, get credit as the 1972 Dolphins quarterback, which is consistent with giving Simms and Schroeder credit.

Failed to Qualify

In addition to Warner and Brady (and ignoring Hostetler and Williams), there were 7 other quarterbacks who failed to register enough attempts to qualify for the passing crown the year before they won the Super Bowl. That includes 5 straight quarterbacks in the early ’70s.

In 1970, Roger Staubach was the backup to Craig Morton, but Staubach won the championship with an all-time great season the next year. In ’71, Morrall was the backup to Bob Griese, but Morrall was the main starter for the ’72 Dolphins due to Griese’s injury. And that means Griese ’72 makes our list, too, since Griese won it all in ’73. Terry Bradshaw in 1973 had just 180 pass attempts, so he didn’t have the 196 passes necessary to qualify for the passing crown (but he was so bad that if he did qualify, he would have ranked just 21st out of 24 passers in ANY/A). The next year he started 7 of 14 games for the ’74 Steelers but ranked 2nd on the team in pass attempts with just 148; as a result, he doesn’t have enough attempts to qualify when looking at Year N-1 performances, which is relevant since the ’75 Steelers won it all. So the ’71 Cowboys, ’72 Dolphins, ’73 Dolphins, ’74 Steelers, and ’75 Steelers all get labeled as having starting quarterbacks who the year before, did not have enough pass attempts to qualify for the passing crown.

The other two quarterbacks are Jim Plunkett and Jim McMahon. In 1979, Plunkett threw 15 passes for the Raiders and was viewed as a draft bust; a year later, he won the Super Bowl. In 1984, McMahon suffered a season-ending injury after just 143 attempts. [continue reading…]

{ 31 comments }

Super Bowl Champions, by Draft Value

The New England Patriots won Super Bowl LI, but it wasn’t because the team was packed full of high draft picks. Of the five Patriots who had more than 10 points of AV, only one was drafted in the first four rounds. Regular readers know that I created an AV-based draft value chart, which assigns points to each draft pick based on the expected marginal production produced by that pick.

Well, you can calculate a team’s weighted average draft value by doing the following:

  • Calculate the draft value spent on each player on the roster who produced at least 1 point of AV that season.
  • Calculate the percentage of team AV produced by each player. This is key, otherwise Chris Long would skew the results in the wrong direction.
  • Multiply the results in steps 1 and 2, and then sum those values.

Here’s how it would work with the 2016 Patriots, who had an average draft value (as a roster, and weighted by AV) of 6.72.

PlayerPosAVPerc of TmAV%Draft PkDraft ValWt Draft Val
Dont'a HightowerILB145.4%2514.10.76
Malcolm ButlerCB135%udfa00.00
Tom BradyQB135%1990.90.05
Marcus CannonOL135%1383.20.16
Julian EdelmanWR114.2%23200.00
Devin McCourtyDB103.8%2713.60.52
Nate SolderT103.8%1716.60.64
Alan BranchDT93.5%3312.30.43
LeGarrette BlountRB83.1%udfa00.00
David AndrewsC83.1%udfa00.00
Shaq MasonC83.1%1313.60.11
Joe ThuneyOG83.1%786.90.21
Malcom BrownDT83.1%3212.50.38
Chris HoganWR72.7%udfa00.00
James WhiteRB72.7%1303.60.10
Trey FlowersDE72.7%1015.20.14
Martellus BennettTE72.7%618.40.23
Rob NinkovichDE62.3%1353.40.08
Jabaal SheardDL62.3%3711.60.27
Patrick ChungDB62.3%3412.10.28
Chris LongDE62.3%230.20.70
Nate EbnerDB51.9%19710.02
Logan RyanCB51.9%836.50.13
Jamie CollinsOLB51.9%529.40.18
Rob GronkowskiTE51.9%4210.80.21
Elandon RobertsILB41.5%2140.40.01
Cameron FlemingOT41.5%1403.10.05
Malcolm MitchellWR41.5%1124.60.07
Shea McClellinDE41.5%1915.80.24
Dion LewisRB31.2%1492.70.03
Stephen GostkowskiK31.2%1184.20.05
Vincent ValentineDT31.2%965.50.06
Eric RoweCB31.2%4710.10.12
Danny AmendolaWR20.8%udfa00.00
Jonathan FreenyDE20.8%udfa00.00
Ryan AllenP20.8%udfa00.00
Ted KarrasOG20.8%2210.20.00
Duron HarmonFS20.8%915.90.05
Jacoby BrissettQB20.8%915.90.05
Jimmy GaroppoloQB20.8%628.30.06
Kyle Van NoyOLB20.8%4011.10.09
Barkevious MingoOLB20.8%623.20.18
Jonathan JonesDB10.4%udfa00.00
Anthony JohnsonDT10.4%udfa00.00
Justin ColemanCB10.4%udfa00.00
Brandon KingDB10.4%udfa00.00
Woodrow HamiltonDL10.4%udfa00.00
Joe CardonaLS10.4%16620.01
Geneo GrissomOLB10.4%975.50.02
Jordan RichardsSS10.4%648.10.03
Cyrus JonesCB10.4%608.50.03
Total260100%6.72

[continue reading…]

{ 0 comments }

Guest Post: Alternative Super Bowl MVPs

Today’s guest post comes from Damon Gulczynski, a longtime reader, Seattle sports fan, and part-time writer. He also wrote this book on baseball names. As always, we thank our guest posters for contributing.


White runs for a score against the Falcons

James White was fantastic in Super Bowl LI, setting records in receptions (14) and total points (20), but he did not win the MVP Award.  Instead the voters bestowed that honor on a player who reduced his team’s chances of winning by nearly 15% on a single play (Robert Alford’s pick-six).  That, of course, is a misleading statement — Tom Brady went on to finish the game with over 450 passing yards in leading his team to the greatest comeback in Super Bowl history — but it is completely accurate to say James White was fantastic.  It would not have been unreasonable in the least to pick him over Brady for game MVP.  Super Bowl LI was a case where it would have been more representative of the story of the game to give out two MVP awards — or better yet to have a “three stars” of the game system, like hockey, so that Trey Flowers (2.5 sacks) could have been recognized along with Brady and White.

With this in mind, for fun, I decided to go through each of the 51 Super Bowls and retroactively select the three stars of the game.  In making these selections I relied on box scores, play-by-play logs, news articles, and video clips from past Super Bowls.  My full list is given below.  The actual Super Bowl MVPs are denoted with a + sign after their name; players on the losing team are denoted with a ~ after their name.  In 30 of the 51 cases the MVP was my first star of the game, which means I think the voters “got it wrong” 21 times.  And in six cases I think they really got it wrong, as the player they chose for MVP did not even qualify as my third star of the game. [continue reading…]

{ 29 comments }

A couple of years ago, I wrote a detailed breakdown about Super Bowl squares. Well, it’s that time of year again, so I’m going to repost that article here to help you cheat to win at your Super Bowl party.

Every Super Bowl squares pool is different, but this post is really aimed at readers who play in pools where you can trade or pick squares (surely no pool has a prohibition on this!) I looked at every regular season and postseason game from 2002 to 2013. [1]Yes, this means your author was too lazy to update things for the 2014, 2015, or 2016 seasons. I suppose the rule change moving back the extra point would probably change things ever so slightly, … Continue reading The table below shows the likelihood of each score after each quarter, along with three final columns that show the expected value of a $100 prize pool under three different payout systems. The “10/” column shows the payout in a pool where 10% of the prize money is given out after each of the first three quarters and 70% after the end of the game; the next column is for pools that give out 12.5% of the pool after the first and third quarters, 25% at halftime, and 50% for the score at the end of the game. The final column is for pools that give out 25% of the pot after each quarter — since I think that is the most common pool structure, I’ve sorted the table by that column, but you can sort by any column you like. To make the table fully sortable, I had to remove the percentage symbols, but “19, 6.7, 4.1, 2” should be read as 19.0%, 6.7%, 4.1%, and 2.0%. [continue reading…]

References

References
1 Yes, this means your author was too lazy to update things for the 2014, 2015, or 2016 seasons. I suppose the rule change moving back the extra point would probably change things ever so slightly, given the small increase in missed extra points.
{ 5 comments }

Joe Montana had what many consider to be the best performance in Super Bowl history. In Super Bowl XXIV against the Broncos, Montana completed 22 of 29 passes for 297 yards and 5 touchdowns, with 1 sack for 0 yards. Jerry Rice was the biggest beneficiary, catching 7 passes for 148 yards and 3 touchdowns, in a 55-10 blowout of the Broncos.

Do the math, and Montana averaged 13.23 Adjusted Net Yards per attempt that day. Making it even more impressive is that he was facing a Broncos defense that allowed just 3.89 ANY/A to opposing passers during the regular season. That means Montana averaged 9.35 additional ANY/A relative to the average Broncos opponent. Over 30 dropbacks, that’s 280 Adjusted Net Yards of Value that Montana added. That’s the most in Super Bowl history, just ahead of what Doug Williams did two years earlier against the Broncos.

In that game, Williams was 18/29 for 340 yards with 4 TDs and 1 INT, and one sack for 10 yards. That’s an ANY/A of 12.17, but it came against a slightly tougher defense: the Broncos allowed 3.77 ANY/A that season. So Williams was 8.40 ANY/A better than “expected” against Denver, over 30 dropbacks; that means he produced 252 ANY of value in the Super Bowl.

Below are those numbers for each of the 128 passers in Super Bowl history. For Super Bowls prior to 1981, I had to use estimated sack data rather than actual, with the formula for estimated sacks being simply (Team Sacks) * (QB Pass Attempts/Team Pass Attempts). [continue reading…]

{ 40 comments }

Best Offensive/Defensive Super Bowl Matchups

Three years ago, I wrote about how the Broncos/Seahawks Super Bowl was going to be the best matchup between offensive and defensive teams in Super Bowl history. This year doesn’t quite match that hype — particularly given that the Patriots defense isn’t as good as you might think, and that New England is actually more of an offensive team than a defensive team. If anything, this Super Bowl should be remembered as a matchup of two great passing attacks, rather than an offensive/defensive showdown.

But if we want to just look at points scored and points allowed, then yeah, this still stands out as a pretty good matchup of the number one scoring team in the NFL (Atlanta) against the number on team in points allowed (New England). The Falcons scored 33.8 points per game this year, while the Patriots allowed just 15.6; that produces a differential of 18.1 (difference due to rounding), which would make this the 5th best “offense/defense showdown” in Super Bowl history: [continue reading…]

{ 2 comments }

Super Bowl Streaks And Conference Affiliation

The NFL and the Lombardi Packers won the first two Super Bowls. Then, each conference went on a long streak:

  • The AFL/AAFC won 11 of the next 13 Super Bowls (1968-1980): the Jets and Chiefs closed out the AFL with Super Bowl upsets, while the Steelers, Dolphins, and Raiders carried the AFC.
  • Then, from 1981 to 1996, the NFC won 15 of the next 16 Super Bowls, with the 49ers and the NFC East teams (well, not all of them) carrying the conference to 13 of those titles.
  • The balance shifted then to the AFC, as the conference won 8 of the next 10 Super Bowls (1997 to 2006).  The Patriots won three of those, but perhaps most surprising was that the run ending with 18-0 New England losing as heavy favorite to the Giants.

Since then? The NFC went on a mini-run, winning 6 of 8 Super Bowls from 2007 to 2014.   The AFC has responded by winning the last two Super Bowls, and the conference is again a favorite in Super Bowl LI. Here are the results in graphic form, with NFL/NFC wins in blue, and AFL/AFC wins in red: [continue reading…]

{ 9 comments }

How will the Broncos do without Peyton Manning? There are certainly reasons to think Denver will be fine, and Von Miller is one of the biggest reasons. Last year, the Broncos ranked in the bottom 3 in offensive ANY/A and 2nd in defensive ANY/A. According to Football Outsiders, the Broncos ranked 25th in passing DVOA and 1st in DVOA on pass defense. Sure, Mark Sanchez is not great, but he’s pretty familiar with taking a team with a bad offense and a great defense to the playoffs.

Among the 50 Super Bowl winners, Denver had arguably the worst passing offense during the regular season of those teams.  The table below displays each team’s Relative ANY/A — i.e., each team’s ANY/A relative to league average.  The Broncos offense averaged 5.14 ANY/A, which was just over a full ANY/A below average.  On the X-Axis, I have plotted how each Super Bowl winner fared in offensive RANY/A; on the Y-Axis, I have shown defensive ANY/A.  So the 2015 Broncos will be (relatively) high and to the left; the 2002 Bucs/2013 Seahawks will be very high and in the middle, and the ’98 Broncos/’06 Colts will be down and to the right.  Teams like 1966 Green Bay and 1991 Washington were really, really good and balanced, so they are up and to the right. [continue reading…]

{ 11 comments }

Anderson clinches the title for Denver

Anderson clinches the title for Denver

The Denver Broncos didn’t exactly ride the team’s offense to a Super Bowl title, but C.J. Anderson did have a great postseason run. The Broncos back rushed for at least 72 yards and gained at least 83 yards from scrimmage in all three games. He had 32.6% of all yards from scrimmage gained by Denver players in the postseason, which ranks 15th among the leaders in that category on the 50 Super Bowl champions.

The player with the most yards from scrimmage in a single postseason is John Riggins, who rushed for an incredible 610 yards and picked up 625 yards from scrimmage for Washington after the 1982 season. But on a per-game basis, Marcus Allen a year later was even better: in three games, Allen rushed for 466 yards and four touchdowns, while also gaining 118 yards through the air. That gave him an incredible 584 yards from scrimmage and 5 touchdowns in three games, and one of the most famous highlights in NFL history.

Allen also holds the record for most yards from scrimmage during the postseason among the 50 Super Bowl champions. Anderson ranks a respectable 15th in this category: [continue reading…]

{ 2 comments }

Super Bowl 50: The Best Defensive Super Bowl Ever?

Where does Super Bowl 50 rank among the greatest upsets in Super Bowl history?

Von Miller captures the Super Bowl MVP

Von Miller captures the Super Bowl MVP

Super Bowl 50 will go down as one of the bigger upsets in Super Bowl history, but it’s clearly not one of the biggest ever. Even given the recency of the game, it still falls far behind Super Bowl III (Jets/Colts), Super Bowl IV (Chiefs/Vikings), Super Bowl XXXII (Broncos/Packers), Super Bowl XXXVI (Patriots/Rams), or Super Bowl XLII (Giants/Patriots, 2007).  All five of those games had double-digit point spreads, but went to the underdogs.

Super Bowl XXV (Giants/Bills) featured a 6.5-point spread and was one of the more memorable upsets. And two recent underdogs won with 4.5-point spreads — Ravens over 49ers, Saints over Colts.  From a purely point spread look, Super Bowl 50 would slot in right there, at tied for #7, as the line closed at 4.5 points.  From a purely subjective standpoint, I’d probably put this game in the middle of those two:  the Saints game looked like a big upset, but the stats guys were on New Orleans, and the line may have only been in the Colts favor because of the team’s experience edge.  I picked the 49ers to win by six points, which is what I had Carolina winning by yesterday, too.  But with Denver a 12-4 team and the #1 seed, I think this game feels like less of an upset than Ravens/49ers. [continue reading…]

{ 37 comments }
Previous Posts