≡ Menu

Roster Building with AV Outliers

Today’s article comes from friend of the site Pierce Conboy, whom you can find in the comments as pgc or on Twitter as @pgconb. Below the line are his words. Enjoy.


Pro Football Reference is undoubtedly one of my favorite websites, so initial apologies for what amounts to taking pot shots at Approximate Value (AV) in a way that they did not intend, though consistent with how it’s widely misused by football fans at large.

This project is fairly nebulous and has no actual rules aside from a general attempt to create an extremely high AV team that would get crushed by a low AV team. I held my offense and defense below 100 AV apiece which was my arbitrary self-imposed ceiling along with keeping the average era from each of the two teams relatively close.

Here are the squads I came up with, having also consulted with Bryan, Bipedal-Moose from Reddit and cribbing from Turney and Troup articles at Pro Football Journal. [continue reading…]

{ 0 comments }

Suppose you know for certain that prior to kickoff, a team has a 30% chance of winning.

Question: What are the odds that at some point in the game, this team has a win probability of at least 50%? And here I mean real win probability, not just that some win probability model says they have a 51% chance.

Now, here come the real two questions I want you to answer.

1) Is the answer question: (a) something that is just trivia, or (b) relevant information for NFL analyst?

2) Is this something that you can/should use data to answer, or something that can/should be answered using logic and intuition?

{ 1 comment }

A random thought experiment for you guys today. Suppose you are the owner of an expansion team, with a below-average offense line, a below-average set of skill position players, and a below-average defense. Your only goal is to get to at least .500 in your first season.

By luck, you do have one wish. You get to have as your quarterback either Cam Newton or Joe Montana; in either case, you would get your quarterback in his prime, so you’re getting the best Newton or Montana possible.

Which would you choose? The obvious answer, of course, is Montana: a man always in discussion for the title of best quarterback of all time, and an AP All-Pro three times in four years during (one stretch of) his prime.  But in this example, there’s no Jerry Rice, Dwight Clark, Freddie Solomon, Roger Craig, John Taylor.  And, perhaps most importantly, no Bill Walsh.

With Newton, you get arguably the best running quarterback in football history, but a player whose passing efficiency stats have been average at best in four of the last five seasons.  But Newton has a lot more experience carrying below-average teams to success than Montana.

So who would you pick, and why?

{ 0 comments }

Running backs are some of the greatest athletes in the sport. From a BMI-to-athleticism ratio — which admittedly I’m making up as a thing — running backs are up there with any other position with the exception of defensive end, where some of those athletes look like they came from other planets.  When you think of the great running backs in NFL history, you think of the bruising power of an Earl Campbell, Larry Csonka, Jerome Bettis, or John Riggins, or the speed of a Barry Sanders, Gale Sayers, Chris Johnson, or Marshall Faulk or the unmatchable power/speed combination of an O.J. Simpson, Jim Brown, Adrian Peterson, or Bo Jackson.

And yet, we all seem to understand that the great running back is fading from the NFL.  Le’Veon Bell still can’t get his long-term contract, and Devonta Freeman is the second highest paid running back with a contract paying him $8.25M per year.  And it’s not just free agent running backs that are struggling: draft capital being spent on running backs is still on the decline, although the 2018 Draft (which was regarded as very running back heavy) had a bit of a rebound. [continue reading…]

{ 0 comments }

Today’s post is an outside the box thought experiment.  I’d love to hear your thoughts on whether this could actually work for an NFL team.

There’s nothing more valuable in the modern NFL that a good quarterback on a rookie contract. Despite that golden rule, teams are not wont to spend multiple draft picks on quarterbacks in the same draft. Since the new CBA was adopted in 2011, only two teams have spent two picks on quarterbacks in the same draft, and no team has used three.

Famously, Washington selected Robert Griffin with the second overall pick in 2012 and then drafted Kirk Cousins early in the fourth round.  That second decision turned out to be a brilliant move by the Redskins in retrospect, even if many criticized that plan at the time.  The other example was in that same draft: Indianapolis selected Andrew Luck with the first overall pick, and took Chandler Harnish with the last overall pick. [continue reading…]

{ 37 comments }

What Is The Market Value For Jimmy Garoppolo?

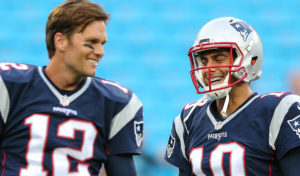
The Patriots leader in passer rating in 2016, and Tom Brady

If you were an NFL team in need of a quarterback, you would certainly be interested in trading for Patriots backup Jimmy Garoppolo. The big question, of course, is what is he worth?

Garoppolo was the 62nd overall pick in the 2014 Draft. If he never took a snap between now and then, his market value would presumably have dropped. He, like all second round picks, signed a four-year deal, with cap hits of $633,436 in 2014, $791,795 in 2015, $950,154 in 2016, and $1,108,513 in 2017. If Garoppolo turns into even a serviceable NFL quarterback, his salary cap hit will go up astronomically, and his next contract could be somewhere in the range of $15M to $20M per year against the cap. An enormous part of the value of a draft pick is the four cost-controlled seasons; with Garoppolo, three of those are already toast. So while you could argue that a quarterback who sat for three years would likely be a better player in year 4 than a rookie quarterback, Garoppolo’s market value would still drop — significantly, I think — by virtue of having him on a cheap one-year deal versus having a rookie on a cheap four-year deal.

But, as we know, Garoppolo has played since being drafted. And while he didn’t do much his first two seasons, throwing for 188 yards on 31 passes, Garoppolo averaged 8.59 ANY/A on 66 dropbacks last season. Anecdotally, too, it seems as though the league views him as a strong prospect, giving him a higher grade than they did three years ago when he slipped to the end of round two. [continue reading…]

{ 41 comments }

Adam Steele is back for another guest post. You can view all of Adam’s posts here. Adam is now on Twitter, and you follow him @2mileshigh. As always, we thank him for contributing.


In 2014, Football Perspective ran a pair of crowd sourcing exercises to determine the greatest quarterbacks and running backs of all time. These experiments were a lot of fun and generated a great deal of debate amongst the participants, so I thought it would be worthwhile to give crowd sourcing another shot. NFL quarterbacks are the most discussed and analyzed athletes in America, but we can’t properly debate the merits of the league’s famous signal callers without considering the effects of their supporting casts. As of today, there is no mathematically accurate way to measure the strength of a QB’s teammates and coaches, but there are plenty of people around who possess the football knowledge to make educated guesses. Basically, this is the perfect candidate for crowd sourcing. I want to keep things simple to maximize reader participation, so there are just a handful of guidelines I expect participants to follow:

1) Please rate a QB’s supporting cast based on how they affected his statistical performance, not his win/loss record or ring count. The supporting cast umbrella includes the direct effect of skill position teammates, offense lines, coaches, and system, but also the indirect effect of defense, special teams, ownership, and team culture. You’re free to weigh these components however you see fit. The rating for each supporting cast will account for the quarterback’s entire career, using a 0-100 scale. As a rule of thumb, a 100 rating equates to an all star team, 75 is strong but not dominant, 50 is average, 25 is weak but not terrible, and 0 is equivalent to the 1976 Buccaneers.

2) Ratings should be roughly weighted by playing time. The years in which a QB is the full time starter should count more heavily than seasons where he’s a backup or spot starter. And this almost goes without saying, but supporting casts are best evaluated in the context of their respective eras.

3) You may rate as many supporting casts as you wish. Since I will be compiling the results by hand, it doesn’t matter how you order your list, as long as it’s easy to read. I ask that you refrain from rating the supporting casts of quarterbacks you’re not reasonably familiar with; if you don’t know anything about a QB’s career, don’t guess! Any quarterback with at least 1,500 pass attempts is eligible to be rated, and I’ve provided a list of these quarterbacks here. Feel free to break up your ratings into multiple posts on different days, but just be sure to post with the same username each time so I can properly count the results. I plan on keeping the poll open for one week, but reserve the right to extend the duration if interest from new participants remains high enough.

Have fun!

{ 25 comments }

38 Questions In Review: Part II

Before the season began, I hosted a contest where I asked you to submit 38 questions. Each question asked you about 38 pairs of numbers, with the contestant trying to guess which number will be bigger. I also calculated the percentage that each “side” of the bet received, based on 82 entries.

In early January, I looked at the first 19 questions (that post has been updated since the playoff results).  Today, we’ll look at the remaining set of questions. Tomorrow, the contest results.

20t: Number of COMBINED receiving TDs by Pierre Garcon; Eddie Royal; Jarvis Landry; and Percy Harvin (0.671) vs. Number of receiving TDs by the player with the MOST in this group: Dez Bryant; Odell Beckham; Julio Jones; and A.J. Green (0.329) [continue reading…]

{ 1 comment }

From 1978 to 1980, Earl Campbell averaged 22.7 carries per game. Those carries went for 4.9 yards, giving him an incredible 110.5 rushing yards per game. That makes him jut the 5th (and at the time, 3rd) player to average 110 rushing yards per game over any 3-year period. On the other hand, Campbell averaged just 13 receptions for 63 receiving yards during those three seasons: that’s less than a catch per game.

The Houston offense during this time? Well, that’s a different matter. The Oilers were pretty middle-of-the-road in most categories, including points and Net Yards per Attempt. Take a look: [continue reading…]

{ 48 comments }

38 Questions In Review: Part I

Before the season began, I hosted a contest where I asked you to submit 38 questions. Each question asked you about 38 pairs of numbers, with the contestant trying to guess which number will be bigger. I also calculated the percentage that each “side” of the bet received, based on 82 entries.  Let’s look at how you guys did, in descending order based on votes, beginning with the question where everyone was the most confident. Spoiler: that question didn’t go so well for the wisdom of crowds.

1: Number of wins by the team with the second-most wins (0.878) vs. Number of wins by Washington and Oakland combined (0.122)

Washington surprisingly won 9 games, while Oakland finished 7-9.  That means the teams combined for 16 wins, which would have been good enough to beat any one team.  In retrospect, this one looks pretty obvious — the second-most wins was 13, by Arizona — but a whopping 87.8% of you picked “the field minus one” over Washington/Oakland.  You like that?

2t: Number of wins by the Ravens (0.841) vs. Number of wins by the Lions (0.159)

OK, you guys are not off to a hot start. Most of my questions were intended to draw something close to 50/50 action; I knew this question was not going to do that, but I threw it in anyway as an homage to Doug Drinen, who used it as the prototype example in the first edition of this contest at PFR.

Well, Detroit finished 7-9 ,while Baltimore went 5-11. Score another one for the underdogs.
[continue reading…]

{ 4 comments }

38 Questions Summary

On September 7th, I announced the 38 Questions Contest. There were 82 entries, so that gives us some data to analyze. Let’s look at what turned out to be the most lopsided questions:

1) Number of wins by the team with the second-most wins (72) vs. Number of wins by Washington and Oakland combined (10)

I am not surprised that more people voted for the first option there, but the magnitude caught me off guard. Last year, the team with the second-most wins had 12 wins, although it had been 13 in each of the previous five years. If you had to guess, 13 is probably the most likely answer here, and I don’t think it’s unreasonable to say that Washington and Oakland aren’t likely to combine for 13 (or more) wins.  This one looked like a slam dunk after week one, but is on shakier ground after week two. [continue reading…]

{ 1 comment }

On the Grantland NFL Podcast, Bill Barnwell brought up an interesting idea.

The Eagles wound up signing DeMarco Murray to a five-year, $40 million dollar deal. Philadelphia gave Murray a $5M signing bonus, which makes the math pretty simple. A signing bonus is paid at signing, just like the name implies. However, the salary cap hit is spread evenly over the life of the contract: Philadelphia’s cap space has to include $1M in 2015, 2016, 2017, 2018, and 2019 as a result of giving Murray five million dollars at signing.

Now, if the Eagles traded Murray tomorrow, that cap hit would be accelerated. And, in fact, the team would have to take a $5M cap hit this year. This would be something of a win for the team that trades for Murray, though, as they would essentially be inheriting a five-year, $35M contract, in terms of both cash and salary cap dollars.

As Barnwell points out, here’s where a potential trade could happen. The Jaguars are flush with salary cap dollars: arguably too many, in fact. Let’s say that once Murray and the Eagles came to an agreement in principle, the parties instead decided that Jacksonville should be the team to sign Murray. And that signing bonus should be bumped up, too, to say, ten million dollars.

So Jacksonville signs Murray to a 5-year, $40M deal, with a $10M signing bonus. Then, the Jaguars turn around and trade Murray to the Eagles for X. What ends up happening is Jacksonville takes a $10M cap hit in 2015 and is out ten million dollars of real cash. The Eagles get Murray on a 5-year deal but now only have to pay him thirty million, in terms of both cash and salary cap dollars. And Philadelphia, depending otherwise on the structure of the contract, could then cut Murray without penalty at any time.

It’s a real win-win-win situation, but the key question is: What is X? If X was a 7th round draft pick, you could be sure that Philadelphia would jump at the chance to do this. If X was a first round pick, then I’m not so sure. It comes down to the question of how much is a draft pick worth in terms of both salary cap and real dollars?

That’s a really complicated question. I have some ideas, but I’d love to hear your thoughts on how to go about answering this question. And in some ways, your gut may be just as helpful as anything else. If you were the Jaguars, what’s the lowest pick you would take? If you were the Eagles, what’s the highest pick you would give?

{ 13 comments }

According to Football Outsiders, over the last three years, 60% of all passes have gone to wide receivers, 21% to tight ends, and 19% to running backs. There are some players who are position hybrids, of course, but as a general rule, wide receiers catch about 56.3% of passes, tight ends have a 63.1% catch rate, and running backs record a reception on 72.4% of their targets. In theory, those numbers should help us figure out which teams (and passers) have completion percentages that are artificially high (or low) because of a high number of passes to running backs (or receivers).

Let’s use the 2013 Chiefs as an example. Last year, 57% of Kansas City passes went to wide receivers, 28% to running backs, and 15% to tight ends. If we use the league-average numbers on passes to players at each position, we would “expect” Kansas City to complete about 61.9% of their passes if the Chiefs were an average passing team. That’s a number that’s slightly higher than league-average rates because the Chiefs threw very often to running backs and not so often to wide receivers. [continue reading…]

{ 12 comments }

Insane Ideas: Rules Changes

Should the depth of the NFL end zone be extended from 10 to 20 yards? Practically, this is probably impossible, as adding 20 yards to certain fields would be an issue in many NFL stadiums. But let’s ignore that issue for today. I recently had lunch with a baseball friend of mine who suggested this change. My initial reaction was that this would be a bit odd, but there are several reasons to like his idea:

1) My baseball friend — let’s just call him Sean — doesn’t like how compressed things are at the goal line. Why are teams in effect penalized for getting down to the 1 yard line? Why make things easier on the defense?

If you think about it, there’s no reason for the end zone to be ten yards deep. If you are someone who believes we need more rules to promote defense, would you be in favor of making the end zone five yards deep? If not, why not? What makes ten the right number?

We have been conditioned by announcers to believe that life is tougher near the goal line for NFL offenses, and that this is a good thing. Does that make sense?

2) The goal posts would remain at the back of the end zone, which has three benefits. One, the extra point would now be slightly more difficult, which would quiet that controversy. Two, teams might be a little more likely to go for it on 4th and goal, as a 30-yard field goal isn’t as much of a gimme as a 20-yarder. But most importantly, when it’s fourth-and-three from the 30 yard line, teams would now go for it. Perhaps idiot-proofing coaching isn’t a desirable reason for change, but I am in favor of most rules that result in less kicking.

3) This would allow for 119-yard returns, a trade-off that I’m willing to make even if it lowers the possibility of an Orlovsky happening.

So what do you guys think? Feel free to leave your thoughts in the comments, or go in a different direction and post your own insane idea rules change. Here’s one of mine: in the final two minutes of the fourth quarter, the clock stops on a play that does not gain yards.

The purpose of this hypothetical rule change would be to stop teams from taking a knee to end the game. I don’t expect this to be a very popular idea, although the Pro Bowl actually implemented this rule this year. But watching teams battle for 58 minutes and then have the game essentially end with 2 minutes left always rubbed me the wrong way. I know, I know, the winning team earned the right to do it. That doesn’t mean I have to like it. I’d rather see a team have to at least gain a yard to end the game. I’m pretty sure all 32 coaches would hate this rule, but it would certainly make the end of certain games more exciting. That’s a pretty risky statement, I know, because it’s hard to top the victory formation for excitement.

{ 44 comments }

Love the Bowl Championship Series or (more likely) hate it, tonight marks the end of college football’s 16-year BCS experiment. Designed to bring some measure of order to the chaotic state college football had been in under the Bowl Alliance/Coalition, the BCS did streamline the process of determining a national champion — though it was obviously not without its share of controversies either.

If various opinion polls conducted over the years are any indication, the public is ready to move on from the BCS to next season’s “plus-one”-style playoff system. But before it bids farewell forever, how does the BCS grade out relative to other playoff systems in terms of selecting the best team as a champion?

Back in 2008, I concluded that it didn’t really do much worse of a job than a plus-one system would have. But that was more of an unscientific survey of the 1992-2007 seasons than a truly rigorous study. Today, I plan to take a page from Doug’s book and use the power of Monte Carlo simulation to determine which playoff system sees the true best team win the national title most often.

(Note: If you just want the results and don’t want to get bogged down in the details, feel free to skip the next section.) [continue reading…]

{ 21 comments }

One of my favorite sabermetric baseball articles of all time was written by Sky Andrecheck in 2010 — part as a meditation on the purpose/meaning of playoffs, and part as a solution for some of the thorny logical concerns that arise from said mediation.

The basic conundrum for Andrecheck revolved around the very existence of a postseason tournament, since — logically speaking — such a thing should really only be invoked to resolve confusion over who the best team was during the regular season. To use a baseball example, if the Yankees win 114 games and no other AL team wins more than 92, we can say with near 100% certainty that the Yankees were the AL’s best team. There were 162 games’ worth of evidence; why make them then play the Rangers and Indians on top of that in order to confirm them as the AL’s representative in the World Series?

Andrecheck’s solution to this issue was to set each team’s pre-series odds equal to the difference in implied true talent between the teams from their regular-season records. If the Yankees have, say, a 98.6% probability of being better than the Indians from their respective regular-season records, then the ALCS should be structured such that New York has a 98.6% probability of winning the series — or at least close to it (spot the Yankees a 3-0 series lead and every home game from that point onward, and they have a 98.2% probability of winning, which is close enough). [continue reading…]

{ 8 comments }

The Simple Rating System is a many-splendored thing, but a known bug of the process is that huge outlier scoring margins can have undue influence on the rankings. Take the 2009 NFL season, for instance, during which the Patriots led the NFL in SRS in no small part because they annihilated the Titans 59-0 in a snowy October game that tied for the second-most lopsided margin of victory in NFL history. Outside of that single game, the Patriots’ PPG margin was +5.2, which wouldn’t have even ranked among the league’s top ten teams, but the SRS (particularly because it minimizes squared prediction errors between actual outcomes and those expected from team ratings) gave the 59-0 win a lot of weight, enough to propel New England to the #1 ranking. (A placement that looked downright laughable, I might add, when the Pats were crushed at home by Baltimore on Wild Card Weekend.)

One solution that is commonly proposed for this problem is to cap the margin of victory in a given game at a certain fixed number. This is especially popular in college football (in fact, Chase sort of uses a cap in his college SRS variant) because nonconference schedules will often see matchups between teams of incredibly disparate talent levels, games in which the powerhouse team can essentially choose the margin by which they want to steamroll their opponent. Within that context, it doesn’t really matter whether Florida State beats Idaho by 46 or by 66, because there’s a 0% chance Idaho is a better team than FSU — no new information is conveyed when they pile more and more points onto the game’s margin.

But what’s the right number to cap margin of victory at in the NFL? These are all professional teams, after all, so there’s plenty of evidence that in the NFL, blowing opponents out — even when they’re bad teams — says a lot about how good you are. Where do we draw the line, then, to find the point at which a team has clearly proven they’re better than the opponent, beyond which any extra MOV stops giving us information?

[continue reading…]

{ 11 comments }

“Worldly wisdom teaches that it is better for the reputation to fail conventionally than to succeed unconventionally.” – John M. Keynes.

Photo via phillymag.com.

Last Thursday night, Chip Kelly was widely criticized for an unconventional decision that turned out to be unsuccessful. Trailing 10-0 in the first quarter against the Chiefs, Michael Vick threw a 22-yard touchdown pass to Jason Avant. The photo above shows how the Eagles lined up for the point after. Philadelphia’s two-point conversion attempt — a play known as the the Swinging Gate — was stopped, and it was stopped in particularly ugly fashion. That made it easy to point a finger and laugh at the college coach doing something silly.

But without the benefit of hindsight, there was nothing silly or even suboptimal about the decision. Putting aside the specifics of the play — we’ll get to that at the end — the main criticism seems to be that it was “too early” to go for two, or that the Eagles were “chasing points”, or that it was simply “unnecessary.” All of those are buzz words for saying that the Eagles should have behaved conventionally.

At a baseline level, let’s recognize that a team has a roughly 50/50 chance of converting on a two-point conversion. For a good offense with a mobile quarterback, that number may be even higher, but let’s just use the 50/50 number now. If that’s the case, then teams early in the game should be indifferent between kicking the extra point and going for two. Consider this hypothetical example: if a team had the option of kicking the extra point or flipping a coin — and heads gave them two points, tail giving them zero — would choosing to flip the coin be a poor decision?

Late in games, perhaps. But early in the game? I don’t see any reason to think that the difference between having six versus seven points on the board in the first quarter is more significant than the difference between having seven or eight points. Suppose you were told that your favorite team would score first quarter touchdowns in back-to-back games. Option 1 provides that your team would the extra point both times, while Option 2 is that your team would make the two point conversion once and fail on the attempt once. So you get eight points in one game and six points in the other.

Which would you prefer, Option 1 or Option 2? And why? And, if you prefer Option 1 to Option 2, how much more preferable is it? What would you be willing to trade to land in Option 1 — how many yards on the ensuring kickoff?

I would be indifferent between Options 1 and 2, but even if you preferred one, I don’t see how anyone could strongly prefer Option 1 to Option 2. The value to having 8 points is real, which is why it is never “too early” or “unnecessary” to go for two in a world where teams convert on two-point attempts half the time. Those are red herrings, because going for two is only a high-variance strategy; is it not a high-variance, lower-expected value option. Once you understand that, then nearly all the criticism about Kelly’s decision disappears.

As for the actual play call? I think it was a good one. Keep in mind that the Eagles did not pigeon hole themselves into going for two — based on how the Chiefs reacted to that formation prior to the snap, Philadelphia could have switched back to a normal extra point formation or simply taken a delay of game penalty with minimal harm. But Kansas City did not react well to the play pre-snap: The Eagles split two players out wide to the right, and Kansas City countered with two defenders to that side. But in the middle of the field, Philadelphia had the snapper, holder, and kicker, while the Chiefs kept four players in the middle of the field. I’m quite certain the special teams coach was not pleased with how the Chiefs responded to the situation, because that left K.C. with only five defenders to the defense’s right, while the Eagles were able to match up five blockers to that side and Zach Ertz, the eventual ballcarrier.

That’s a matchup Philadelphia should win more often than fifty percent of the time, and perhaps significantly more often than that. As it turns out, Lane Johnson blew the block, Tamba Hali made a nice play, and Kelly and the Eagles had egg on their face. Failing unconventionally has its drawbacks.

{ 4 comments }

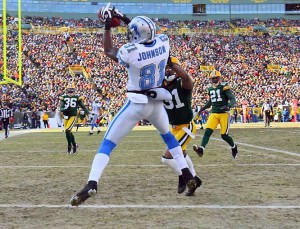
Calvin Johnson doesn't like adjustments for pass attempts

Calvin Johnson doesn't like adjustments for pass attempts.

On Thursday, Neil and I introduced you to the concept of True Receiving Yards. True Receiving Yards is designed to place every receiver into the same environment. TRY starts with receiving yards, but gives a bonus for receptions and touchdowns, adjusts for how frequently a player’s team passes, adjusts for the league passing environment, and adjusts for the number of games scheduled for the team that season.

The bolded adjustment caused some consternation for some of the commenters. Some folks feel that if Team X passes twice as often as Team Y, we shouldn’t just expect the top WR on Team X to gain as many receiving yards as the top WR on Team Y. There’s some merit to that argument: in general, high-pass teams probably have more receivers on the field on a given play, and low-pass teams are often in more favorable situations. Being the only wide receiver on the field on a play-action pass is probably an easier situation to gain yards than being one of four wide receivers in an obvious passing situation.

In other words, some feel that we shouldn’t expect a one-to-one increase in receiving yards (or Adjusted Catch Yards) relative to team pass attempts. Is there a way to test that? Neil and I came up with three such methods.

Year-to-Year Case Study

Neil looked at all wide receivers since 1970, ages 23-30, who started every game for the same team in back-to-back seasons (Years Y and Y+1). The sample was 245 pairs of player-seasons, after removing 2 extreme outliers: Drew Hill 1985 (went from 335 True Receiving Yards without the team attempt adjustment in 1984 to 1048 in 1985) and Roger Carr 1976 (went from 591 to 1438).
[continue reading…]

{ 10 comments }

On September 13, 2008, Doug Drinen wrote this post, which I reproduce in full below.

I’m hearing and reading a lot of crazy stuff this week.

So I just want to document my predictions that (a) the Patriots will win at least 11 games this year, (b) the Patriots will clinch the East before week 17, and (c) Matt Cassel will be a top-12 fantasy quarterback from here out.

That is all.

You think I'm going to lose my top 5 receivers next year? Hahaha. Ok

You think I'm going to lose my top 5 receivers next year? Hahaha. Ok.

With the combination arrest/release of Aaron Hernandez stacked upon five surgeries in seven months for Rob Gronkowski and the departure of Wes Welker to Denver, it’s fair to say that many are wondering about the fate of the New England passing game. In addition to those three, Tom Brady is without Brandon Lloyd (free agent) and Danny Woodhead (San Diego), the fourth and fifth leading receivers on the 2012 Patriots. As Jason Lisk pointed out, that puts Brady in historically bad territory when it comes to roster turnover.

So today’s post doubles as a temperature check and a contest entry. Please predict the following for Tom Brady in 2013, based on the assumption that he is responsible for 99.4% of all Patriots pass attempts by quarterbacks for the second year in a row. To the extent he is not, I will pro-rate his numbers for purposes of judging the contest. To enter, simply copy and paste this table below in the comments and fill out each line.

Your name:
Brady’s number of pass attempts:
Brady’s number of passing yards:
Brady’s number of passing touchdowns:
Brady’s number of interceptions:
Brady’s number of sacks:
Brady’s number of sack yards lost:
Commentary:
[continue reading…]

{ 28 comments }

The Saints would dig Football Perspective

The Saints would dig Football Perspective.

Last week, Chase had a great post where he looked at what percentage of the points scored by a team in any given game is a function of the team, and what percentage is a function of the opponent. The answer, according to Chase’s method, was 58 percent for the offense and 42 percent for the defense (note that, in the context of posts like these, “offense” means “scoring ability, including defensive & special-teams scores”, and “defense” means “the ability to prevent the opponent from scoring”). Today I’m going to use a handy R extension to look at Chase’s question from a slightly different perspective, and see if it corroborates what he found.

My premise begins with every regular-season game played in the NFL since 1978. Why 1978? I’d love to tell you it was because that was the year the modern game truly emerged thanks to the liberalization of passing rules (which, incidentally, is true), but really it was because that was the most convenient dataset I had on hand with which to run this kind of study. Anyway, I took all of those games, and specifically focused on the number of points scored by each team in each game. I also came armed with offensive and defensive team SRS ratings for every season, which give me a good sense of the quality of both the team’s offense and their opponent’s defense in any given matchup.

If you know anything about me, you probably guessed that I want to run a regression here. My dependent variable is going to be the number of points scored by a team in a game, but I can’t just use raw SRS ratings as the independent variables. I need to add them to the league’s average number of points per game during the season in question to account for changing league PPG conditions, lest I falsely attribute some of the variation in scoring to the wrong side of the ball simply due to a change in scoring environment. This means for a given game, I now have the actual number points scored by a team, the number of points they’d be expected to score against an average team according to SRS, and the number of points their opponents would be expected to allow vs. an average team according to SRS.
[continue reading…]

{ 2 comments }

Yesterday, I asked how many wins a team full of recent draft picks and replacement-level NFL players would fare. I don’t think there’s a right answer to the question, but it might be a more important question than you think (and you’ll see why on Monday). But I have at least one way we can try to estimate how many games such a team would win.

Neil once explained how you can project a team’s probability of winning a game based on the Vegas pre-game spread. We can use the SRS to estimate a point spread, and if we know the SRS of our Replacement Team, we can then figure out how many projected wins such a team would have. How do we do that?

First, we need to come up with a mythical schedule. I calculated the average SRS rating (after adjusting for home field) of the best, second best, third best… and sixteenth best opponents for each team in the NFL from 2004 to 2011. The table below shows the “average” schedule for an average team:

[continue reading…]

{ 11 comments }

It’s been awhile, but time for another post in the Thought Experiments category. Assume the following:

  • On May 1st, 2013, an average owner, average general manager and average coach are assigned an expansion team. They are randomly assigned 24 players: one from each of the seven rounds of the 2011, 2012, and 2013 drafts. So this expansion team has a 1-in-32 shot at getting Cam Newton from the 2011 first round and a 1-in-32 chance of getting Green Bay offensive lineman Derek Sherrod.  There’s a 1-in-32 chance the sixth round pick from the 2012 draft lands on the Alfred Morris pocket, but more likely than not Lady Luck will give them a generic sixth rounder. As for the final three players, the team is randomly assigned from each draft class one of the X number of undrafted players that ended up making an opening day roster that year. So while it is technically possible this team could get someone like Vontaze Burfict, it’s much more likely to be a Junior Hemingway, David Douglas or Martell Webb. Finally, assume in this magical world that while random, the 24 picks work out in this team’s favor as far as spreading the roster: they don’t end up with 6 quarterbacks and zero defensive lineman, and instead things are magically balanced.
  • On May 2nd, this team is able to poach anyone on any roster provided that such player is making the veterans minimum. The team can also sign players currently not on any roster, but it must be of the veterans minimum variety. The team can sign anywhere from 29 to 50 of these minimum players, with the spread based on how many of the 24 players from above the team decides to roster (and they can roster more in training camp, but must be at 53 by the start of the season).

Suppose we simulate this process and play out the 2013 season 10,000 different times. On average, how many games does this mean win per season?

One thing that you might want to keep in mind. While some teams have gone 1-15 and the 2008 Detroit Lions went 0-16, those records do not represent the true winning percentages of those teams. If we simulated the 2008 Detroit Lions season 10,000 times, they wouldn’t go 0-160,000. When Neil talked about the Tangotiger Regression Model, he added 11 games of .500 football to get an estimate of a team’s true ability level. That would put the ’08 Lions at a .204 winning percentage, or 3.26 wins in a 16-game season. The Lions also has a Pythagorean record of 2.8-13.2, so perhaps we can say they were a 3-win team that was really unlucky. On the other hand, Brian Burke had those Lions at 1.8 wins and Football Outsiders had them at 2.1 wins.

Of course, there are many differences between the 2008 Lions and our mythical expansion team. Just food for thought.

{ 17 comments }

Yet another thought experiment

I’ve decided to add a new category to Football Perspective, as this thought experiment idea is here to stay. Here’s today’s thought experiment:

It’s 4th and 1, at the 50-yard line, with 1:30 to go. You’re the defensive coordinator and your team is trailing by 1 and out of timeouts. The other team looks like they’re going to go for it — they had 3 WRs, 1 TE and 1 RB in the huddle, and now all 5 players are split out wide (with 3 on the wide side of the field). The quarterback is under center, not in shotgun.

What type of players do you want on the field (i.e., number of defensive tackles, ends, inside/outside linebackers, corners/safeties)?

Assume as DC you can control the minds of each of your defensive plays. How do you align them pre-snap? What do you coach your players to do?

{ 4 comments }

Another thought experiment

In this post, I noted that the Steelers could have punted to the Raiders, leaving Oakland with the ball likely at their own 33-yard line in a tie game with just under 4 minutes remaining.

You are the head coach of a team with a league average offense and league average defense. You are given the ball on 1st and 10 at your own 33-yard line. The game is tied and both you and your opponent have all of your timeouts left.

You are given the option of picking how much time is left in the game. What is the optimal decision?

{ 7 comments }

A thought experiment

Yeah, yeah, Football Perspective turned 100 today, blah blah blah. I have something on my mind and I need the wisdom of this crowd. Below is a thought experiment.

You are highly incentivized to correctly guess how many interceptions a quarterback threw in a specific game. If you can answer it correctly within the one-tenth of an interception, you win. (You can assume this is the average of 100 games, if you like, but the point being your answers should not be limited to whole numbers.)

I will inform you that the quarterback in question threw exactly 13 incomplete passes (or each of the 100 quarterbacks threw exactly 13 incomplete passes).

Now, before you guess as to the number of interceptions thrown by this quarterback, I could also let you know how many pass attempts the quarterback had. But I don’t have to. Do you want to know how many attempts he threw, or is that information irrelevant?

If it *is* relevant information that you want to know, how does that knowledge affect your answer? If you knew he threw 45 passes, will you now project him to have more interceptions or fewer interceptions? Please vote in the poll below, but I’m just as interested in your comments. So get to commenting!

[poll id=”6″]

{ 12 comments }