In general, more passing yards should be better than fewer passing yards. But we know that due to Game Script, teams that are trailing late in games throw much more frequently — and can rack up the passing yards — than teams with a lead.
So, if you know nothing else other than that a team threw for more passing yards than its opponent, would you guess that team won or lost?
And how would you guess that answer would change over time?
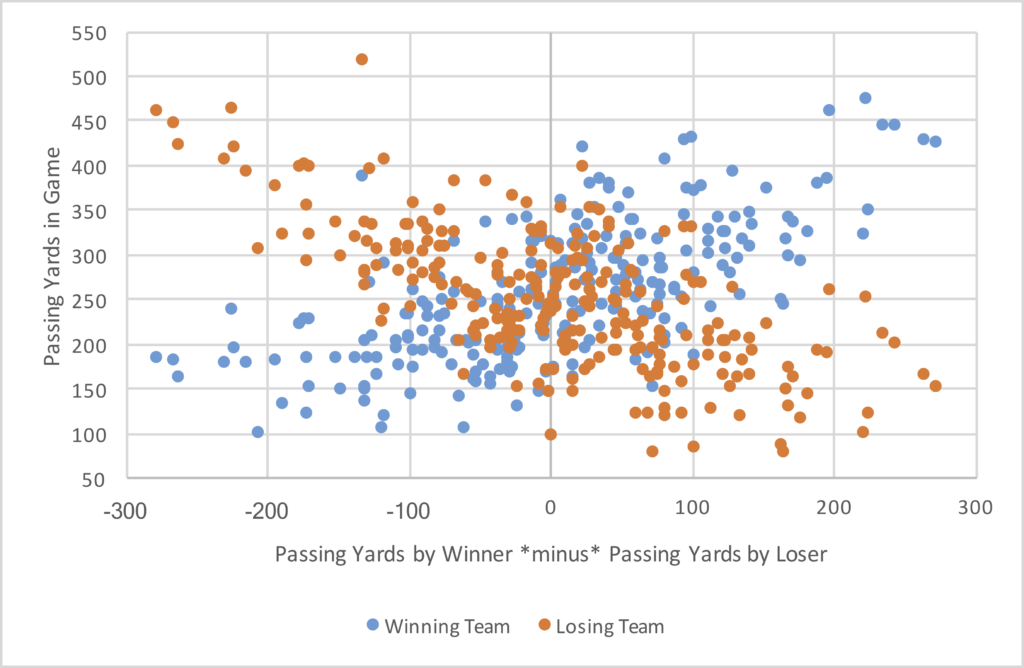
For the first question, let’s look at 2019. Last season, the team that threw for more gross passing yards went 136-119-1, so that’s a small but clear edge for the team that threw for more passing yards. In the graph below, I’ve shown the number of passing yards by each winning team (in blue) and its opponent (in orange) in each game. The X-Axis shows the difference between the passing yards for the winning team and the passing yards for the losing team. There are a few more dots to the right side of the graph than the left, which is because the winning team more often than not threw for more yards. This is a fun graph, because it also lets you see how many games are in each category based on the size of the difference.
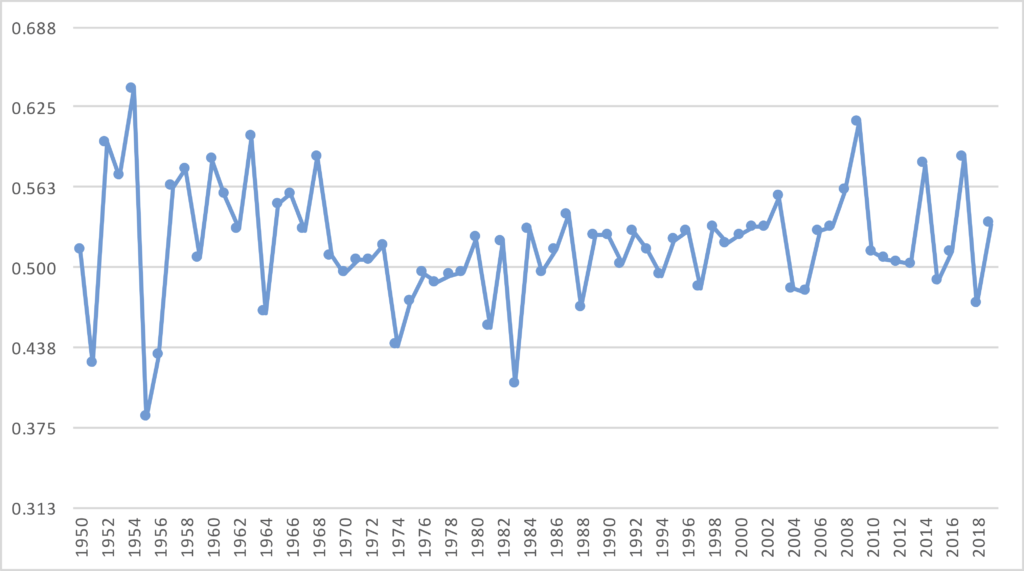
 And what about the question of how this has changed over time? Well, that is a bit of a trick question. Because historically, the winning team has been slightly more likely to throw for more yards than the losing team. This holds generally true for all eras of football since 1950, with the decade from ’74 to ’83 (which is not quite a decade in any consistent sense, as football changed significantly during this period) being the most likely time for the team with fewer passing yards to win.
The graph below looks at every regular season game played since 1950. It shows, for each season, the winning percentage of the team that threw for more passing yards in those games. As you can see, other than yearly variation due to sample size, the winning team has won between 50-55% of all games throughout history.

What stands out to you?
