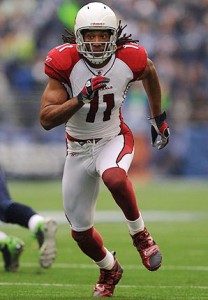
In the preseason, I wrote a post showing what percentage of each receiver’s receiving yards came from each of their quarterbacks. Using that same methodology, here’s an updated look at the quarterbacks responsible for Larry Fitzgerald’s career numbers entering week 14. The second receiving yards column (and second games column) shows the percentage of Fitzgerald’s receiving yards came (and games) that came from that quarterback: [1]Note: To determine quarterback games, I gave each quarterback credit for his number of pass attempts in each game divided by the team’s total number of attempts in the game.
QB | Rec Yds | Rec Yd | G | G | Yd/G |
---|---|---|---|---|---|
Kurt Warner | 4572 | 44% | 53.5 | 39% | 85.5 |
John Skelton | 1258 | 12% | 15.6 | 11% | 80.6 |
Josh McCown | 1215 | 12% | 19.7 | 15% | 61.6 |
Kevin Kolb | 1008 | 10% | 12.9 | 9% | 78.4 |
Matt Leinart | 998 | 10% | 14.1 | 10% | 70.6 |
Derek Anderson | 609 | 6% | 9.5 | 7% | 64.2 |
Max Hall | 152 | 1% | 2.1 | 2% | 71.7 |
Shaun King | 112 | 1% | 1.8 | 1% | 61.4 |
Richard Bartel | 99 | 1% | 1.1 | 1% | 90.3 |
Tim Rattay | 87 | 1% | 0.9 | 1% | 97.1 |
Ryan Lindley | 62 | 1% | 2.7 | 2% | 22.7 |
John Navarre | 61 | 1% | 1.6 | 1% | 38.7 |
In 13 games this season, Fitzgerald has just 652 yards, an average of 50.1 yards per game. Entering week 14, Fitzgerald ranked 40th in receiving yards, and we can safely assume he is no longer ranked in the top forty.
How rare is it for an elite receiver to have such a miserable season at the age of 29? First we need to define what ‘elite’ means without asking ESPN. I came up with a quick and dirty system where I gave a receiver credit for his receiving yards over the Nth ranked receiver, where N represents the number of teams in the league in that season. For example, in 2011 Calvin Johnson receives credit for 794 yards, since he gained 1,681 yards and the 32nd receiver gained 887 yards. If you gained fewer yards than the Nth best receiver, you get zero yards for that season. The table below shows the career leaders using this formula (excluding 2012), and the column on the right pro-rates the data for non-16-game seasons.
Now that we have our set of top receivers, let’s look for comparables to Fitzgerald. To avoid looking at players who had poor seasons for age or injury reasons, for these 50 players, I limited the data to just their seasons between the ages of 27 and 31 and excluded all seasons where the receiver played in fewer than ten games. The table below lists, for each wide receiver, his worst season between the ages of 27 and 31, his rank in that Worst Year, his receiving yards, age, team, and quarterback during that season, and his production the next year.
Rk | Player | Prorated | Year | WorstYr | Yards | Age | Tm | QB | N+1 Rk | N+1 Yd |
---|---|---|---|---|---|---|---|---|---|---|
19 | Larry Fitzgerald | 2885 | 2012 | 29 | ARI | John Skelton | ||||
43 | Bob Hayes | 2069 | 1972 | 112 | 200 | 30 | DAL | Craig Morton | 56 | 360 |
47 | Drew Hill | 1985 | 1984 | 95 | 390 | 28 | RAM | Jeff Kemp | 5 | 1169 |
37 | John Gilliam | 2182 | 1976 | 90 | 292 | 31 | ATL | Scott Hunter | 160 | 133 |
26 | Herman Moore | 2557 | 2000 | 89 | 434 | 31 | DET | Charlie Batch | 265 | 76 |
46 | Mark Clayton | 2006 | 1990 | 86 | 406 | 29 | MIA | Dan Marino | 10 | 1053 |
23 | Steve Smith | 2705 | 2010 | 81 | 554 | 31 | CAR | Jimmy Clausen | 5 | 1394 |
3 | Randy Moss | 4567 | 2006 | 73 | 553 | 29 | OAK | Andrew Walter | 2 | 1493 |
15 | Chad Johnson | 3164 | 2008 | 72 | 540 | 30 | CIN | Ryan Fitzpatrick | 20 | 1047 |
50 | Andre Rison | 1915 | 1998 | 67 | 542 | 31 | KAN | Rich Gannon | 162 | 218 |
44 | Joe Horn | 2047 | 1999 | 65 | 586 | 27 | KAN | Elvis Grbac | 8 | 1340 |
34 | Charlie Joiner | 2209 | 1974 | 59 | 390 | 27 | CIN | Ken Anderson | 17 | 726 |
49 | Donald Driver | 1920 | 2003 | 51 | 621 | 28 | GNB | Brett Favre | 10 | 1208 |
32 | Wes Chandler | 2354 | 1984 | 42 | 708 | 28 | SDG | Dan Fouts | 4 | 1199 |
6 | Lance Alworth | 3976 | 1971 | 38 | 487 | 31 | DAL | Roger Staubach | 115 | 195 |
22 | Cris Carter | 2770 | 1992 | 37 | 681 | 27 | MIN | Rich Gannon | 7 | 1071 |
29 | Del Shofner | 2426 | 1965 | 36 | 388 | 31 | NYG | Earl Morrall | 138 | 19 |
30 | Charley Hennigan | 2403 | 1966 | 33 | 313 | 31 | HOU | George Blanda | ||
48 | Cliff Branch | 1941 | 1977 | 31 | 540 | 29 | OAK | Ken Stabler | 26 | 709 |
35 | Billy Howton | 2207 | 1960 | 31 | 363 | 30 | DAL | Eddie LeBaron | 16 | 785 |
31 | Harold Jackson | 2378 | 1974 | 30 | 514 | 28 | RAM | James Harris | 7 | 786 |
16 | Henry Ellard | 3076 | 1992 | 30 | 727 | 31 | RAM | Jim Everett | 13 | 945 |
27 | Gary Clark | 2551 | 1993 | 26 | 818 | 31 | PHO | Steve Beuerlein | 35 | 771 |
9 | James Lofton | 3647 | 1986 | 25 | 840 | 30 | GNB | Randy Wright | 10 | 880 |
21 | Rod Smith | 2773 | 1999 | 24 | 1020 | 29 | DEN | Brian Griese | 2 | 1602 |
8 | Michael Irvin | 3690 | 1996 | 23 | 962 | 30 | DAL | Troy Aikman | 9 | 1180 |
38 | Andre Reed | 2142 | 1993 | 23 | 854 | 29 | BUF | Jim Kelly | 5 | 1303 |
42 | Derrick Mason | 2070 | 2002 | 21 | 1012 | 28 | TEN | Steve McNair | 5 | 1303 |
36 | Lionel Taylor | 2192 | 1966 | 20 | 448 | 31 | DEN | John McCormick | 36 | 233 |
33 | Raymond Berry | 2262 | 1962 | 19 | 687 | 29 | BAL | Johnny Unitas | 20 | 703 |
41 | Art Monk | 2085 | 1988 | 18 | 946 | 31 | WAS | Doug Williams | 10 | 1186 |
12 | Isaac Bruce | 3532 | 2001 | 17 | 1106 | 29 | STL | Kurt Warner | 17 | 1075 |
17 | Reggie Wayne | 3020 | 2005 | 17 | 1055 | 27 | IND | Peyton Manning | 3 | 1310 |
28 | Mac Speedie | 2519 | 1950 | 14 | 548 | 30 | CLE | Otto Graham | 6 | 589 |
25 | Sterling Sharpe | 2559 | 1994 | 14 | 1119 | 29 | GNB | Brett Favre | ||
7 | Terrell Owens | 3803 | 2003 | 13 | 1102 | 30 | SFO | Jeff Garcia | 11 | 1200 |
39 | Roddy White | 2135 | 2009 | 13 | 1153 | 28 | ATL | Matt Ryan | 2 | 1389 |
14 | Tim Brown | 3358 | 1996 | 13 | 1104 | 30 | OAK | Jeff Hostetler | 2 | 1408 |
45 | Elroy Hirsch | 2031 | 1952 | 12 | 590 | 29 | RAM | Norm Van Brocklin | 2 | 941 |
13 | Jimmy Smith | 3425 | 2000 | 12 | 1213 | 31 | JAX | Mark Brunell | 4 | 1373 |
10 | Steve Largent | 3640 | 1983 | 12 | 1074 | 29 | SEA | Dave Krieg | 8 | 1164 |
18 | Jim Benton | 2906 | 1947 | 12 | 511 | 31 | RAM | Bob Waterfield | ||
11 | Don Maynard | 3573 | 1963 | 10 | 780 | 28 | NYJ | Dick Wood | 10 | 847 |
5 | Torry Holt | 4320 | 2007 | 10 | 1189 | 31 | STL | Marc Bulger | 39 | 796 |
40 | Bobby Mitchell | 2134 | 1965 | 8 | 867 | 30 | WAS | Sonny Jurgensen | 7 | 905 |
24 | Andre Johnson | 2575 | 2010 | 6 | 1216 | 29 | HOU | Matt Schaub | 92 | 492 |
4 | Marvin Harrison | 4369 | 2000 | 6 | 1413 | 28 | IND | Peyton Manning | 2 | 1524 |
20 | Art Powell | 2786 | 1966 | 5 | 1026 | 29 | OAK | Tom Flores | 25 | 346 |
1 | Jerry Rice | 7789 | 1991 | 3 | 1206 | 29 | SFO | Steve Young | 3 | 1201 |
2 | Don Hutson | 7404 | 1940 | 2 | 664 | 27 | GNB | Cecil Isbell | 1 | 738 |
Leaving aside Drew Hill, who did not have his first big year until his age 29 season, there are three players who had miserable years during the prime of their careers and then rebounded with a top-ten season the next year.
- In 1988 and 1989, Mark Clayton gained 2,140 receiving yards, but in 1990, he had just 406 yards in 10 games. Part of that was due to a knee injury, but even on a per-game basis Clayton struggled. Dan Marino also had a down year, with the lowest Y/A average of his career (excluding his age 37 and 38 seasons). But in 1991, Marino and Clayton rebounded. Still, since a 51-year-old Marino is an upgrade over Ryan Lindley, this isn’t a very useful comparison.
- Steve Smith was one of the game’s best receivers a few years ago, but many thought he was washed up after a horrible 2010 season. Like the 2012 Cardinals, the 2010 Panthers ranked last in NY/A, and Jimmy Clausen and Matt Moore were terrible. Smith gained just 554 yards and 2 touchdowns in 14 games, but in 2011, with Cam Newton, Smith made the Pro Bowl and gained 1,394 yards.
- You’d be hard pressed to find two players with more different personalities than Larry Fitzgerald and Randy Moss; the Cardinals star has never had any ‘play when he wants to play’ drama tarnishing his good name. But the similarities between the two are striking. Both entered the NFL at the age of 21 and were superstars early in their careers. But at age 29, in Moss’ second season in Oakland, he bottomed out and caught 42 passes for 553 yards and 3 touchdowns in 13 games, nearly identical to Fitzgerald’s production so far during his age 29 season. Like the 2010 Panthers and 2012 Cardinals, the 2006 Raiders ranked 32nd in net yards per attempt. The following season Moss was traded to New England, and enjoyed a career revival with Tom Brady. In 2007, he gained 1,493 yards and caught 23 touchdowns.
Fitzgerald’s monster contact makes a trade just about impossible, although it is tantalizing to imagine what Fitzgerald could do in New England. Arizona is likely to finish with a top-five pick this season, so we’ll see if they can go the Cam Newton route and find a franchise quarterback for him in the draft. The other alternatives aren’t very enticing. But the bottom line is right now, Fitzgerald is an innocent bystander in the Cardinals quarterback train wreck.
References
↑1 | Note: To determine quarterback games, I gave each quarterback credit for his number of pass attempts in each game divided by the team’s total number of attempts in the game. |
---|