≡ Menu

NFL Dynasties and the NFL 100 Team, Part II

Brad Oremland is a sportswriter and football historian. You can follow him on Twitter @bradoremland.


Yesterday, I began looking at the greatest dynasties in pro football history were represented on the NFL 100 team. Today, we pick back up with the top 13 dynasties.

t9. Decatur Staleys/Chicago Bears, 1920-27
73-17-16 (.811), 1 championship, 0 title appearances
20 dynasty points
NFL 100 Members:
George Halas
Other HOFers: Ed Healey, George Trafton

Not a dynasty. They rate well by my system, but the system wasn’t designed for the 1920s. These were the first eight years of the NFL’s existence — actually in 1920 the league was called the APFA: American Professional Football Association. Teams not only played variable numbers of games, they regularly played against teams who weren’t even in the league. In 1921, the Louisville Brecks, Muncie Flyers, New York Brickley Giants, and Tonawanda Kardex combined to go 0-7, getting outscored by a total of 172-0.

Only four of the 12 NFL teams in 1927 were still in the league five years later. The Bears, Giants, and Packers combined to outscore their opponents 459-161 that season. In this environment, it was easy for real teams to pad their records, but the Bears only won one championship. Furthermore, ties weren’t counted towards winning percentage, so when the Bears went 6-1-4 in 1924, that counted as an .857 record, worth three dynasty points. I’m sorry, but there’s no way going 6-1-4, with two draws each against the Racine Legion and the Rock Island Independents, should earn as many dynasty points as the 2010 Patriots or the 2011 Packers.

I include this team for the sake of completeness, but subjectively, it wouldn’t make my top 30, to say nothing of tied for 9th.

t9. Green Bay Packers, 1936-43
65-19-3 (.774), 2 championships, 3 title appearances
20 dynasty points
NFL 100 Members:
Curly Lambeau, Don Hutson
Other HOFers: Arnie Herber, Clarke Hinkle

Like the Joe Gibbs Dynasty in Washington, this team would actually benefit from a longer period than eight years: they were NFL champions in 1944. At a time when everyone played both offense and defense, the Packers had two great QBs (Cecil Isbell and Herber), a fullback who retired as the league’s all-time leading rusher (Hinkle), two very good linemen (Buckets Goldenberg and Bill Lee), a Hall of Fame coach (Lambeau), and Don Hutson.

Hutson was more than revolutionary; he was an anomaly. It is an understatement to say that he shattered records. Around the same time, Sammy Baugh redefined ideas about what passers could do, but Hutson was so outstanding that no one even thought to replicate what he was doing. In an 11-year career, he led the NFL in receptions eight times, in receiving yards seven times, and in receiving touchdowns nine times. He was also an excellent defensive player, with 30 interceptions in the six seasons the stat was kept. He led the league in 1940 and led in INT return yards in 1943. He was also a pretty good kicker, with nearly 200 extra points made. Like his contemporary Baugh, there’s a compelling argument that he is the greatest football player who ever lived.

Hinkle was an NFL 100 finalist as a linebacker. He was a terrific all-around player (#106) and a worthy NFL 100 finalist, but I don’t think there’s any single position at which he felt like he should be a finalist. I suppose linebacker was the best fit. [continue reading…]

{ 0 comments }

NFL Dynasties and the NFL 100 Team, Part I

Brad Oremland is a sportswriter and football historian. You can follow him on Twitter @bradoremland.


Like many of you, I’ve been following the release of the NFL’s 100th Anniversary All-Time Team with interest. American football is a team sport, and great players, by definition, are those who make their teams better. I was curious how the NFL 100 team relates to the greatest dynasties in pro football history, and what follows is an examination of that subject.

This will be very similar to an article I wrote last year, Top 30 NFL Dynasties and the Hall of Fame. If you’ve read that, you can skip this introduction on how I rate and define dynasties. The usual definition of a “dynasty” is something to the effect of a succession of rulers. To me, sports dynasties are measuring sticks. If you wanted to win a World Series in the 1940s, you had to beat the Yankees. In today’s NFL, someone has to beat the Patriots. And so on. And to be the measuring stick, to establish a legacy that might merit that word, dynasty, you have to sustain greatness: you need a series of great teams — a succession of rulers. [continue reading…]

{ 0 comments }

The top passers of 2019 share a word.

In 2018, Patrick Mahomes* led the NFL in both Adjusted Net Yards per Attempt and Value added. As regular readers know, ANY/A is calculated as follows: (Passing Yards + 20 * TD Passes – 45 *INT – Sack Yards Lost) / (Attempts + Sacks). Mahomes averaged 8.89 ANY/A last year, and the league average was 6.32; since the Chiefs quarterback had 606 dropbacks in 2018, that meant he added 1,554 Adjusted Net Yards of value over average. That easily led the league.

In 2019, Mahomes averaged 8.38 ANY/A and the league averaged 6.16 ANY/A. Mahomes missed some time this year due to injury, and finished with 501 dropbacks; he therefore added 1,113 Adjusted Net Yards of value over average. That wasn’t quite on pace with what he did last season, but it was still good enough to lead the league.

But it was Ryan Tannehill — who finally had his breakout season — who finished #1 in the NFL in ANY/A. Replacing Marcus Mariota in midseason, Tannehill averaged 8.52 over 12 games, 10 starts, and 317 dropbacks. That last number is why he only finished 5th in VALUE; he didn’t play long enough to add as much value as Mahomes, Dak Prescott, presumptive MVP Lamar Jackson (who also averaged 80.4 rushing yards per game), or Drew Brees.

The worst five quarterbacks in VALUE added, from 28th to 32nd: Giants rookie Daniel Jones, Browns second-year QB Baker Mayfield, soon to be ex-Bengals QB Andy Dalton, Bears third-year QB Mitchell Trubisky, and Panthers second-year QB Kyle Allen.

The full stats, below: [continue reading…]

{ 0 comments }

Brees is probably not about to throw an incomplete pass or take a sack.

In 1996 and 1997, Steve Young led the NFL in completion percentage each year. But in ’96, Young took a sack on 1 out of every 10 dropbacks and ranked 30th in the NFL in sack rate; in ’97, he had a 9.0% sack rate, which ranked 25th among qualifying passers.

In 1984, Steve Bartkowski ranked 1st in completion percentage but 28th in sack rate (12.9%!).

In 1991,Dave Krieg ranked 29th in sack rate when he led the NFL in completion percentage.

More often than you think, players trade low-probability passes for sacks, and vice-versa. Last year, when Brees led the NFL in completion percentage, the next 6 players in that metric — Kirk Cousins, Carson Wentz, Matt Ryan, Derek Carr, Marcus Mariota, and Deshaun Watson — all ranked outside of the top 15 in sack rate. (And to be clear, a low sack rate gives you a high ranking, just like interception rate, since sacks are a bad thing.) The last player to lead the league in completion percentage that wasn’t Brees was Sam Bradford in 2016; that year, he ranked 21st in sack rate. It recalled David Carr leading the NFL in completion percentage in 2006 when he ranked 26th in sack rate.

To have an excellent sack rate, you need to throw the ball quickly no matter what, even if nobody is open; that carries with it a high risk of lowering your completion percentage. Which makes it really impressive when a player ranks well in both categories. (And if you want to create a statistic that includes sacks in the denominator when calculating completion percentage, I approve!)

Brees is going to lead the NFL in completion percentage in 2019. With one week left in the season, Brees has a 4% lead on the rest of the NFL. The only interesting question is whether Brees will set yet another single-season record; right now, he is at 75.3%, and the current record is 74.4%, set by Brees last year.  He’s got a good chance to do it: even if he went 21-of-32 today (which is worse than he’s done in 8 of 9 games this year), he would still beat last year’s mark. [continue reading…]

{ 0 comments }

The NFL has announced its final All Century team. The full list below, but a few notes first.

1) The player with the shortest career was Gale Sayers (6 years, 68 games).

2) The player with the longest career was Adam Vinatieri (24 years, 365 games).

3) The Lombardi Packers had 12 or 13 Hall of Fame players (in addition to a Hall of Fame coach, of course), depending on whether you want to include Emlen Tunnell.  The great safety played with the Giants from ’48 to ’58, but finished his career with 3 years in Green Bay.  The last game of his career came, as a backup, in the first championship victory for Green Bay.  Tunnell made the #NFL100 team, but he’s not thought of as a Lombardi Packer.

In fact, other than the coach, Forrest Gregg was the only of the 12 Hall of Fame players on those great Packers teams to make the All-Century team.  That’s…. interesting, to say the least.

4) What do Ronnie Lott, Brett Favre, and Ed Reed have in common?  They are the only players on the team to play for the Jets.  Lott was there in  ’93 and ’94, Favre in ’08, and Reed in ’13.  Joe Namath, Don Maynard, Joe Klecko, and Curtis Martin are probably the best four Jets in history, but I don’t think any were all that close to making this team.  Martin and Klecko weren’t even finalists at their position.

5) The Jets were the least-represented team on the #NFL100, at least among teams that have been around for awhile.

  • The Jaguars and Panthers entered the NFL in 1995.  Combined, the teams have only one player-season — Reggie White in 2000 with Carolina.
  • The Jets began playing pro football in 1960, but have only the four player-seasons mentioned above.
  • The Saints have only five player-seasons: three from Doug Atkins and two from Earl Campbell, in both cases at the end of those players’ careers.
  • The Texans have six, with Reed playing there in 2013 and Shane Lechler there from ’13 to ’17.
  • The Bengals have 13, all coming from Anthony Munoz.  Every other team has at least 20.

6) The 1963-1966 Colts had 6 players make the All-Century team: QB Johnny Unitas, RB (and receiver) Lenny Moore, WR Raymond Berry, TE John Mackey, OG (and tackle) Jim Parker on offense, and DE Gino Marchetti on defense.  All six were on the Colts all four years other than Marchetti, who retired in ’65 and then returned for a final season in ’66.  In addition, those Colts teams also had Bob Vogel at LT, who was at the start of his 5-time Pro Bowl career.  And while Mackey entered the league in ’63, the Colts also had another Hall of Fame in Art Donovan until ’61, when Unitas, Moore, Berry, Parker, and Marchetti were still with Baltimore.

Those ’56 to ’63 Colts had a ridiculous amount of talent.

7) 1967 (Willie Lanier and Jan Stenerud in Kansas City, Ken Houston in Houston, Alan Page in Minnesota, and Gene Upshaw in Oakland) and 1983 (Eric Dickerson in Los Angeles, John Elway and Dan Marino in Denver and Miami, Bruce Matthews in Houston, and Darrell Green in Washington) each brought 5 top 100 players into pro football. That’s the most of any season. A lot of seasons had zero players, but 1992 and 1993 were the rare back-to-back seasons with zero players. The 1992 draft, in particular, was devoid of top-level talent.

The graph below shows how many of the All-Century players were active in each season.  The peak was 1971, with 28. [continue reading…]

{ 1 comment }

#NFL100 – Which 10 QBs Will Make The Team? Part II

The NFL has released its list of the 22 finalists for the all-century team at quarterback: Sammy Baugh, Sid Luckman, Otto Graham, Bobby Layne, Norm Van Brocklin, Johnny Unitas, Bart Starr, Fran Tarkenton, Joe Namath, Roger Staubach, Terry Bradshaw, Dan Fouts, Joe Montana, Dan Marino, John Elway, Steve Young, Troy Aikman, Brett Favre, Peyton Manning, Tom Brady, Drew Brees, and Aaron Rodgers.

Which 10 will make the list?  As I wrote yesterday, I think there’s a clear top tier of quarterbacks that must be included.  They are, in chronological order:

Sammy Baugh, Otto Graham, Johnny Unitas, Joe MontanaPeyton Manning, and Tom Brady.

Each of those QBs won multiple championships and multiple MVP awards; in fact, these 6 are the only 6 quarterbacks to do so.

I would then make a 7th tier for one QB.  Include him with the first 6 if you like, but whatever you do, you can’t justifiably keep him out of the top ten.

Dan Marino.

That leaves 15 quarterbacks remaining for just three spots.  So who misses — and makes — the cut?

Let’s go in reverse order: I think there are three quarterbacks who have little chance of making the cut: Troy Aikman, Dan Fouts, and  Joe Namath.  All are great, worthy Hall of Famers, but all have too many obstacles to making a top ten list.

  • Aikman didn’t have an extraordinarily high peak or longevity and he was not a statistical superstar.  Despite the difference in team success, he was a direct contemporary (and competitor) with Steve Young, and he loses that battle.
  • Fouts was very good at the end of the ’70s, but he’s generally lumped in with Montana and Marino as quarterbacks of the ’80s: and he loses those battles every time.  He was the best quarterback from ’75 to ’84, but the lack of postseason success haunts (and especially his performances in losses) him in a way that he needed more than just 2 first-team All-Pro honors to overcome.  Fouts only ranked 4th all-time in passing touchdowns at the time of his retirement, and never  caught Fran Tarkenton for the passing yards crown.  An outstanding player, but he does not have a great argument for being one of the 10 best passers of all time.
  • Namath is probably the most underrated quarterback in pro football, at least if you listen to those who just look at his raw stats.  He was the best of his generation at avoiding sacks and fumbles, and while he threw a lot of interceptions, he also was well ahead of every other quarterback in his era at moving the ball down the field.  He won 2 AFL MVP awards and was named the AFL All-Decade QB, but with only one Super Bowl title and an injury-shortened career, he’s not top 10 material.

That leaves 12 quarterbacks with 3 open spots, which we can sort of group into four eras.

The Active Guys: Drew Brees, and Aaron Rodgers.

A big caveat here: much (all?) of the voting was done after the 2018 season, making this really the #NFL98.  And the last two years help out Brees a lot more than they help Rodgers. Brees led the NFL in passer rating in 2018 and may do it again in 2019, while setting a new all-time single-season mark in completion percentage both seasons.  Rodgers has fallen on relative hard times, by the standards of an all-time great.

At this point, it’s hard to argue for Brees not being in the top 10 all-time.  He’s led the NFL in passing yards 7 times, touchdowns 4 times, and completion percentage 6 times.  He’s also the all-time leader in both passing yards and passing touchdowns.  Brees has also quietly moved into 4th all-time in career wins.

The knocks on Brees are threefold, at least when it comes to being a top-10 QB ever: he’s never won an MVP, he had just 1 All-Pro season, and has won only one title.  He’s also 4th all-time in career losses.  But the biggest knock is he was clearly not the best or second best QB of his generation, and he might even be the 4th-best QB of his era depending on how you rank Rodgers.

While Brees comes up short with the MVP voting Rodgers has two legendary, MVP seasons.  He’s won a Super Bowl and been extraordinarily unlucky in the playoffs.

  • In 2016, he staged an epic comeback with two Hail Marys on the final drive to force overtime, and then his team lost before he ever took the field again.
  • The year before, his Packers failed to recover an onside kick at the end of the fourth quarter; Seattle scored a touchdown, Rodgers answered with a field goal drive, and then never saw the field in overtime in that game, either.
  • In 2013, Rodgers led Green Bay on a field goal drive to tie the game. The 49ers responded by putting together a 14-play drive to take the final 5:06 off the clock and kicked a game-winning field goal on the game’s last play.
  • Rodgers lost his first playoff game in one of the greatest passing matchups ever: he threw for 423 yards on 42 passes, produced 5 touchdowns, and the 45 points that produced was only enough to give the Packers a chance to go to overtime.
  • The other three postseason losses on Rodgers’ resume came when the Packers allowed 37, 44, and 45 points.

Rodgers has the best passer rating of all time.  He also has the best TD/INT ratio of all time.  Both of those statistics, of course, are not era-adjusted, although his era-adjusted numbers are still outstanding.  At the time of the voting, Rodgers has completed 8 full seasons and two half-seasons, with off-the-charts efficiency numbers. But he was clearly not Brady or Manning, and if you value volume, he wasn’t at Brees’s level yet, either.

With only three spots remaining, and two of the first 7 going to contemporaries, I think neither make the team.

Verdict: Neither. [continue reading…]

{ 0 comments }

#NFL100 – Which 10 QBs Will Make The Team, Part I?

The NFL has released its list of the 22 finalists for the all-century team at quarterback: Sammy Baugh, Sid Luckman, Otto Graham, Bobby Layne, Norm Van Brocklin, Johnny Unitas, Bart Starr, Fran Tarkenton, Joe Namath, Roger Staubach, Terry Bradshaw, Dan Fouts, Joe Montana, Dan Marino, John Elway, Steve Young, Troy Aikman, Brett Favre, Peyton Manning, Tom Brady, Drew Brees, and Aaron Rodgers.

We know that the final team will have 10 quarterbacks on it. Who will make it? I think there are 6 (or 7) locks that are guaranteed to make the team. The real debate is who are the last three to join them. So today, let’s review the 7 quarterbacks who seem to be assured a place on the final team.

When the NFL unveiled its 50th anniversary team in 1969, Johnny Unitas was the first-string QB, Sammy Baugh was the backup, and Norm Van Brocklin was the third string choice.

When the NFL named its 75th anniversary team, Unitas and Baugh remained, and were joined by Joe Montana and Otto Graham, whose legend grew over the previous 25-year period.

With the NFL set to name its 100th anniversary team, there’s little reason to think that Unitas, Baugh, Montana, and Graham won’t make this team, too. There are, after all, 10 spots, and there won’t be 7 QBs from the last 25 years and there’s not much justification to switch out any of Unitas/Baugh/Montana/Graham. [continue reading…]

{ 0 comments }

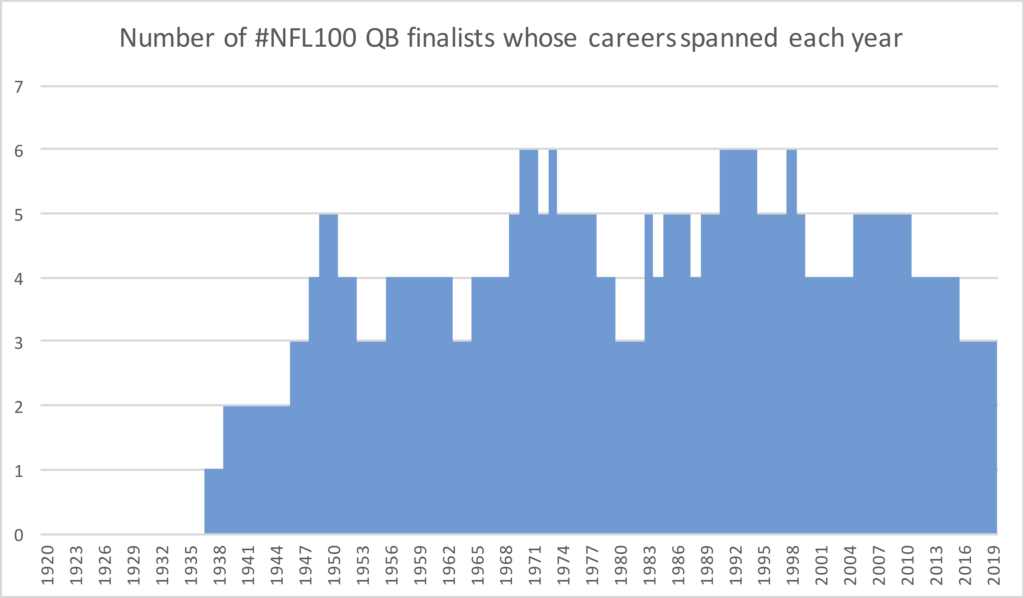
The NFL released the 22 finalists at the quarterback position for the #NFL100 all-century team.  The list was relatively unsurprising: Sammy Baugh, Sid Luckman, Otto Graham, Bobby Layne, Norm Van Brocklin, Johnny Unitas, Bart Starr, Fran Tarkenton, Joe Namath, Roger Staubach, Terry Bradshaw, Dan Fouts, Joe Montana, Dan Marino, John Elway, Steve Young, Troy Aikman, Brett Favre, Peyton Manning, Tom Brady, Drew Brees, and Aaron Rodgers.

The list also had a somewhat modern tilt to it, effectively ignoring the first 15 years of the NFL’s history, and with little representation of passers before World War II.  It also dips in 1980, as Namath, Tarkenton, and Staubach all retired in the late ’70s, and Montana was the only Hall of Fame QB to enter the league in the nine-year period fro 1974 to 1982.  Finally, it dips at the end, in part because those players are still building their Hall of Fame careers.

[continue reading…]

{ 0 comments }

Previous Passing Stats:

Daniel Jones, Ryan Tannehill, and Ryan Fitzpatrick all began the season on the bench. But in week 16, these three threw for over 1,000 yards and 12 touchdowns.

On the other hand, a pair of third string quarterbacks were truly ugly on Sunday. Will Grier, who began the season as Carolina’s third option at quarterback, was the worst passer of the week. In his first NFL start he had 3 interceptions, 5 sacks, and zero touchdowns. Meanwhile, Pittsburgh — already down its first two options at quarterback this year — saw their playoff hopes dwindle after an ugly performance by Devlin Hodges against the Jets.

It was a weird week of NFL passing. Aaron Rodgers and Deshaun Watson were both bad: they combined to throw 0 touchdowns with 2 interceptions and 8 sacks. And yet both quarterbacks won, as Jameis Winston and Kirk Cousins were even worse.

The table below shows the week 16 passing stats. [continue reading…]

{ 0 comments }

AFC Wild Card Race: Titans, Steelers, and yes, Raiders

The AFC playoff seeding is pretty simple. Here are the standings after 16 weeks:

AFC Standings Table
Tm W L T W-L%
PF PA PD MoV SoS SRS OSRS DSRS
Baltimore Ravens 13 2 0 .867 503 272 231 15.4 0.1 15.5 11.2 4.4
New England Patriots 12 3 0 .800 396 198 198 13.2 -1.1 12.1 3.5 8.6
Kansas City Chiefs 11 4 0 .733 420 287 133 8.9 0.4 9.3 6.1 3.2
Buffalo Bills 10 5 0 .667 308 246 62 4.1 -1.0 3.1 -2.5 5.6
Houston Texans 10 5 0 .667 364 350 14 0.9 0.8 1.7 1.7 0.0
Tennessee Titans 8 7 0 .533 367 317 50 3.3 -0.9 2.4 1.3 1.1
Pittsburgh Steelers 8 7 0 .533 279 275 4 0.3 0.3 0.6 -3.9 4.5
Indianapolis Colts 7 8 0 .467 341 335 6 0.4 -0.8 -0.4 -0.9 0.4
Oakland Raiders 7 8 0 .467 298 403 -105 -7.0 -0.2 -7.2 -2.3 -5.0
Cleveland Browns 6 9 0 .400 312 360 -48 -3.2 2.3 -0.9 -0.4 -0.6
Denver Broncos 6 9 0 .400 266 301 -35 -2.3 0.6 -1.8 -4.3 2.5
New York Jets 6 9 0 .400 263 353 -90 -6.0 -1.4 -7.4 -5.7 -1.6
Los Angeles Chargers 5 10 0 .333 316 314 2 0.1 -1.5 -1.4 -1.9 0.5
Jacksonville Jaguars 5 10 0 .333 262 377 -115 -7.7 -0.6 -8.2 -5.9 -2.3
Miami Dolphins 4 11 0 .267 279 470 -191 -12.7 -0.3 -13.0 -3.2 -9.8
Cincinnati Bengals 1 14 0 .067 246 397 -151 -10.1 1.7 -8.4 -5.3 -3.1

The Ravens beat the Patriots head-to-head, so Baltimore has locked up the #1 seed.

The Patriots have a 1-game lead over Kansas City but lost head-to-head; New England will get the #2 seed and the all-important bye week unless New England loses at home to Miami AND the Chiefs beat the Chargers at home.  That is very unlikely to happen: New England is a 16.5-point favorite.

The distinction between the 3 seed and the 4 seed isn’t very important.  That said, the Chiefs are the overwhelming favorite to get the 3 seed, but the Texans do hold the tiebreaker by virtue of the head-to-head win. Kansas City hosts the Chargers, while the Texans host the Titans.  In reality, Houston may decide to rest an injured Deshaun Watson and any other injured players to get ready for the playoffs, which makes it even less likely that Houston would jump from the 4 to the 3 seed. [continue reading…]

{ 0 comments }

Jameis Winston Is A Very Fun QB

Jameis Winston has played 15 games so far this season, and he’s thrown for 4,908 yards, with 31 touchdowns and 28 interceptions.  He is going to run away with the INT crown, is a good favorite to win the passing yards crown, and will likely finish anywhere from 1st to 3rd in passing touchdowns. Winston also is in a tight race with two half-season guysMatthew Stafford and Ryan Tannehill — to win the yards per completion crown.  Oh, and he leads the NFL right now in sacks taken, too.

Some of this is a function of him leading the NFL in pass attempts (he’s also played 15 games, while most teams play their 15th game today).   But Winston is also just extreme in almost every fun stat, which is why I decided to revisit my Fun QB Index with some tweaks.

Here are the rules for being fun:

  • Passing a lot.
  • A high yards per completion average.
  • Touchdowns.
  • Interceptions.

So here’s the simple formula I came up with:

Fun = [ (Yards per Completion – 10.0) * Completions, plus 45 x INTs, plus 45 x TDs ] / Games Played

This isn’t a rate stat, which means you get more credit for passing more often…. except when it comes to yards per completion.  There, you only get credit for your yards per completion above 10.0.

Let’s use this formula for Winston.  He’s completed 367 of 602 passes for 4,908 yards, a 13.37 yards per completion average.  So he gets credit in the YPC component of the formula for (3.37 * 367), or 1,237 yards.  With 59 combined TDs/INTs, that gets him another 2,655 yards.  That gives him 3,892 fun yards, which is an average of 259.5 yards per game of fun.

Now, that probably means nothing to you in the abstract. But here is how the 2019 quarterbacks look when you run them through the same formula: [continue reading…]

{ 0 comments }

Long Passing Touchdowns, By Year

It’s a good thing we have Kirk Cousins, the 2019 NFL said. The Vikings quarterback leads the league with four touchdown passes of 50+ yards, with three of them going to Stefon Diggs. Daniel Jones, Patrick Mahomes, Lamar Jackson, and Dak Prescott are the only other passers with three such touchdowns.

The graph below shows the amount of 50+ yard passing touchdowns in each season since 1950, graphed on a per-16 team game basis.

As Adam noted in the comments a week ago, there have been fewer big pass plays this season. That isn’t quite reflected in this chart (which only looks at touchdowns), but there is still a small dropoff.

And, of course, a huge dropoff from the late ’60s. In 1968; there were a whopping 96 touchdown passes in only 364 team games. The charge was led by AFL stars John Hadl (10, with three apiece to Lance Alworth, Gary Garrison, and Jacque MacKinnon), Len Dawson (6, with half to Frank Pitts), and Joe Namath (5, all to Don Maynard). The next year, however, the total dropped by 30 to just 66 in the same 364 games. Hadl and Dawson threw just two long touchdowns that season.  The big jump year was ’98, which was fueled by Antonio Freeman (6) and Randy Moss (5).

What else stands out to you?

{ 1 comment }

The 2019 Titans Are Kicking Like It’s 1952

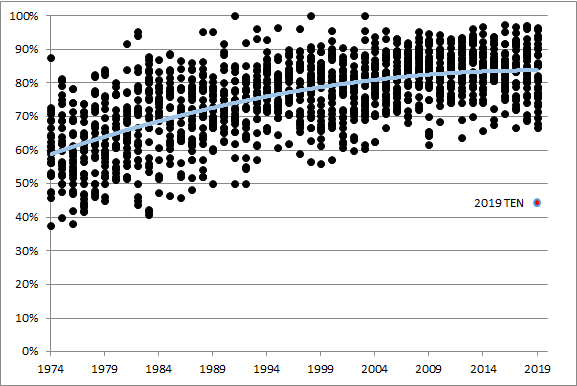
Field goal rates have been improving significantly over the last several decades. And while field goal success rate isn’t the best stat because it treats field goals of all distances equally, it’s remarkably consistent at the league level: the field goal success rate was between 84.0% and 84.7% over each of the last five years prior to 2019.

But this season, the league’s field goal rate has dropped significantly to 80.9%.  But what’s truly remarkable is what’s happening with the Titans.  The graph below shows the field goal success rate for every team in every year from 1974 (the year the goal posts were moved) to 2019.  See if you can spot the 2019 Titans.

[continue reading…]

{ 0 comments }

Previously:

Jacksonville won with a Game Script of -8.1 on Sunday, giving the Jaguars one of the best comebacks of the season. Jacksonville started the game with a 65-yard drive, then had drives of 3 yards, -5 yards, -2 yards, 14 yards, and 6 yards. Jacksonville trailed 16-3 in the third quarter, but the team responded with a 72-yard field goal drive, a 53-yard TD drive, and a 56-yard TD drive to steal a victory in Oakland.

The Steelers were the most pass-happy team of the week, which was pretty odd considering how poorly Devlin Hodges played. Pittsburgh had a positive Game Script for the week, but Hodges still finishes with 42 dropbacks. James Conner finished with only 8 carries for 42 yards, although a costly fumble on a wildcat play perhaps led the Steelers towards a more pass-happy game plan. Hodges finished with just 8 first downs (a 19% rate), so nothing was really working for Pittsburgh against a tough Bills defense.

TeamH/ROppBoxscorePFPAMarginGame ScriptPassRunP/R RatioOp_POp_ROpp_P/R Ratio
NORINDBoxscore3472717303347.6%351767.3%
DALLARBoxscore44212314.9234533.8%541479.4%
BALNYJBoxscore42212114253442.4%332457.9%
TAM@DETBoxscore38172112.6442960.3%451871.4%
KANDENBoxscore2332012.4372559.7%421573.7%
MIN@LACBoxscore39102910.4253740.3%421968.9%
SEA@CARBoxscore3024610.3293446%432959.7%
ARICLEBoxscore3824148.7253442.4%442365.7%
GNBCHIBoxscore211388.4342458.6%562767.5%
NWE@CINBoxscore3413217.4313249.2%313249.2%
HOU@TENBoxscore242135.7283544.4%392858.2%
NYGMIABoxscore3620165.1303347.6%442563.8%
BUF@PITBoxscore171071.6263840.6%421573.7%
PHI@WASBoxscore372710-1.5452861.6%282354.9%
ATL@SFOBoxscore29227-2.1412067.2%352756.5%
JAX@OAKBoxscore20164-8.1312258.5%403255.6%

The Cowboys, Bills, and Bengals stood out as the most run-heavy teams of the week. Dallas ran on 66% of its plays against the Rams in week 15, making it the most run-heavy game the Cowboys have had in 13 years! How long ago was that? This game came four weeks before Tony Romo‘s first start!

Meanwhile, the Bengals had another week of giving up. No, this wasn’t quite as bad as the run-heavy performance in a blowout loss to Baltimore, but Cincinnati finished with 31 pass attempts and 31 rush attempts in a blowout loss to the Patriots.  A 50/50 run/pass split is pretty rare in most games, but very rare when the Game Script is -7.4.  On the other hand, Andy Dalton was very bad — he threw a pick 6 on top of three other interceptions — and Joe Mixon actually had a strong day on the ground. So maybe this wasn’t the worst strategy for Cincinnati.

What stands out to you?

{ 0 comments }

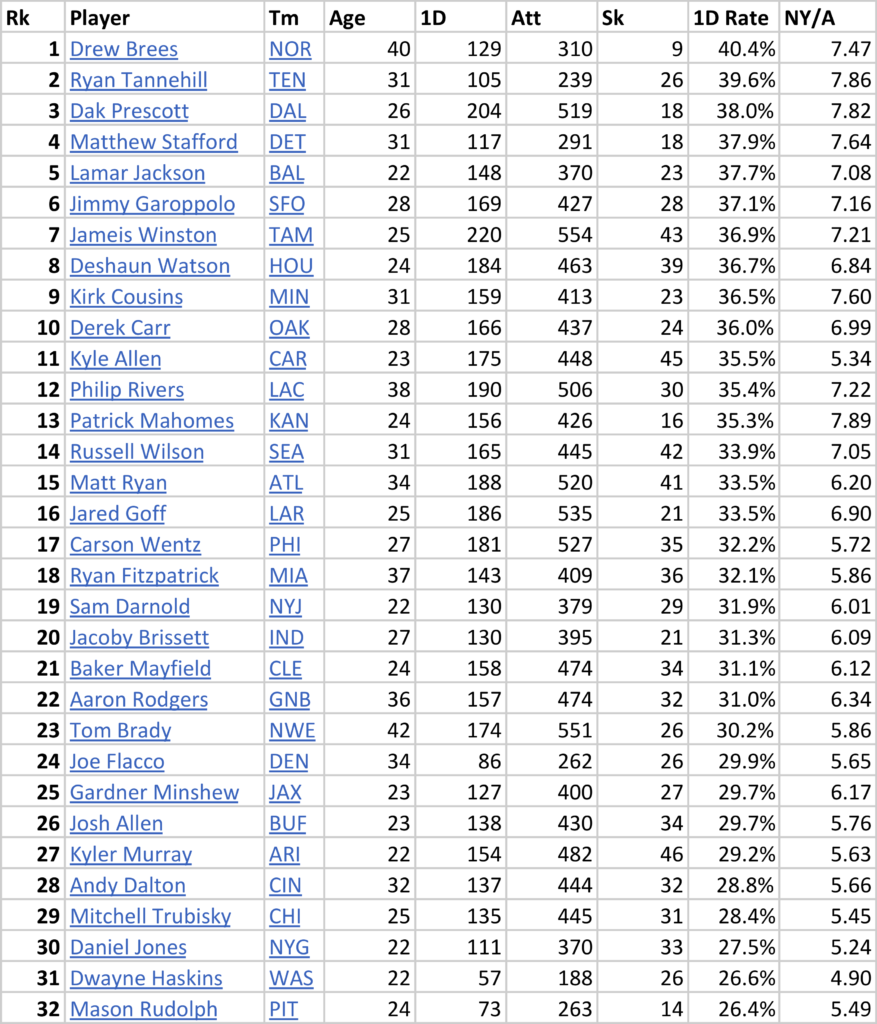
Kyle Allen and Patrick Mahomes are at opposite ends of the quarterback spectrum. Allen was an undrafted free agent; Mahomes is one of the most talented quarterbacks in league history and was the 2018 NFL MVP.

Allen ranks 32nd out of 34 qualifying quarterbacks in the most basic (in a good way) of passing stats: net yards per attempt.

Mahomes ranks 1st this year in NY/A, after ranking 1st in the same stat last year among quarterbacks who started at least 8 games.  Net yards per attempt is a good stat, and Mahomes is excellent at it because he’s an excellent quarterback (or maybe vice versa).

But you know better than to expect this to be a “Mahomes good Allen bad” post. Because I did a triple take this morning when I noticed that Kyle Allen has thrown for first downs at a higher rate this season than Mahomes.  That seemed impossible, and I had to double check twice just to make sure the data wasn’t wrong.

In general, there is a significant correlation between Net Yards per Attempt (which is passing yards, net of sack yards lost, divided by pass attempts plus sacks) and Passing 1st Down Rate (which is passing first downs divided by pass attempts plus sacks).   Both of these are very good stats to measure quarterback play, and last year, Mahomes led the NFL with a 43.2% passing first down rate.   Passing 1st Down Percentage is a good quick and dirty stat, and one where the best quarterbacks tend to fare very well. It is certainly not biased against a player like Mahomes.  But this year, Mahomes ranks 13th in that metric despite still having a very good NY/A average, while Allen shockingly ranks 11th in the metric.

So we have two pretty good, and easy to calculate passing stats, that in general are very correlated.  How correlated? Take a look at the graph below, which shows the same data as the table above.  And while the logos are for teams, the data  is for individual quarterbacks, not team-level data. So the Jets logo is only Sam Darnold, not the full Jets passing stats in 2019. And for the Redskins, Titans, and Steelers, it’s Dwayne Haskins, Ryan Tannehill, and Mason Rudolph in the chart below.  The Panthers, and to a lesser extent, the Chiefs, stand out as a notable outlier: [continue reading…]

{ 33 comments }

Previous Passing Stats:

It finally happened: last night, Drew Brees threw 4 touchdown passes, to pass Peyton Manning and to move into first place on the all-time passing touchdowns list. A few years ago, Bryan Frye detailed the history of the passing TD crown, from Benny Friedman to Manning.  Manning held the record for a little over 5 years, while Brees may not hold the record for very long at all if Tom Brady gets his way.  The shortest reign belongs to Bobby Layne, who held it for just over a year.

Oh, and Brees also set a record for the best completion in NFL history by a quarterback with more than 10 passes (trivia note: Kurt Warner holds the record, at 10, for most passes in a game without an incompletion).  Brees completed 29 of 30 passes, and he did that without taking a sack, either (Warner took two in his 10/10 game).  In the list of games with just one incompletion, everyone with more than 18 pass attempts had at least four sacks.  To complete 29 passes on 30 dropbacks is remarkable.  Only Steve Young (here)  and Warner (here) have had a game with 20+ attempts and less than three combined sacks and incomplete passes.

The table below shows the week 15 passing stats. The top passers of the week were Jameis Winston, Drew Brees, Lamar Jackson, and Russell Wilson, which is hardly surprising… but Dwayne Haskins also cracked the top group, along with Dak Prescott and Patrick Mahomes. The full week 15 passing stats below. [continue reading…]

{ 0 comments }

#NFL100 – Top 6 Outside Linebackers

Previously: Running Backs; Defensive Ends; Defensive Tackles

As you know, the NFL is announcing its top 100 players in league history as part of the league’s 100-year anniversary. The nominating committee selected 12 outside linebackers [1]There are three players with labeling issues to discuss here: Chuck Bednarik, Clarke Hinkle, and Junior Seau (who isn’t on the above list). We will get to them at the end of this article. as finalists, and with the exception of the lone active player (Von Miller), every player is in the Hall of Fame. For the final team, 6 outside linebackers were chosen. The table below shows the finalists and those selected for the official team: [continue reading…]

References

References
1 There are three players with labeling issues to discuss here: Chuck Bednarik, Clarke Hinkle, and Junior Seau (who isn’t on the above list). We will get to them at the end of this article.
{ 0 comments }

Marcus Peters Is Impossible

Marcus Peters was drafted by the Kansas City Chiefs in 2015. That year, he led the NFL in four categories: interceptions (8), interception return yards (280), interceptions returned for touchdowns (2), and passes defended (26).

Two years later, Peters again led the NFL in interception return yards, with 137 on 5 interceptions. The next season, with the Ravens, he had 107 return yards on three interceptions.

This year? He’s recorded 5 interceptions for 210 yards and 3 touchdowns — leading the NFL in all three categories — while splitting his time between the Rams and Ravens.

Since the start of the 2015 season, Peters has 27 interceptions; no other player has more than 17 (Darius Slay).  Over half of his interceptions have brought above over 20 yards, and he has just 6 interceptions where he hasn’t returned the pass.

Since the start of the 2015 season, Peters has 6 picks six; Aqib Talib is second with 4, and no other player has more than three.

Since the start of the 2015 season, Peters has 797 interception return yards; that’s over 150 more yards than the number two and three players (Talib and Stephon Gilmore) combined. Peters has produced a monstrous edge in this category since entering the league. [continue reading…]

{ 0 comments }

Week 14 (2019) Game Scripts: The League Goes Run-Heavy

Previously:

One of the big upsets of the year came in week 14: the Broncos were 8-point underdogs to Houston, and jumped out to a 31-3 halftime lead.  That sort of blowout by a large underdog only happens about once every two years.  There was also a large comeback in week 14, as the Eagles beat the Giants with a -6.4 Game Script. The Giants raced ahead to a 17-3 halftime lead, but Philadelphia scored three touchdowns — one in each of the final three quarters — to win, 23-17.

It was a pretty run-heavy week 14; no team passed on even 71% of their plays. There were 6 games in week 13 where a team passed on at least 71% of plays, and then zero last week. If you squint, you could call the Giants, Cowboys, and Colts pass-happy last week, but none were all that one-sided.  The full Game Scripts data below:

TeamH/ROppBoxscorePFPAMarginGame ScriptPassRunP/R RatioOp_POp_ROpp_P/R Ratio
DEN@HOUBoxscore38241418.5282750.9%532270.7%
LAC@JAXBoxscore45103516.4283048.3%402363.5%
MINDETBoxscore2071311.7313944.3%452267.2%
LARSEABoxscore2812169.6323547.8%412166.1%
ATLCARBoxscore4020209.1353252.2%462267.6%
GNBWASBoxscore201558.7322853.3%312852.5%
CHIDALBoxscore312476.4333449.3%512269.9%
BAL@BUFBoxscore241776.3263344.1%452465.2%
TEN@OAKBoxscore4221216273245.8%352558.3%
KAN@NWEBoxscore231675.7412958.6%402264.5%
PIT@ARIBoxscore231765.1223538.6%352261.4%
CLECINBoxscore271983.1252748.1%413156.9%
NYJMIABoxscore222112.3373253.6%392759.1%
SFO@NORBoxscore48462-1.1392461.9%412760.3%
TAMINDBoxscore38353-4.2502864.1%372262.7%
PHINYGBoxscore23176-6.4533262.4%322061.5%


Meanwhile, Pittsburgh, Baltimore, and Washington were all pretty run-heavy.  The Redskins/Packers game reminded me a bit of the Broncos/Packers game from week 3; the Packers controlled the game, but the other team still deployed a run-heavy game plan.  Dwayne Haskins had 31 dropbacks (and no rushing attempts other than a kneel), while Adrian Peterson and company had 26 carries.  Washington opened the game with 3 3-and-outs. The first one was run for 0, run for 1, sack. The second was sack, incomplete pass, pass for 9. The third was run for 3, run for 6, incomplete.  Give the Redskins credit for variety, at least.

With the Ravens, we expect run-heavy game plans every week, and week 14 was no exception.  Lamar Jackson had 26 passing plays, while Baltimore had 33 runs (two kneels).  Interesting, none of Jackson’s 10 runs were scrambles.

As for the Steelers, Devlin Hodges led a run-heavy game plan with Pittsburgh, made easier by an 85-yard punt return touchdown in the first quarter. Against the Cardinals, Hodges went 16 for 19 for 152 yards with a TD and three sacks; he also had 4 scrambles. Pittsburgh’s running game wasn’t particularly effective, as the running backs had 28 carries for 98 yards and just three first downs.  But Hodges picked up 12 first downs on his 26 dropbacks (including scrambles), and that was enough — along with a strong Steelers defense — to carry the day.

{ 0 comments }

Lamar Jackson Leads The NFL In Adjusted Passer Rating

Jackson is the overwhelming favorite to win the MVP award.

Six years ago, I wrote about tweaking the passer rating formula. I am going to update that article today, to better analyze the remarkable season that Ravens second-year quarterback Lamar Jackson is having.

The main updates:

1) There’s no reason to exclude sack data from passer rating. Sacks happen on passing plays, and a quarterback should *not* get more credit in the passer rating formula for taking a sack rather than throwing an incomplete pass.

2) Scrambles should be treated like completed passes, and rushing yards should be counted the same as passing yards. I am going to broaden this today to include all rushing attempts, excluding kneels. A 10-yard run is just as valuable as a 10-yard pass, and a scramble on 3rd down should impact completion percentage the same way a check down to the running back does.  However, I am going to exclude all kneels from the data, which really shouldn’t be recorded as rushing plays to begin with.

3) Rushing touchdowns should be counted with passing touchdowns. This is self-evident.

4) Lost Fumbles should be counted with interceptions. Also self-evident.

Passer rating consists of four metrics, all weighted equally: completions per attempt, yards per attempt, touchdowns per attempt, and interceptions per attempt. I will use the same formula with the same weights and the same variables, but redefine what those variables are. Here are the new definitions, with the additions in blue. I have then shown the 2019 results, using the data as of this morning (i.e., through 14 weeks, plus the Ravens/Jets Thursday night game in week 15), for the 32 players with the most pass attempts so far this year. [continue reading…]

{ 1 comment }

#NFL100 – Top 7 Defensive Tackles

Previously: Running Backs; Defensive Ends

As you know, the NFL is announcing its top 100 players in league history as part of the league’s 100-year anniversary. The nominating committee selected 17 defensive ends as finalists, and with the exception of three non-eligible players (Peppers, Watt, Ware) every player is in the Hall of Fame. For the final team, 7 defensive ends were chosen. The table below shows the finalists and those selected for the official team:

PlayerTeam(s)First YrLast YrSelected?
Buck BuchananKansas City Chiefs19631975Selected
Joe GreenePittsburgh Steelers19691981Selected
Bob LillyDallas Cowboys19611974Selected
Merlin OlsenLos Angeles Rams19621976Selected
Alan PageMinnesota Vikings; Chicago Bears19671981Selected
John RandleMinnesota Vikings; Seattle Seahawks19902003Selected
Randy WhiteDallas Cowboys19751988Selected
Curley CulpKansas City Chiefs; Houston Oilers; Detroit Lions19681981Finalist
Art DonovanBaltimore Colts; New York Yanks; Dallas Texans; Baltimore Colts19501961Finalist
Cortez KennedySeattle Seahawks19902000Finalist
Gene LipscombLos Angeles Rams; Baltimore Colts; Pittsburgh Steelers19531962Finalist
Leo NomelliniSan Francisco 49ers19501963Finalist
Warren SappTampa Bay Buccaneers; Oakland Raiders19952007Finalist
Tom SestakBuffalo Bills19621968Finalist
Ernie StautnerPittsburgh Steelers19501963Finalist
Bill WillisCleveland Browns19461953Finalist

The Great Decade

Is it really possible that the 4 best defensive tackles in history were all in their primes at the start of the 1970s?

Bob Lilly entered the NFL in 1961. Merlin Olsen joined a year later. Alan Page was drafted in 1967, and Joe Greene was picked two years later.

When Brad Oremland did his series on the greatest defensive tackles in history, he ranked these four as the top four ever: he ranked Page at 30, and put Greene at 16, Olsen at 13, and Lilly at 12. As Brad noted:

Associated Press first-team All-NFL defensive tackles, 1964-75: (1964) Bob Lilly and Henry Jordan, (1965) Bob Lilly and Alex Karras, (1966) Bob Lilly and Merlin Olsen, (1967) Bob Lilly and Merlin Olsen, (1968) Bob Lilly and Merlin Olsen, (1969) Bob Lilly and Merlin Olsen, (1970) Merlin Olsen and Alan Page, (1971) Bob Lilly and Alan Page, (1972) Joe Greene and Mike Reid, (1973) Joe Greene and Alan Page, (1974) Joe Greene and Alan Page, (1975) Curley Culp and Alan Page. That’s seven selections for Lilly, five for Olsen, five for Page, three for Greene (he added a fourth in 1977), and four for everyone else combined.

That’s a mean vertical leap.

Lilly, Olsen, Page, and Greene were more or less contemporary, competing with one another for honors — Lilly, Olsen, and Page especially, since they all played in the NFC. Lilly, for instance, almost certainly would have been first-team All-Pro in 1970 if Olsen and Page hadn’t both been in their primes at the same time. The All-Pro and Pro Bowl honors showered upon these players actually undersell how dominant they were. I tend to be skeptical about claims that all the greatest players were from the same era, especially when that era is the ’60s and early ’70s — but Lilly, Olsen, Page, and Greene really were the most outstanding defensive tackles in the history of professional football. Until Aaron Donald logs a couple more seasons, only Randy White is really even close.

In Sean Lahman’s Pro Football Historical Abstract, he ranks Olsen was the best defensive tackle ever, Lilly as the second-best, Green as his third-best, and Page as his fifth-best. Only Randy White — who, yes, has a very strong claim to being a top-5 DT ever — breaks the chain, as Lahman ranks White (drafted by the Cowboys in ’75 months after Lilly retired) fourth.

John Turney ranked the top 4-3 DTs ever last summer. Turney ranked Lilly as the best ever, followed by Greene, Olsen, and Page, and then White a tier below but in fifth place.

Bryan Frye put Page, Lilly, Greene, and Olsen on his personal DT Mt. Rushmore. At this point, I’d like to remind you that Page is typically ranked 4th among this group, and Frye noted that Page was the best DT in the league for 4 different seasons, with the other three all active those years.  In ’73, Page was the Defensive Player of the Year according to both the Professional Football Writers of America and the Newspaper Enterprise Association (Dolphins safety Dick Anderson, who led the NFL in interceptions and pick sixes, won the AP award). In 1971, Page won the AP MVP award — not the Defensive Player of the Year award, but the MVP award.  In 1970, Page was named the NFC Defensive Player of the Year (in a conference featuring Lilly and Olsen) by the NEA, and easily being named a consensus first-team All-Pro.  He was better that year than a 2nd-year Greene (who lost out on the AP’s All-AFC team to Jets DT John Elliott).  And in 1969, Page was one of the stars of arguably the greatest defense of all time.  He also was the NFC Defensive Player of the Year in 1974, although Greene was the AFC DPOY and overall DPOY.  So Page, playing in the most star-studded DT of all time, was the best defensive tackle in the league 3 or 4 times, and is typically the least-heralded of the bunch.  When the #NFL100 committee put together this list, only two defensive tackles were unanimous selections: Lilly and Page. Greene and Olsen should have been, too.

So yes, it really is possible that the four best defensive tackles all played in the same era.  Strange, but true. [continue reading…]

{ 0 comments }

Leonard Williams: Where Are The Sacks?

Leonard Williams was the 6th pick in the 2015 Draft.  He hasn’t been an outright bust by any means, but he’s certainly failed to deliver much in the way of big plays.   He’s never missed a game in his career, and will only finish 2019 with 15 games played because he got to experience two bye weeks: with the Jets in week 4 and then with the Giants in week 11.  He has recorded over 200 tackles in his career, but among first round defensive linemen with that number of tackles, his sack totals are shockingly low.

For years, Williams always seemed “on the verge” of a breakout season because of his quarterback hits numbers. He had 21 as a rookie, and then 7.0 sacks in a promising second season. In year 3, he had only 2.0 sacks but a whopping 25 quarterbacks hits…. and then in 2018 he had 20 quarterback hits and only 5.0 sacks. This year? He has 12 quarterback hits and zero sacks. In general, you expect about a 40-45% ratio between quarterback hits and quarterback sacks. But Williams is an extreme outlier, recording 17 sacks against a whopping 97 quarterback hits over his 5-year career.

The graph below shows the sack totals (X-Axis) and quarterback hits totals (Y-Axis) for defensive players from 2015 to 2019. [continue reading…]

{ 0 comments }

Previous Passing Stats:

Patience is a virtue best served cold for Dolphins fans. It took six failed breakout seasons, but eventually, Dr. Kevorkian finally came for the Ryan Tannehill era in Miami. Maybe all Tannehill needed for his breakout season to be realized was to change teams?

On Sunday, Tannehill had yet another career game, completing 21 of 27 passes for 391 yards, with 3 TDs and one tipped interception. Shockingly, he didn’t take a single sack, for just the 7th time in his career. He threw for 15 first downs. In Tannehill’s last game with the Dolphins, he was seen throwing for just 8 first downs on 35 dropbacks (31 attempts, 4 sacks). His success in Tennessee is unsustainable — he’s not going to average 13.4 yards per completion or complete 73% of his passes — but he’s been legitimately great over the last two months. Nobody ever knows how the Ryan Tannehill Experience will change week to week, but it’s been a fun ride for a player who never could put it together for long with the Dolphins.

The table below shows the week 14 passing stats. [continue reading…]

{ 0 comments }

#NFL100 – Top 7 Defensive Ends

Previously: Running Backs

As you know, the NFL is announcing its top 100 players in league history as part of the league’s 100-year anniversary. The nominating committee selected 17 defensive ends as finalists, and with the exception of three non-eligible players (Peppers, Watt, Ware) every player is in the Hall of Fame. For the final team, 7 defensive ends were chosen. The table below shows the finalists and those selected for the official team:

PlayerTeam(s)First YrLast YrSelected?
Bill HewittChicago Bears; Philadelphia Eagles; Phil-Pitt Steagles19321943Selected
Len FordLos Angeles Dons (AAFC); Cleveland Browns; Green Bay Packers19481958Finalist
Andy RobustelliLos Angeles Rams; New York Giants19511964Finalist
Gino MarchettiDallas Texans; Baltimore Colts19521966Selected
Doug AtkinsCleveland Browns; Chicago Bears; New Orleans Saints19531969Selected
Willie DavisCleveland Browns; Green Bay Packers19581969Finalist
Deacon JonesLos Angeles Rams; San Diego Chargers; Washington Redskins19611974Selected
Carl EllerMinnesota Vikings; Seattle Seahawks19641979Finalist
Jack YoungbloodLos Angeles Rams19711984Finalist
Lee Roy SelmonTampa Bay Buccaneers19761984Selected
Howie LongOakland/Los Angeles Raiders19811993Finalist
Reggie WhitePhiladelphia Eagles; Green Bay Packers; Carolina Panthers19852000Selected
Bruce SmithBuffalo Bills; Washington Redskins19852003Selected
Michael StrahanNew York Giants19932007Finalist
Julius PeppersCarolina Panthers; Chicago Bears; Green Bay Packers; Carolina Panthers20022018Finalist
DeMarcus WareDallas Cowboys; Denver Broncos20052016Finalist
J.J. WattHouston Texans20112019Finalist

White with a play that was not a penalty during his era.

For years, the defensive end position was a perfect place for a Mount Rushmore designation. While historians rarely agree on everything, many agreed that there were four defensive ends who separated themselves from every other player to play the position.

We begin with Colts great Gino Marchetti, who was a first-team All-Pro selection in 9 straight seasons from 1956 to 1964. He is one of the most decorated defensive players in league history, and had the ultimate respect of opposing coaches and players. Those who saw him had no question that he was the best defensive end of his time.

In 1969, a recently-retired Marchetti was named as the defensive end on the century on the NFL’s 50th anniversary team. In 1994, Marchetti was joined by Reggie White and Deacon Jones as the three defensive ends on the 75th anniversary team. Marchetti was the first true pass rusher in NFL history, coming to age in the 1950s as the passing game was becoming more specialized. He was a sack artist who was great against the run, making him about as perfect as it gets at defensive end. Marchetti was the rare first ballot Hall of Fame choice at the position, one of just five to earn that honor (the others being the other three members of DE Mt. Rushmore, and Jason Taylor, who was ignored by the 100th anniversary committee). [continue reading…]

{ 0 comments }

Drew Brees Has The Most Touchdowns In NFL History

Drew Brees had yet another remarkable game today. The 40-year-old threw five touchdown passes and rushed for another on a sneak from the 1-yard line. The future Hall of Famer has now thrown 537 touchdowns in his regular season career, rushed for another 23, and even caught one (from LaDainian Tomlinson back in 2003).

That gives Brees 561 career touchdowns, the most in regular season history.

Most career total touchdowns:

1. 561 – Brees (537 passing, 23 rushing, 1 receiving)
2. 558 – Tom Brady (536 passing, 22 rushing)
3. 557 – Peyton Manning (539 passing, 18 rushing)

Back in the 2018 offseason, I wrote that Brady and Brees were in a close race to dethrone Manning as the all-time career passing touchdowns king. Both players finished the 2015 season tied with 428 career touchdown passes. They finished the 2017 season tied again with 488 career touchdown passes. And after week 14 of the 2019 season, Brees is up on Brady 537-536. Brees is about year and a half younger than Brady, and is playing better this season; the odds are Brees will be the one who ultimately retires as the all-time passing touchdowns king. But it’s still a toss-up as to who breaks Manning’s record first, even if today Brees set a similar record that almost nobody noticed.

Coming up next: Brees and the Saints host the Colts on Monday Night Football in week 15, and Brees will be a strong favorite to throw passing touchdowns 539 and 540 in that game.  A home game on primetime? Yes, Brees will be gunning for the record books. That said, the Patriots face the Bengals the day before, and I wouldn’t put it past Brady to throw 4 touchdowns in that game, too, being the first to break the record.  This may turn into a McGwire/Sosa race after all.

{ 0 comments }

The goal of an NFL game is to win the game. If your opponent scores 17 points, you want to score 18 points, but anything more than 18 points is unnecessary. On the other hand, if you lose a game, all of the points you scored were unnecessary: losing 17-0 counts the same as losing 17-16.

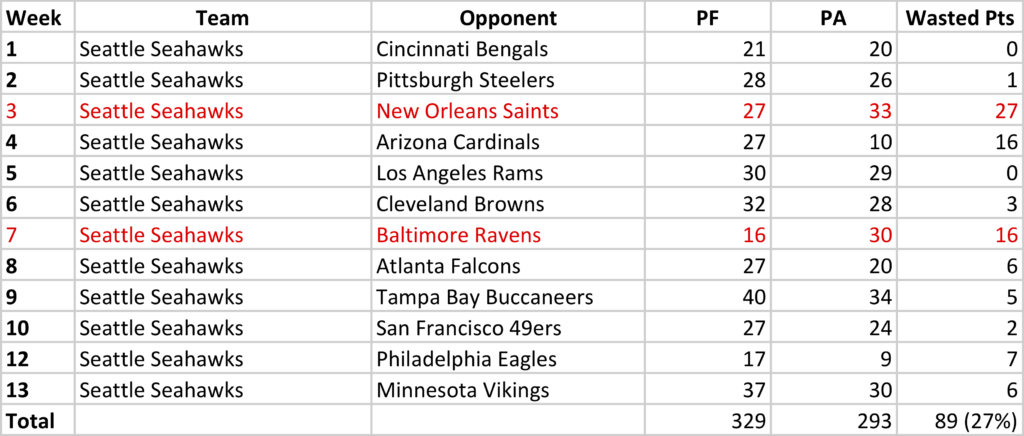
With that logic, most points in an NFL game are “wasted” or unnecessary points. The Bengals started the season 0-11, so all points scored by Cincinnati were wasted during that stretch. In the 12th game, when Cincinnati won 22-6, you could claim that 15 of the 22 points scored were wasted, too. That means 172 of the 179 points scored by the Bengals this year — or 96% — were wasted points. Said differently, Cincinnati could have scored 7 points this year, not 172, and if allocated correctly, have the same record.

For Seattle, it’s a different story. The Seahawks are 10-2 and have scored 329 points; the minimum number of points Seattle could have scored and still achieved a 10-2 record is 240 points, given how many points the team has allowed each week. That means only 27% of the Seahawks points this year have been “wasted” points:

The graph below shows all 32 teams in the NFL this season.  The X-Axis shows points per game; the Y-Axis shows the “wasted” points per game, based on the following formula:

  • In a win, all points scored after 1 point more than your opponent scored are wasted.  In a 20-17 victory, there are 2 wasted points.  In a 30-17 victory, there are 12 wasted points.
  • In a loss, all points scored are wasted points.
  • In a tie, since a tie is half a win, half of the points are wasted (i.e., you could have scored 0 points and had zero wins).

We can also look at this on a percentage basis. As you might suspect, the Bengals have wasted the highest percentage of their team’s points this year, at 96%, while the Seahawks have wasted the lowest percentage, at just 27%.

TeamPts per GameWasted Pts/GPerc
Cincinnati Bengals14.914.396%
Atlanta Falcons21.718.887%
New York Giants19.216.284%
Los Angeles Chargers20.314.973%
Detroit Lions23.317.073%
New England Patriots26.819.372%
Denver Broncos16.511.872%
Jacksonville Jaguars18.312.870%
Dallas Cowboys25.717.669%
Los Angeles Rams23.616.168%
Miami Dolphins16.711.368%
Washington Redskins14.49.868%
Cleveland Browns20.513.867%
Philadelphia Eagles22.815.266%
Tampa Bay Buccaneers28.318.465%
New York Jets17.010.964%
Arizona Cardinals21.313.563%
Baltimore Ravens33.820.862%
Carolina Panthers23.314.361%
Indianapolis Colts21.812.758%
San Francisco 49ers29.116.958%
Pittsburgh Steelers19.711.358%
Kansas City Chiefs29.015.955%
Chicago Bears18.710.053%
Minnesota Vikings26.614.153%
Buffalo Bills21.410.549%
Tennessee Titans23.011.249%
Oakland Raiders19.89.347%
Houston Texans24.410.945%
Green Bay Packers24.110.242%
New Orleans Saints24.87.831%
Seattle Seahawks27.47.427%

In its simplest terms, what we are solving for here is the fewest amount of points a team could have scored and still finished with the same record. And as it turns out, the Seahawks are historic outliers. Since 1970, the most “efficient” team at scoring was the 2016 Raiders. Oakland scored 416 points that season, and in 4 losses, scored 28, 13, 10, and 6 points for a total of 57 points. In the team’s 12 wins, the Raiders average margin of victory was only 6.67, which means only 5.67 points per game were wasted in wins, or 68 total. Overall, this means the Raiders wasted only 125 of the team’s 416 points; said differently, for the 2016 Raiders to go 12-4, given how many points they allowed in each game, the team needed to score at least 291 points. They actually scored 416, so the team only “wasted” 30% of their points. That’s the lowest of any team since 1970.

The table below shows the amount of wasted points by each team from 1970 to 2018.

RkTeamYearGWin%PtsWasted PtsWst Pts/GPerc
1OAK2016160.7504161257.830%
2RAI198290.889260839.231.9%
3TEN1999160.8133921378.634.9%
4PHI1993160.5002931066.636.2%
5PIT2004160.9383721368.536.6%
6GNB2011160.93856020512.836.6%
7IND2009160.8754161549.637%
8TAM198290.556158596.637.3%
9DAL2016160.8134211599.937.8%
10RAI1993160.6253061187.438.6%
11MIA2016160.6253631418.838.8%
12IND2006160.75042716710.439.1%
13CAR2015160.93850019712.339.4%
14HOU1978160.6252831127.039.6%
15TAM2005160.6883001197.439.7%
16DAL2018160.6253391358.439.8%
17SFO1990160.8753531418.839.9%
18CAR2003160.6883251308.140%
19IND2012160.6883571459.140.6%
20PIT2017160.81340616510.340.6%
21STL198290.556135556.140.7%
22IND1999160.81342317310.840.9%
23WAS198290.889190788.741.1%
24CHI1971140.429185765.441.1%
25CIN2003160.5003461438.941.3%
26NWE2013160.75044418511.641.7%
27CLE1980160.6883571499.341.7%
28LAR2018160.81352722013.841.7%
29CHI2010160.6883341408.841.9%
30STL1976140.7143091309.342.1%
31BUF1991160.81345819312.142.1%
32CLE1972140.7142681138.142.2%
33NWE2003160.8753481479.242.2%
34OAK1976140.92935014810.642.3%
35RAM1978160.7503161348.442.4%
36NYJ2013160.5002901237.742.4%
37ATL2010160.81341417611.042.5%
38BAL2010160.7503571529.542.6%
39KAN2016160.75038916610.442.7%
40CIN1981160.75042118011.342.8%
41ATL2017160.6253531519.442.8%
42DEN2015160.7503551529.542.8%
43ATL2004160.6883401469.142.9%
44ARI1996160.4383001298.143%
45HOU2016160.5632791207.543%
46HOU1979160.6883621569.843.1%
47CAR2017160.6883631579.843.3%
48MIA198290.778198869.643.4%
49SDG1987150.5332531107.343.5%
50NOR2009160.81351022313.943.7%
51NYG1994160.5632791227.643.7%
52OAK1974140.85735515611.143.9%
53DEN1985160.68838016810.544.2%
54OAK1980160.68836416110.144.2%
55JAX2005160.75036116010.044.3%
56DAL2007160.81345520212.644.4%
57DEN1986160.68837816810.544.4%
58GNB1989160.62536216110.144.5%
59RAI1984160.68836816410.344.6%
60PIT198290.6672049110.144.6%
61NYJ2010160.68836716410.344.7%
62ATL1998160.87544219812.444.8%
63NYG2016160.6883101398.744.8%
64GNB1970140.429196886.344.9%
65SDG2006160.87549222113.844.9%
66PIT2014160.68843619612.345%
67CLE2007160.62540218111.345%
68PHI2017160.81345720612.945.1%
69DET2016160.5633461569.845.1%
70MIA1985160.75042819312.145.1%
71DEN1996160.81339117711.145.3%
72ATL2012160.81341919011.945.3%
73DAL2014160.75046721213.345.4%
74NYG1986160.87537116910.645.6%
75DEN1998160.87550122914.345.7%
76DET2014160.6883211479.245.8%
77PHI1995160.6253181469.145.9%
78OAK1970140.6433001389.946%
79PHI2010160.62543920212.646%
80NOR2018160.81350423214.546%
81.5DAL2005160.5633251509.446.2%
81.5JAX1996160.5633251509.446.2%
83IND1995160.5633311539.646.2%
84STL1975140.78635616511.846.3%
85NYG1997160.656307142.58.946.4%
86ARI2014160.6883101449.046.5%
87PIT1997160.68837217310.846.5%
88MIA2005160.5633181489.346.5%
89SFO1970140.75035216411.746.6%
90KAN1986160.62535816710.446.6%
91.5ATL1978160.5632401127.046.7%
91.5STL1974140.7142851339.546.7%
93WAS1986160.75036817210.846.7%
94SFO1981160.81335716710.446.8%
95BAL1977140.7142951389.946.8%
96DAL1991160.68834216010.046.8%
97ATL2008160.68839118311.446.8%
98MIN2000160.68839718611.646.9%
99NYG2002160.6253201509.446.9%
100NYJ1986160.62536417110.747%
101NWE2011160.81351324115.147%
102SDG1994160.68838117911.247%
103GNB2002160.75039818711.747%
104CLE1971140.6432851349.647%
105CLE1986160.75039118411.547.1%
106NYG1970140.64330114210.147.2%
107SEA1988160.56333916010.047.2%
108WAS2012160.62543620612.947.2%
109SFO1989160.87544220913.147.3%
110DET1993160.6252981418.847.3%
111PHI2003160.75037417711.147.3%
112SFO2002160.62536717410.947.4%
113WAS1977140.643196936.647.4%
114RAI1990160.75033716010.047.5%
115DEN1991160.7503041459.147.7%
116BUF1995160.62535016710.447.7%
117STL2000160.62554025816.147.8%
119CIN2001160.3752261086.847.8%
119DET1991160.75033916210.147.8%
119PHI1979160.68833916210.147.8%
121TEN2006160.5003241559.747.8%
122NOR1987150.80042220213.547.9%
123STL2003160.75044721413.447.9%
124DEN1984160.81335316910.647.9%
125LAC2018160.75042820512.847.9%
126WAS2008160.5002651277.947.9%
127GNB1995160.68840419412.148%
128GNB1972140.71430414610.448%
129CAR2008160.75041419912.448.1%
130NOR2002160.56343220813.048.1%
131SDG2014160.56334816810.548.3%
132GNB1997160.81342220412.848.3%
133TAM1997160.6252991459.148.5%
134DEN2013160.81360629418.448.5%
135PHI1988160.62537918411.548.5%
136KAN1980160.5003191559.748.6%
137RAM1989160.68842620712.948.6%
138ARI1998160.5633251589.948.6%
139NYJ2001160.6253081509.448.7%
140IND2008160.75037718411.548.8%
141MIN1987150.53333616410.948.8%
142NWE2010160.87551825315.848.8%
143RAI1994160.5633031489.348.8%
144PIT2009160.56336818011.348.9%
145DEN2008160.50037018111.348.9%
146MIN1998160.93855627217.048.9%
147IND2003160.75044721913.749%
148BUF1998160.62540019612.349%
149OAK1977140.78635117212.349%
150DET1994160.56335717510.949%
151ATL1991160.62536117711.149%
152BUF1973140.6432591279.149%
153TEN2002160.68836718011.349%
154DAL1979160.68837118211.449.1%
155ATL1980160.75040519912.449.1%
156KAN1995160.81335817611.049.2%
157MIN2017160.81338218811.849.2%
158JAX1998160.68839219312.149.2%
159BUF1974140.6432641309.349.2%
160ATL2016160.68854026616.649.3%
161SEA1978160.56334517010.649.3%
162SDG2009160.81345422414.049.3%
163KAN1993160.68832816210.149.4%
164SEA2016160.65635417510.949.4%
165NWE1978160.68835817711.149.4%
166IND1990160.4382811398.749.5%
167JAX1997160.68839419512.249.5%
168TEN2007160.6253011499.349.5%
169NYG1990160.81333516610.449.6%
170WAS1987150.73337918812.549.6%
171CIN1986160.62540920312.749.6%
172MIA2001160.68834417110.749.7%
173NWE1996160.68841820813.049.8%
174NYJ1974140.5002791399.949.8%
175WAS1985160.6252971489.349.8%
176SEA2001160.5633011509.449.8%
177IND2015160.50033316610.449.8%
178MIA2008160.68834517210.849.9%
179JAX2010160.50035317611.049.9%
180DAL1981160.75036718311.449.9%
182.5HOU2012160.75041620813.050%
182.5ATL2011160.62540220112.650%
182.5RAI1985160.75035417711.150%
182.5BAL1983160.4382641328.350%
185SEA1983160.56340320212.650.1%
186DAL1977140.85734517312.450.1%
187MIN1996160.5632981509.450.3%
188JAX2009160.4382901469.150.3%
189MIA1994160.62538919612.350.4%
190BUF1988160.75032916610.450.5%
191NYJ2000160.56332116210.150.5%
192ARI2001160.4382951499.350.5%
193SEA1979160.56337819111.950.5%
194PIT1977140.64328314310.250.5%
195OAK1981160.4382731388.650.5%
196PHI2009160.68842921713.650.6%
197NYG2008160.75042721613.550.6%
198KAN2017160.62541521013.150.6%
199GNB2014160.75048624615.450.6%
200DEN2014160.75048224415.350.6%
201BAL1970140.821321162.511.650.6%
202WAS1983160.87554127417.150.6%
203KAN1997160.81337519011.950.7%
204ARI2015160.81348924815.550.7%
205KAN2006160.56333116810.550.8%
206NWE2007161.00058929918.750.8%
207NWE2016160.87544122414.050.8%
208PIT1978160.87535618111.350.8%
209PIT1995160.68840720712.950.9%
210MIN1999160.62539920312.750.9%
211BUF1983160.5002831449.050.9%
212DAL1983160.75047924415.350.9%
213JAX2004160.5632611338.351%
214MIN2015160.68836518611.651%
215HOU2018160.68840220512.851%
216OAK1971140.643344175.512.551%
217PIT2002160.65639019912.451%
218WAS2015160.56338819812.451%
219GNB1983160.50042921913.751%
220BUF1993160.75032916810.551.1%
221MIN1977140.6432311188.451.1%
222DAL1972140.71431916311.651.1%
223CIN1988160.75044822914.351.1%
224DEN2000160.68848524815.551.1%
225RAM1984160.62534617711.151.2%
226.5SFO1997160.81337519212.051.2%
226.5OAK1975140.78637519213.751.2%
228TEN2003160.75043522313.951.3%
229PHI2004160.81338619812.451.3%
230BAL2011160.75037819412.151.3%
231PHI1971140.464221113.58.151.4%
232NWE1985160.68836218611.651.4%
233SDG1995160.56332116510.351.4%
234MIN1994160.62535618311.451.4%
235MIN1997160.56335418211.451.4%
236MIN1976140.82130515711.251.5%
237TEN2017160.56333417210.851.5%
238NYG2011160.56339420312.751.5%
239BUF1980160.68832016510.351.6%
240MIN2005160.5633061589.951.6%
241NWE2004160.87543722614.151.7%
242SDG198290.66728814916.651.7%
243CLE2002160.56334417811.151.7%
244CIN1973140.71428614810.651.7%
245CIN2009160.6253051589.951.8%
246BUF1979160.4382681398.751.9%
247MIN198290.5561879710.851.9%
248TAM2010160.62534117711.151.9%
249MIA1972141.00038520014.351.9%
250SFO2013160.75040621113.252%
251NOR2004160.50034818111.352%
252CHI2001160.81333817611.052.1%
253DET1985160.43830716010.052.1%
254NWE1976140.78637619614.052.1%
255.5PIT2016160.68839920813.052.1%
255.5OAK2001160.62539920813.052.1%
257SDG2004160.75044623314.652.2%
258KAN2003160.81348425315.852.3%
259MIA1974140.78632717112.252.3%
260BUF2017160.5633021589.952.3%
261DET1974140.5002561349.652.3%
262KAN2018160.75056529618.552.4%
263DEN2011160.50030916210.152.4%
264SEA2005160.81345223714.852.4%
265MIA1999160.56332617110.752.5%
266MIA1981160.71934518111.352.5%
267.5MIN2012160.62537919912.452.5%
267.5MIN2008160.62537919912.452.5%
269NYJ1979160.50033717711.152.5%
270ARI2011160.50031216410.352.6%
271NOR1994160.43834818311.452.6%
272RAM1985160.68834017911.252.6%
273MIN1980160.56331716710.452.7%
274DAL1976140.78629615611.152.7%
275GNB2015160.62536819412.152.7%
276CIN2014160.656365192.512.052.7%
277CIN2013160.68843022714.252.8%
278TEN2008160.81337519812.452.8%
279CHI1987150.73335618812.552.8%
280PHI1987150.46733717811.952.8%
281CHI1991160.6882991589.952.8%
282IND2005160.87543923214.552.8%
283GNB2007160.81343523014.452.9%
284IND2007160.81345023814.952.9%
285SDG1996160.50031016410.352.9%
286CLE1979160.56335919011.952.9%
287.5SFO2014160.50030616210.152.9%
287.5IND2013160.68839120712.952.9%
289CLE1988160.62530416110.153%
290.5DEN1983160.56330216010.053%
290.5KAN1971140.75030216011.453%
292GNB2013160.53141722113.853%
293MIA1980160.5002661418.853%
294TEN2016160.56338120212.653%
295IND1988160.56335418811.853.1%
296NWE1998160.56333717911.253.1%
297SFO1988160.62536919612.353.1%
298PIT2001160.81335218711.753.1%
299DAL1975140.71435018613.353.1%
300WAS2016160.531396210.513.253.2%
301SFO2011160.81338020212.653.2%
302NYJ2006160.62531616810.553.2%
303RAI1983160.75044223514.753.2%
304CIN2011160.56334418311.453.2%
305PHI1989160.68834218211.453.2%
306RAI1986160.50032317210.853.3%
307BAL2006160.81335318811.853.3%
308SFO1984160.93847525315.853.3%
309NWE1994160.62535118711.753.3%
310.5MIA2013160.50031716910.653.3%
310.5IND1996160.56331716910.653.3%
312.5HOU1987150.60034518412.353.3%
312.5CHI1977140.6432551369.753.3%
314.5NOR2000160.62535418911.853.4%
314.5HOU1974140.5002361269.053.4%
316NYG1980160.2502491338.353.4%
317SEA2006160.56333517911.253.4%
318SFO1998160.75047925616.053.4%
319CIN198290.77823212413.853.4%
320ARI2007160.50040421613.553.5%
321MIA1992160.68834018211.453.5%
322.5SDG2013160.56339621213.353.5%
322.5KAN1996160.5632971599.953.5%
324.5NWE2015160.75046524915.653.5%
324.5DEN1980160.50031016610.453.5%
326IND2010160.62543523314.653.6%
327HOU1975140.71429315711.253.6%
328BUF1996160.62531917110.753.6%
329NOR2010160.68838420612.953.6%
330ATL2015160.50033918211.453.7%
331CIN2015160.75041922514.153.7%
332CHI2000160.3132161167.353.7%
333SEA1995160.50036319512.253.7%
334NOR2011160.81354729418.453.7%
335CIN1975140.78634018313.153.8%
336NYJ2008160.56340521813.653.8%
337.5GNB2001160.75039021013.153.8%
337.5PIT1992160.68829916110.153.8%
339ARI2009160.62537520212.653.9%
340MIA1990160.75033618111.353.9%
341SFO2007160.3132191187.453.9%
342CLE1978160.50033418011.353.9%
343HOU1980160.6882951599.953.9%
344DEN2005160.81339521313.353.9%
345PHI2014160.62547425616.054%
346CIN1996160.50037220112.654%
347MIN1979160.4382591408.854.1%
348NWE2002160.56338120612.954.1%
349PHI2000160.68835119011.954.1%
350.5GNB2016160.62543223414.654.2%
350.5GNB1998160.68840822113.854.2%
352SFO1987150.86745924916.654.2%
353PHI1996160.62536319712.354.3%
354GNB2012160.68843323514.754.3%
355MIA1997160.56333918411.554.3%
356OAK1978160.56331116910.654.3%
357GNB1992160.5632761509.454.3%
358PHI1991160.6252851559.754.4%
359CIN2005160.68842122914.354.4%
360STL2001160.87550327417.154.5%
361HOU1989160.56336519912.454.5%
362PHI2013160.62544224115.154.5%
363CHI2006160.81342723314.654.6%
364ARI2017160.50029516110.154.6%
365MIA1984160.87551328017.554.6%
366GNB1976140.3572181198.554.6%
367CHI2013160.50044524315.254.6%
368IND1992160.5632161187.454.6%
369DEN1979160.6252891589.954.7%
370NWE2017160.81345825115.754.8%
371NOR1983160.50031917510.954.9%
372OAK2015160.43835919712.354.9%
373CHI1990160.68834819111.954.9%
374RAM1980160.68842423314.655%
375ATL1995160.56336219912.455%
376STL2015160.4382801549.655%
377DET1972140.607339186.513.355%
378KAN1972140.57128715811.355.1%
379.5STL2002160.43831617410.955.1%
379.5BAL2002160.43831617410.955.1%
381MIN1973140.85729616311.655.1%
382CLE1989160.59433418411.555.1%
383CHI1986160.87535219412.155.1%
384.5MIA2018160.43831917611.055.2%
384.5CIN2017160.43829016010.055.2%
386CAR2013160.75036620212.655.2%
387BUF1981160.62531117210.855.3%
388WAS1978160.5002731519.455.3%
389DAL1994160.75041422914.355.3%
390DAL2012160.50037620813.055.3%
391BUF1992160.68838121113.255.4%
392DAL1995160.75043524115.155.4%
393OAK2011160.50035919912.455.4%
394SFO1992160.87543123914.955.5%
395CHI2008160.56337520813.055.5%
396DEN1977140.85727415210.955.5%
397NWE2018160.68843624215.155.5%
398NWE2001160.68837120612.955.5%
399.5NWE2014160.75046826016.355.6%
399.5CLE1973140.5712341309.355.6%
401BUF1990160.81342823814.955.6%
402STL1983160.53137420813.055.6%
403GNB2017160.43832017811.155.6%
404SFO1994160.81350528117.655.6%
405NOR2016160.43846926116.355.7%
406WAS1976140.71429116211.655.7%
407BUF2002160.50037921113.255.7%
408PIT2011160.75032518111.355.7%
409ATL1986160.4692801569.855.7%
410DEN2012160.81348126816.855.7%
411.5IND2004160.75052229118.255.7%
411.5NYG1989160.75034819412.155.7%
413DEN1981160.62532117911.255.8%
414BAL2012160.62539822213.955.8%
415NYG2000160.75032818311.455.8%
416GNB1978160.5312491398.755.8%
417GNB1981160.50032418111.355.9%
418BUF2000160.50031517611.055.9%
419IND2002160.62534919512.255.9%
420GNB2004160.62542423714.855.9%
421PIT1974140.750305170.512.255.9%
422DET2011160.62547426516.655.9%
423PIT1983160.62535519912.456.1%
424DEN1987150.700379212.514.256.1%
425KAN1988160.281254142.58.956.1%
426NOR2015160.43840822914.356.1%
427NYG1984160.56329916810.556.2%
428DEN1973140.57135419914.256.2%
429WAS1972140.78633618913.556.3%
430NOR2013160.68841423314.656.3%
431WAS1975140.57132518313.156.3%
432BAL1976140.78641723516.856.4%
433KAN1984160.50031417711.156.4%
434MIN2009160.75047026516.656.4%
435DAL2003160.62528916310.256.4%
436SDG2002160.50033318811.856.5%
437NOR2017160.68844825315.856.5%
438DAL1992160.81340923114.456.5%
439NYG1975140.3572161228.756.5%
440SFO1996160.75039822514.156.5%
441SEA2018160.62542824215.156.5%
442CLE1976140.64326715110.856.6%
443OAK1972140.750365206.514.856.6%
444DAL1985160.62535720212.656.6%
445NYJ2015160.62538721913.756.6%
446NYG1993160.68828816310.256.6%
447NWE2006160.75038521813.656.6%
448NWE1984160.56336220512.856.6%
449.5CAR2006160.5002701539.656.7%
449.5TAM1999160.6882701539.656.7%
451IND1994160.50030717410.956.7%
452WAS1971140.679276156.511.256.7%
453KAN1994160.56331918111.356.7%
454NYJ2004160.62533318911.856.8%
455WAS1981160.50034719712.356.8%
456TAM2008160.56336120512.856.8%
457SEA1999160.56333819212.056.8%
458.5NYJ1999160.50030817510.956.8%
458.5DAL1984160.56330817510.956.8%
460DET1999160.50032218311.456.8%
461CHI1995160.56339222313.956.9%
462OAK2002160.68845025616.056.9%
463DAL1990160.4382441398.757%
464NOR1992160.75033018811.857%
465ARI2013160.62537921613.557%
466NYG1971140.2862281309.357%
467JAX1999160.87539622614.157.1%
468NYG2005160.68842224115.157.1%
469GNB2006160.50030117210.857.1%
470KAN1990160.68836921113.257.2%
471TEN2000160.81334619812.457.2%
472MIN1981160.43832518611.657.2%
473WAS1989160.62538622113.857.3%
474SEA1989160.4382411388.657.3%
475MIN1983160.50031618111.357.3%
476PHI1990160.62539622714.257.3%
477DAL1987150.46734019513.057.4%
478PIT1989160.5632651529.557.4%
479OAK2009160.3131971137.157.4%
480PIT2015160.62542324315.257.4%
481KAN1991160.62532218511.657.5%
482RAM1973140.85738822315.957.5%
483PHI2018160.56336721113.257.5%
484PHI2006160.62539822914.357.5%
485PIT1987150.53328516410.957.5%
486OAK2000160.75047927617.357.6%
487SFO1983160.62543224915.657.6%
488HOU1996160.50034519912.457.7%
489NOR1988160.62531218011.357.7%
490SFO2001160.75040923614.857.7%
491.5CIN1997160.43835520512.857.7%
491.5HOU1985160.31328416410.357.7%
493WAS1979160.62534820112.657.8%
494STL2006160.50036721213.357.8%
495MIN2004160.50040523414.657.8%
496CIN1980160.3752441418.857.8%
497RAM1974140.71426315210.957.8%
498OAK2017160.37530117410.957.8%
499NWE1991160.3752111227.657.8%
500CLE2014160.43829917310.857.9%
501KAN1989160.53131818411.557.9%
502MIA2003160.62531118011.357.9%
503CIN2018160.37536821313.357.9%
504CLE2001160.43828516510.357.9%
505PHI1992160.68835420512.857.9%
506SDG1992160.68833519412.157.9%
507PIT1994160.75031618311.457.9%
508NYG1988160.62535920813.057.9%
509WAS1997160.531327189.511.858%
510TAM1990160.3752641539.658%
511DEN2016160.56333319312.158%
512STL2004160.50031918511.658%
513NYG1991160.50028116310.258%
514DAL2008160.56336221013.158%
515DET1995160.62543625315.858%
516GNB2000160.56335320512.858.1%
517MIA1983160.75038922614.158.1%
518DEN1974140.536302175.512.558.1%
519CHI198290.333141829.158.2%
520TEN1998160.50033019212.058.2%
521WAS2001160.5002561499.358.2%
522BAL1975140.71439523016.458.2%
523MIA1970140.71429717312.458.2%
524SEA2013160.81341724315.258.3%
525PIT2018160.594428249.515.658.3%
526DET2000160.56330717911.258.3%
527NWE2005160.62537922113.858.3%
528CAR2005160.68839122814.358.3%
529KAN2005160.62540323514.758.3%
530CHI2011160.50035320612.958.4%
531ARI1999160.3752451438.958.4%
532DAL1980160.75045426516.658.4%
533MIN1974140.71431018112.958.4%
534ATL1971140.53627416011.458.4%
535DEN1992160.5002621539.658.4%
536CIN1977140.5712381399.958.4%
537PHO1988160.43834420112.658.4%
538TEN2011160.56332519011.958.5%
539TEN2012160.37533019312.158.5%
540KAN2011160.4382121247.858.5%
541PIT2008160.75034720312.758.5%
542HOU2009160.56338822714.258.5%
543BUF1994160.43834019912.458.5%
544STL1995160.43830918111.358.6%
545CAR1996160.75036721513.458.6%
546STL1984160.56342324815.558.6%
547DET2015160.43835821013.158.7%
548SFO2012160.71939723314.658.7%
549ARI1994160.5002351388.658.7%
550NYJ1988160.531372218.513.758.7%
551MIA1993160.56334920512.858.7%
552IND2000160.62542925215.858.7%
553SEA1986160.62536621513.458.7%
554SEA2004160.56337121813.658.8%
555ATL2001160.43829117110.758.8%
556CAR2007160.4382671579.858.8%
557HOU1991160.68838622714.258.8%
558SDG1980160.68841824615.458.9%
559NOR2001160.43833319612.358.9%
560SEA1997160.50036521513.458.9%
561WAS1999160.62544326116.358.9%
562.5BUF2008160.43833619812.458.9%
562.5DEN2002160.56339223114.458.9%
564CHI2012160.62537522113.858.9%
565LAR2017160.68847828217.659%
566RAM1983160.56336121313.359%
567OAK1998160.50028817010.659%
568DEN1975140.42925415010.759.1%
569BAL2001160.62530317911.259.1%
570CIN2012160.62539123114.459.1%
571PHI1985160.43828616910.659.1%
572DAL1971140.78640624017.159.1%
573IND2018160.62543325616.059.1%
574CHI2018160.75042124915.659.1%
575ATL1983160.43837021913.759.2%
576KAN1992160.62534820612.959.2%
577NWE2012160.75055733020.659.2%
578MIN1989160.62535120813.059.3%
579NWE2008160.68841024315.259.3%
580GNB198290.61122613414.959.3%
581TAM2016160.56335421013.159.3%
582TAM1979160.62527316210.159.3%
583TEN2018160.56331018411.559.4%
584PIT1980160.56335220913.159.4%
585PHI2015160.43837722414.059.4%
586WAS1988160.43834520512.859.4%
587SEA2002160.43835521113.259.4%
588NWE198290.556143859.459.4%
589SEA1990160.56330618211.459.5%
590.5BUF2007160.4382521509.459.5%
590.5BUF1975140.57142025017.959.5%
592DET1971140.53634120314.559.5%
593KAN2010160.62536621813.659.6%
594MIN2018160.531360214.513.459.6%
595MIA1996160.50033920212.659.6%
596TEN2009160.50035421113.259.6%
597.5CHI2005160.6882601559.759.6%
597.5PIT1979160.75041624815.559.6%
599SDG1981160.62547828517.859.6%
600SFO1986160.65637422313.959.6%
601CHI2009160.43832719512.259.6%
602SFO1980160.37532019111.959.7%
603CIN1990160.56336021513.459.7%
604TAM1996160.3752211328.359.7%
605SDG1988160.3752311388.659.7%
606DET2013160.43839523614.859.7%
607DAL1996160.62528617110.759.8%
608MIN1972140.50030118012.959.8%
609TEN2001160.43833620112.659.8%
610IND2014160.68845827417.159.8%
611.5DEN2004160.62538122814.359.8%
611.5DEN2003160.62538122814.359.8%
613NWE1999160.50029917911.259.9%
614NYJ2002160.56335921513.459.9%
615CIN2004160.50037422414.059.9%
616SDG1974140.3572121279.159.9%
617CLE1985160.50028717210.859.9%
618STL1987150.46736221714.559.9%
619SDG1985160.50046728017.560%
620BAL2013160.50032019212.060%
621NYG2007160.62537322414.060.1%
622SDG1983160.37535821513.460.1%
623NWE1971140.42923814310.260.1%
624WAS1984160.68842625616.060.1%
625DAL1993160.75037622614.160.1%
626KAN1970140.571272163.511.760.1%
627MIN1991160.50030118111.360.1%
628NYG2012160.56342925816.160.1%
629GNB1990160.37527116310.260.1%
630MIN1992160.68837422514.160.2%
631WAS2005160.62535921613.560.2%
632SEA1985160.50034921013.160.2%
633TAM2001160.56332419512.260.2%
634DEN1989160.68836221813.660.2%
635.5SEA1996160.43831719111.960.3%
635.5NOR1993160.50031719111.960.3%
637.5DEN2001160.50034020512.860.3%
637.5STL1977140.50027216411.760.3%
639BUF1999160.68832019312.160.3%
640NWE1980160.62544126616.660.3%
641MIA2000160.68832319512.260.4%
642RAM1971140.60731318913.560.4%
643DAL2009160.68836121813.660.4%
644STL1985160.31327816810.560.4%
645NYJ1987150.40033420213.560.5%
646GNB1999160.50035721613.560.5%
647NYJ1991160.50031419011.960.5%
648STL2012160.46929918111.360.5%
649NYJ1998160.75041625215.860.6%
650JAX2007160.68841124915.660.6%
651DEN2007160.43832019412.160.6%
652WAS1990160.62538123114.460.6%
653MIN2006160.37528217110.760.6%
654ATL1979160.37530018211.460.7%
655NWE1986160.68841225015.660.7%
656RAM1979160.56332319612.360.7%
657KAN2015160.68840524615.460.7%
658KAN1999160.56339023714.860.8%
659CAR2012160.43835721713.660.8%
660WAS1991160.87548529518.460.8%
661NYJ1984160.43833220212.660.8%
662BAL2004160.56331719312.160.9%
663CAR2018160.43837622914.360.9%
664SEA2014160.75039424015.060.9%
665SEA1987150.60037122615.160.9%
666HOU2008160.50036622313.960.9%
667MIA1973140.85734320914.960.9%
668.5SDG2005160.56341825515.961%
668.5SEA1984160.75041825515.961%
670PIT2010160.75037522914.361.1%
671NYJ1985160.68839324015.061.1%
672KAN2004160.43848329518.461.1%
673NYJ2016160.31327516810.561.1%
674OAK1979160.56336522313.961.1%
675MIA2009160.43836022013.861.1%
676RAM1986160.62530918911.861.2%
677NWE1988160.5632501539.661.2%
678SEA2017160.56336622414.061.2%
679MIN1978160.53129418011.361.2%
680MIN2014160.43832519912.461.2%
681NOR2006160.62541325315.861.3%
682RAI1989160.50031519312.161.3%
683NYJ1978160.50035922013.861.3%
684SFO1971140.64330018413.161.3%
685.5BAL1998160.37526916510.361.3%
685.5ATL1972140.50026916511.861.3%
687TAM2000160.62538823814.961.3%
688MIA1975140.71435721915.661.3%
689WAS2007160.56333420512.861.4%
690MIN1995160.50041225315.861.4%
691NYJ1981160.65635521813.661.4%
692DAL2004160.37529318011.361.4%
693SDG1993160.50032219812.461.5%
694CLE1993160.43830418711.761.5%
695PHI2001160.68834321113.261.5%
696IND2016160.50041125315.861.6%
697BUF1997160.3752551579.861.6%
698CHI1985160.93845628117.661.6%
699CHI1994160.56327116710.461.6%
700NYJ1983160.43831319312.161.7%
701SDG1978160.56335521913.761.7%
702RAM1981160.37530318711.761.7%
703ATL198290.55618311312.661.7%
704TAM1994160.3752511559.761.8%
705.5TAM1995160.4382381479.261.8%
705.5CLE1992160.43827216810.561.8%
707PHI1973140.393310191.513.761.8%
708HOU1988160.62542426216.461.8%
709KAN1974140.35723314410.361.8%
710MIN1975140.85737723316.661.8%
711GNB2018160.406376232.514.561.8%
712SDG1970140.464282174.512.561.9%
713MIA2017160.37528117410.961.9%
714SFO2017160.37533120512.861.9%
715DET2017160.56341025415.962%
716ATL2006160.43829218111.362%
717CAR1999160.50042126116.362%
718NOR1997160.3752371479.262%
719DET1978160.43829018011.362.1%
720WAS1996160.56336422614.162.1%
721CIN1976140.71433520814.962.1%
722KAN2013160.68843026716.762.1%
723.5BUF1987150.46727016811.262.2%
723.5TAM1981160.56331519612.362.2%
725NWE1995160.37529418311.462.2%
726WAS1995160.37532620312.762.3%
727HOU1981160.43828117510.962.3%
728STL2010160.43828918011.362.3%
729DEN1997160.75047229418.462.3%
730ARI2008160.56342726616.662.3%
731OAK1999160.50039024315.262.3%
732NWE1997160.62536923014.462.3%
733IND1987150.60030018712.562.3%
734BAL2008160.68838524015.062.3%
735NYJ1997160.56334821713.662.4%
736SFO1995160.68845728517.862.4%
737NOR1990160.50027417110.762.4%
738SDG1999160.50026916810.562.5%
739BAL2000160.75033320813.062.5%
741HOU1992160.62535222013.862.5%
741DET1989160.43831219512.262.5%
741SDG1976140.42924815511.162.5%
743.5CAR2009160.50031519712.362.5%
743.5STL1981160.43831519712.362.5%
745CHI2007160.43833420913.162.6%
746GNB1985160.50033721113.262.6%
747PIT1972140.78634321515.462.7%
748TAM1984160.37533521013.162.7%
749NYG2010160.62539424715.462.7%
750NYG1998160.50028718011.362.7%
751MIA1979160.62534121413.462.8%
752CLE2018160.469359225.514.162.8%
753CIN1984160.50033921313.362.8%
754OAK1973140.679292183.513.162.8%
755.5DET1975140.50024515411.062.9%
755.5MIA1971140.75031519814.162.9%
757CLE1983160.56335622414.062.9%
758NOR1989160.56338624315.263%
759BUF2014160.56334321613.563%
760MIN2003160.56341626216.463%
761WAS2000160.50028117711.163%
762MIN2016160.50032720612.963%
763MIA2010160.43827317210.863%
764HOU1993160.75036823214.563%
765.5PIT2012160.50033621213.363.1%
765.5PHI2007160.50033621213.363.1%
767SEA2012160.68841226016.363.1%
768OAK2004160.31332020212.663.1%
769PHI2002160.75041526216.463.1%
770DAL2002160.3132171378.663.1%
771CHI1988160.75031219712.363.1%
772BAL2003160.62539124715.463.2%
773NYG1999160.43829918911.863.2%
774PIT2005160.68838924615.463.2%
775RAM1976140.75035122215.963.2%
776SDG1979160.75041126016.363.3%
777KAN1981160.56334321713.663.3%
778PIT1984160.56338724515.363.3%
779MIA1988160.37531920212.663.3%
780NOR2014160.43840125415.963.3%
781KAN2000160.43835522514.163.4%
782PIT1973140.71434722015.763.4%
783RAI1991160.56329818911.863.4%
784ATL2002160.59440225515.963.4%
785MIA1989160.50033121013.163.4%
786PIT1998160.43826316710.463.5%
787DEN1993160.56337323714.863.5%
788DAL1978160.75038424415.363.5%
789NOR198290.444129829.163.6%
790MIN1970140.85733521315.263.6%
791MIN2002160.37539024815.563.6%
792PHI1999160.31327217310.863.6%
793CHI1981160.37525316110.163.6%
794NYJ1971140.4292121359.663.7%
795NYG2009160.50040225616.063.7%
796MIN2010160.37528117911.263.7%
797SFO2008160.43833921613.563.7%
798CIN1985160.43844128117.663.7%
799KAN2014160.56335322514.163.7%
800ATL1997160.43832020412.863.8%
801BAL2018160.62538924815.563.8%
802NOR1984160.43829819011.963.8%
803ATL2018160.43841426416.563.8%
804KAN1976140.35729018513.263.8%
805CHI1975140.2861911228.763.9%
806BAL1999160.50032420712.963.9%
807CIN1995160.43834922313.963.9%
808MIN1993160.56327717711.163.9%
809NOR1971140.35726617012.163.9%
810BAL1980160.43835522714.263.9%
811DAL2011160.50036923614.864%
812CHI1999160.37527217410.964%
813DAL1974140.57129719013.664%
814SDG2012160.43835022414.064%
815BAL1978160.3132391539.664%
816PHI1997160.40631720312.764%
817SDG2011160.50040626016.364%
818BUF2004160.56339525315.864.1%
819CHI1979160.62530619612.364.1%
820TAM1989160.31332020512.864.1%
821PIT1975140.85737323917.164.1%
822SFO2006160.43829819111.964.1%
823PIT2013160.50037924315.264.1%
824MIN1985160.43834622213.964.2%
825CAR2000160.43831019912.464.2%
826SDG2008160.50043928217.664.2%
827HOU2014160.56337223914.964.2%
828SDG1998160.3132411559.764.3%
829.5CAR2002160.43825816610.464.3%
829.5PHO1989160.31325816610.464.3%
831MIA1987150.53336223315.564.4%
832WAS1974140.71432020614.764.4%
833SDG1977140.50022214310.264.4%
834DAL2013160.50043928317.764.5%
835MIN1971140.78624515811.364.5%
836WAS2002160.43830719812.464.5%
837STL1978160.37524816010.064.5%
838TAM2012160.43838925115.764.5%
839CHI1993160.4382341519.464.5%
840MIA1977140.71431320214.464.5%
841SEA2003160.62540426116.364.6%
842PIT1993160.56330819912.464.6%
843SEA2007160.62539325415.964.6%
844.5DET2007160.43834622414.064.7%
844.5TAM2002160.75034622414.064.7%
846NOR1978160.43828118211.464.8%
847NYG2006160.50035523014.464.8%
848PHI1978160.56327017510.964.8%
849OAK2018160.25029018811.864.8%
850RAM1992160.37531320312.764.9%
851SFO1991160.62539325515.964.9%
852SFO1993160.62547330719.264.9%
853HOU2007160.50037924615.464.9%
854RAM1970140.67932521115.164.9%
855GNB1977140.286134876.264.9%
856MIN2007160.50036523714.864.9%
857STL2013160.43834822614.164.9%
858NYG1972140.57133121515.465%
859ATL2005160.50035122814.365%
860NYG2001160.43829419111.965%
861KAN1985160.37531720612.965%
862.5KAN2001160.37532020813.065%
862.5CLE1994160.68834022113.865%
864CIN1999160.25028318411.565%
865BAL1997160.40632621213.365%
866MIA1998160.62532120913.165.1%
867NYJ1972140.50036723917.165.1%
868KAN1998160.43832721313.365.1%
869NYJ1994160.37526417210.865.2%
870GNB2003160.62544228818.065.2%
871BUF1972140.321257167.512.065.2%
872.5DEN2006160.56331920813.065.2%
872.5NOR1995160.43831920813.065.2%
874STL1973140.321286186.513.365.2%
875CLE1981160.31327618011.365.2%
876NOR2008160.50046330218.965.2%
877ATL2007160.25025916910.665.3%
878BAL2016160.50034322414.065.3%
879NYG2018160.31336924115.165.3%
880CAR2004160.43835523214.565.4%
881PHI1980160.75038425115.765.4%
882CHI2004160.3132311519.465.4%
883CHI2003160.43828318511.665.4%
884CLE1970140.50028618713.465.4%
885ARI2010160.31328918911.865.4%
886MIN2013160.34439125616.065.5%
887DAL2010160.37539425816.165.5%
888PHI2005160.37531020312.765.5%
889TAM2015160.37534222414.065.5%
890MIN2001160.31329019011.965.5%
891JAX2013160.25024716210.165.6%
892DEN1978160.62528218511.665.6%
893NYJ1989160.25025316610.465.6%
894PHI1984160.406278182.511.465.6%
895NWE1989160.31329719512.265.7%
896CIN1970140.57131220514.665.7%
897.5GNB2010160.62538825515.965.7%
897.5DEN1995160.50038825515.965.7%
899ATL1973140.64331820914.965.7%
900KAN2002160.50046730719.265.7%
901DET198290.44418111913.265.7%
902BAL2014160.62540926916.865.8%
903PIT1988160.31333622113.865.8%
904NWE1977140.64327818313.165.8%
905NYG2003160.25024316010.065.8%
906PIT1971140.42924616211.665.9%
907.5NOR2003160.50034022414.065.9%
907.5GNB1993160.56334022414.065.9%
909HOU1990160.56340526716.765.9%
910ATL1999160.31328518811.866%
911DEN1976140.64331520814.966%
912WAS1993160.2502301529.566.1%
913GNB1973140.429202133.59.566.1%
914SEA1998160.50037224615.466.1%
915DAL1998160.62538125215.866.1%
916CLE1987150.66739025817.266.2%
917BUF1989160.56340927116.966.3%
918SEA1977140.35728218713.466.3%
919STL1996160.37530320112.666.3%
920RAM1975140.85731220714.866.3%
921SFO2015160.3132381589.966.4%
922NYG198290.44416410912.166.5%
923GNB1987150.367255169.511.366.5%
924DAL1999160.50035223414.666.5%
925BUF2015160.50037925215.866.5%
926CAR2014160.469339225.514.166.5%
927PHI1983160.3132331559.766.5%
928ARI1995160.25027518311.466.5%
929PHI1994160.43830820512.866.6%
930TAM1998160.50031420913.166.6%
931NYJ2011160.50037725115.766.6%
933SEA2011160.43832121413.466.7%
933ARI2000160.1882101408.866.7%
933DET1977140.4291831228.766.7%
935.5SDG2007160.68841227517.266.7%
935.5ATL1970140.357206137.59.866.7%
937SDG1984160.43839426316.466.8%
938SEA1981160.37532221513.466.8%
939IND1989160.50029819912.466.8%
940NYG1981160.56329519712.366.8%
941PIT1991160.43829219512.266.8%
942.5PHI1986160.34425617110.766.8%
942.5CHI1970140.42925617112.266.8%
944CLE2006160.2502381599.966.8%
945CLE2005160.3752321559.766.8%
946STL1972140.3211931299.266.8%
947DEN1999160.37531421013.166.9%
948JAX2008160.31330220212.666.9%
949WAS2018160.43828118811.866.9%
950CLE1977140.42926918012.966.9%
951HOU2010160.37539026116.366.9%
952MIA1978160.68837224915.666.9%
953STL2005160.37536324315.266.9%
954NYG2013160.43829419712.367%
955DET1997160.56337925415.967%
956LAC2017160.56335523814.967%
957BAL2015160.31332822013.867.1%
958WAS1973140.71432521815.667.1%
959CLE2010160.31327118211.467.2%
960DEN2018160.37532922113.867.2%
961ARI2006160.31331421113.267.2%
962DAL2017160.56335423814.967.2%
963NYJ2012160.37528118911.867.3%
964DET1990160.37537325115.767.3%
965IND2001160.37541327817.467.3%
966PHI1974140.50024216311.667.4%
967NWE1979160.56341127717.367.4%
968SEA2010160.43831020913.167.4%
969DEN1994160.43834723414.667.4%
970PIT1996160.62534423214.567.4%
971NYJ2017160.31329820112.667.4%
972HOU2011160.62538125716.167.5%
973CHI2015160.37533522614.167.5%
974MIA2014160.50038826216.467.5%
975.5GNB1994160.56338225816.167.5%
975.5NYJ1977140.2141911299.267.5%
977WAS2017160.43834223114.467.5%
978STL1997160.31329920212.667.6%
979SDG2010160.56344129818.667.6%
980WAS2003160.31328719412.167.6%
981WAS1992160.56330020312.767.7%
982WAS1998160.37531921613.567.7%
983MIN1988160.68840627517.267.7%
984OAK2010160.50041027817.467.8%
985NWE1987150.53332021714.567.8%
986SFO1985160.62541127917.467.9%
987DAL1970140.71429920314.567.9%
988BAL1979160.31327118411.567.9%
989PIT2000160.56332121813.667.9%
990WAS2004160.37524016310.267.9%
991NYG1979160.37523716110.167.9%
992PIT2006160.50035324015.068%
993DET1983160.56334723614.868%
994MIA1976140.42926317912.868.1%
995KAN1979160.43823816210.168.1%
996KAN1975140.35728219213.768.1%
997MIA1995160.56339827116.968.1%
999CLE2008160.2502321589.968.1%
999OAK1995160.50034823714.868.1%
999HOU1995160.43834823714.868.1%
1001NOR2012160.43846131419.668.1%
1002MIA1986160.50043029318.368.1%
1003DET2003160.31327018411.568.1%
1004NYJ1992160.2502201509.468.2%
1005CHI1996160.43828319312.168.2%
1006SFO2005160.25023916310.268.2%
1007GNB1996160.81345631119.468.2%
1008DAL2006160.56342529018.168.2%
1009DEN198290.22214810111.268.2%
1010TAM1980160.34427118511.668.3%
1011STL1986160.2812181499.368.3%
1012SDG1972140.321264180.512.968.4%
1013KAN1973140.57123115811.368.4%
1014BUF2018160.37526918411.568.4%
1015CIN2007160.43838026016.368.4%
1016NWE2000160.31327618911.868.5%
1017ATL2014160.37538126116.368.5%
1018OAK2003160.25027018511.668.5%
1019NOR1977140.21423215911.468.5%
1020BUF2011160.37537225515.968.5%
1021ATL2009160.56336324915.668.6%
1022NOR1981160.2502071428.968.6%
1023SFO1973140.35726218012.968.7%
1024DET1984160.281283194.512.268.7%
1025MIA2012160.43828819812.468.8%
1026TEN1997160.50033322914.368.8%
1027SDG1989160.37526618311.468.8%
1028IND2017160.25026318111.368.8%
1029NOR2007160.43837926116.368.9%
1030DET1970140.71434723917.168.9%
1031CIN1974140.50028319513.968.9%
1032NWE1983160.50027418911.869%
1033BUF2006160.43830020712.969%
1034MIA2002160.56337826116.369%
1035TEN2013160.43836225015.669.1%
1036CAR2016160.37536925515.969.1%
1037DAL1973140.71438226418.969.1%
1038DET1980160.56333423114.469.2%
1039NOR1979160.50037025616.069.2%
1040STL1999160.81352636422.869.2%
1041RAI1988160.43832522514.169.2%
1042HOU2006160.37526718511.669.3%
1043SEA198290.444127889.869.3%
1044ATL1993160.37531621913.769.3%
1045NYG1995160.31329020112.669.3%
1046BUF2013160.37533923514.769.3%
1047.5SDG2015160.25032022213.969.4%
1047.5SEA2000160.37532022213.969.4%
1049BUF2009160.37525817911.269.4%
1050CIN2016160.406325225.514.169.4%
1051ATL2013160.25035324515.369.4%
1052HOU2003160.31325517711.169.4%
1053CHI1992160.31329520512.869.5%
1054NWE2009160.62542729718.669.6%
1055ARI2012160.31325017410.969.6%
1056ARI1997160.25028319712.369.6%
1057PHI198290.33319113314.869.6%
1058MIA2015160.37531021613.569.7%
1059RAM1987150.40031722114.769.7%
1060GNB1984160.50039027217.069.7%
1061NWE1993160.31323816610.469.7%
1062CLE2009160.31324517110.769.8%
1063GNB1979160.31324617210.869.9%
1064ATL1981160.43842629818.670%
1065MIA1991160.50034324015.070%
1066SFO1972140.60735324717.670%
1067PIT2007160.62539327517.270%
1068NYG2015160.37542029418.470%
1069WAS2006160.31330721513.470%
1070SDG1991160.25027419212.070.1%
1071DEN1990160.31333123214.570.1%
1072PHI1981160.62536825816.170.1%
1073WAS1980160.37526118311.470.1%
1074NYG1985160.62539928017.570.2%
1075HOU1977140.57129921015.070.2%
1076.5CIN2000160.2501851308.170.3%
1076.5RAM1988160.62540728617.970.3%
1078ATL1994160.43831722313.970.3%
1079TAM2007160.56333423514.770.4%
1080CHI1974140.2861521077.670.4%
1081SDG1971140.42931121915.670.4%
1082ARI2004160.37528420012.570.4%
1083CIN1983160.43834624415.370.5%
1084DET1981160.50039728017.570.5%
1085CIN1972140.57129921115.170.6%
1086TAM2006160.2502111499.370.6%
1087CIN1994160.18827619512.270.7%
1088CLE198290.4441409911.070.7%
1089PHI2008160.594416294.518.470.8%
1090NWE1972140.2141921369.770.8%
1091TAM1993160.31323716810.570.9%
1092ATL1976140.2861721228.770.9%
1093GNB2009160.68846132720.470.9%
1094DET2004160.37529621013.170.9%
1095TAM2018160.31339628117.671%
1096OAK2007160.25028320112.671%
1097PHI1972140.1791451037.471%
1098ARI2016160.46941829718.671.1%
1099PHI2012160.25028019912.471.1%
1100OAK2008160.31326318711.771.1%
1101NOR1973140.3571631168.371.2%
1102PIT1990160.56329220813.071.2%
1103NYG1977140.3571811299.271.3%
1104CAR1995160.43828920612.971.3%
1105SFO198290.33320914916.671.3%
1106BUF1970140.250204145.510.471.3%
1107CHI1983160.50031122213.971.4%
1108NYJ198290.66724517519.471.4%
1109DEN2009160.50032623314.671.5%
1110ATL1984160.25028120112.671.5%
1111CHI1976140.50025318112.971.5%
1112NWE1974140.50034824917.871.6%
1113JAX2002160.37532823514.771.6%
1114TAM1988160.31326118711.771.6%
1115GNB1986160.25025418211.471.7%
1116ARI2005160.31331122313.971.7%
1117JAX2003160.31327619812.471.7%
1118NYJ2018160.25033323914.971.8%
1119HOU2004160.43830922213.971.8%
1120WAS2010160.37530221713.671.9%
1121BAL1971140.71431322516.171.9%
1122NYG1992160.37530622013.871.9%
1123CIN1992160.31327419712.371.9%
1124TEN2015160.18829921513.471.9%
1125HOU2015160.56333924415.372%
1126CIN1998160.18826819312.172%
1127IND1986160.18822916510.372.1%
1128JAX2015160.31337627116.972.1%
1129NOR1985160.31329421213.372.1%
1130BAL2009160.56339128217.672.1%
1131SFO2010160.37530522013.872.1%
1132RAM1990160.31334524915.672.2%
1133NYJ1990160.37529521313.372.2%
1134.5OAK1997160.25032423414.672.2%
1134.5SFO1976140.57127019513.972.2%
1136DAL1986160.43834625015.672.3%
1137NYG2004160.37530321913.772.3%
1138CHI1984160.62532523514.772.3%
1139PIT1986160.37530722213.972.3%
1140PIT2003160.37530021713.672.3%
1141MIN1986160.56339828818.072.4%
1142DET2010160.37536226216.472.4%
1143PHI1970140.250241174.512.572.4%
1144ATL1990160.31334825215.872.4%
1145NOR1991160.68834124715.472.4%
1146SEA1994160.37528720813.072.5%
1147DEN1988160.50032723714.872.5%
1148NYG1987150.40028020313.572.5%
1149HOU1970140.250217157.511.372.6%
1150NYJ1993160.50027019612.372.6%
1151TAM1978160.31324117510.972.6%
1152DEN1972140.35732523616.972.6%
1153NYG2014160.37538027617.372.6%
1154OAK1996160.43834024715.472.6%
1155CIN2006160.50037327116.972.7%
1156BUF2012160.37534425015.672.7%
1157PHO1990160.31326819512.272.8%
1158MIN1984160.18827620112.672.8%
1159ARI2003160.25022516410.372.9%
1160ATL2003160.31329921813.672.9%
1161.5TAM2013160.25028821013.172.9%
1161.5SFO2003160.43838428017.572.9%
1163TEN2004160.31334425115.773%
1164STL1998160.25028520813.073%
1165BUF2005160.31327119812.473.1%
1166SDG2016160.31341030018.873.2%
1167DET2005160.31325418611.673.2%
1168NWE1973140.35725818913.573.3%
1169WAS2011160.31328821113.273.3%
1170DET1976140.42926219213.773.3%
1171.5TEN2010160.37535626116.373.3%
1171.5PIT1981160.50035626116.373.3%
1173GNB1971140.35727420114.473.4%
1174ATL2000160.25025218511.673.4%
1175TAM2017160.31333524615.473.4%
1176BUF2016160.43839929318.373.4%
1177.5KAN2007160.25022616610.473.5%
1177.5DAL198290.66722616618.473.5%
1179MIA2006160.37526019111.973.5%
1180HOU1971140.321251184.513.273.5%
1181NYJ2007160.25026819712.373.5%
1182STL1970140.60732523917.173.5%
1183STL1971140.32123117012.173.6%
1184IND1984160.25023917611.073.6%
1185.5BAL2007160.31327520312.773.8%
1185.5JAX1995160.25027520312.773.8%
1187DEN2010160.25034425415.973.8%
1188NYJ2003160.37528320913.173.9%
1189RAM1991160.18823417310.873.9%
1190CAR1997160.43826519612.374%
1191CHI2014160.31331923614.874%
1192SEA2015160.62542331319.674%
1193ATL1992160.37532724215.174%
1194LAR2016160.25022416610.474.1%
1195DEN1970140.393253187.513.474.1%
1196ATL1987150.20020515210.174.1%
1197TAM2011160.25028721313.374.2%
1198.5GNB1974140.42921015611.174.3%
1198.5PIT1970140.35721015611.174.3%
1200CLE1975140.21421816211.674.3%
1201DAL1997160.37530422614.174.3%
1202CLE2013160.25030822914.374.4%
1203DAL2001160.31324618311.474.4%
1204HOU1986160.31327420412.874.5%
1205GNB1980160.34423117210.874.5%
1206OAK2012160.25029021613.574.5%
1207CLE2000160.1881611207.574.5%
1208.5DAL2015160.25027520512.874.5%
1208.5MIA2004160.25027520512.874.5%
1210ATL1988160.31324418211.474.6%
1211CAR2011160.37540630318.974.6%
1212DET2018160.37532424215.174.7%
1213NOR1976140.28625318913.574.7%
1214DET1973140.464271202.514.574.7%
1215DET1986160.31327720712.974.7%
1216CIN1987150.26728521314.274.7%
1217CIN1989160.50040430218.974.8%
1218BAL1973140.28622616912.174.8%
1219JAX2017160.62541731219.574.8%
1220GNB2008160.37541931419.674.9%
1221KAN198290.33317613214.775%
1222CHI2002160.25028121113.275.1%
1223BAL2005160.37526519912.475.1%
1224HOU2002160.25021316010.075.1%
1225OAK2005160.25029021813.675.2%
1226BAL2017160.56339529718.675.2%
1227CLE1984160.31325018811.875.2%
1228PHI2016160.43836727617.375.2%
1229SFO1974140.42922617012.175.2%
1230CHI1980160.43830422914.375.3%
1231CHI1973140.21419514710.575.4%
1232.5NYJ2005160.25024018111.375.4%
1232.5HOU1984160.18824018111.375.4%
1234WAS1970140.42929722416.075.4%
1235CLE1991160.37529322113.875.4%
1236RAM1972140.464291219.515.775.4%
1237CLE1995160.31328921813.675.4%
1238WAS2013160.18833425215.875.4%
1239KAN1987150.26727320613.775.5%
1240DET1998160.31330623114.475.5%
1241PHI2011160.50039629918.775.5%
1242PHO1991160.2501961489.375.5%
1243ARI2002160.31326219812.475.6%
1244GNB1975140.28622617112.275.7%
1245MIA2011160.37532924915.675.7%
1246BUF2003160.37524318411.575.7%
1247PHO1993160.43832624715.475.8%
1248CLE2012160.31330222914.375.8%
1249JAX2018160.31324518611.675.9%
1250IND1985160.31332024315.275.9%
1251NYJ1975140.21425819614.076%
1252ATL1989160.18827921213.376%
1253SFO1975140.35725519413.976.1%
1254WAS2014160.25030122914.376.1%
1255CHI1998160.25027621013.176.1%
1256CLE2011160.25021816610.476.1%
1257KAN1983160.37538629418.476.2%
1258STL1979160.31330723414.676.2%
1259TAM1987150.26728621814.576.2%
1260CIN2008160.281204155.59.776.2%
1261OAK2014160.18825319312.176.3%
1262BUF2010160.25028321613.576.3%
1263DET2012160.25037228417.876.3%
1264PHI1998160.1881611237.776.4%
1265ARI2018160.18822517210.876.4%
1266SEA1991160.43827621113.276.4%
1267RAM1977140.71430223116.576.5%
1268WAS1994160.18832024515.376.6%
1269CIN1978160.25025219312.176.6%
1270BUF198290.44415011512.876.7%
1271SDG2003160.25031324015.076.7%
1272NYJ2014160.25028321713.676.7%
1273PIT1985160.43837929118.276.8%
1274SDG2001160.31333225515.976.8%
1275NYJ1980160.25030223214.576.8%
1276KAN2009160.25029422614.176.9%
1277ATL1985160.25028221713.677%
1278.5JAX2011160.31324318711.777%
1278.5PHO1992160.25024318711.777%
1280HOU1976140.35722217112.277%
1281NOR1974140.3571661289.177.1%
1282SEA1993160.37528021613.577.1%
1283DEN2017160.31328922313.977.2%
1284NYJ1970140.28625519714.177.3%
1285DET1988160.25022017010.677.3%
1286NYJ2009160.56334826916.877.3%
1287NOR1970140.1791721339.577.3%
1288RAM1993160.31322117110.777.4%
1289TAM2009160.18824418911.877.5%
1290SDG1990160.37531524415.377.5%
1291MIN1990160.37535127217.077.5%
1292CLE2003160.31325419712.377.6%
1293SFO2004160.12525920112.677.6%
1294NYG1976140.2141701329.477.6%
1295.5CHI2017160.31326420512.877.7%
1295.5NYG1978160.37526420512.877.7%
1297TAM1977140.143103805.777.7%
1298DET1987150.26726920913.977.7%
1299KAN2012160.12521116410.377.7%
1300SFO1977140.35722017112.277.7%
1301NOR1986160.43828822414.077.8%
1302DET1996160.31330223514.777.8%
1303DAL2000160.31329422914.377.9%
1304.5TEN2005160.25029923314.677.9%
1304.5STL1980160.31329923314.677.9%
1306OAK2013160.25032225115.778%
1307BUF1978160.31330223614.878.1%
1308ATL1977140.50017914010.078.2%
1309CAR1998160.25033626316.478.3%
1310TAM1992160.31326720913.178.3%
1311SFO1999160.25029523114.478.3%
1312.5STL2007160.18826320612.978.3%
1312.5CHI1997160.25026320612.978.3%
1314DET1992160.31327321413.478.4%
1315CHI1989160.37535828117.678.5%
1316DET2006160.18830524015.078.7%
1317RAI1987150.33330123715.878.7%
1318JAX2000160.43836728918.178.7%
1319NYJ1973140.28624018913.578.8%
1320SEA2009160.31328022113.878.9%
1321SDG1997160.25026621013.178.9%
1322TAM2004160.31330123814.979.1%
1323TAM1986160.12523918911.879.1%
1324CIN1991160.18826320813.079.1%
1325NOR2005160.18823518611.679.1%
1326GNB2005160.25029823614.879.2%
1327SFO2018160.25034227116.979.2%
1328ATL1974140.214111886.379.3%
1329NYG1996160.37524219212.079.3%
1330IND1998160.18831024615.479.4%
1331SFO2000160.37538830819.379.4%
1332PHI1976140.2861651319.479.4%
1333CLE2015160.18827822113.879.5%
1334BAL1996160.25037129518.479.5%
1335BAL1972140.35723518713.479.6%
1336DAL1988160.18826521113.279.6%
1337STL2014160.37532425816.179.6%
1338WAS2009160.25026621213.379.7%
1339DET2009160.12526220913.179.8%
1340JAX2006160.50037129618.579.8%
1341PIT1999160.37531725315.879.8%
1342SDG1975140.14318915110.879.9%
1343TAM1991160.1881991599.979.9%
1344RAI1992160.43824919912.479.9%
1345CIN1979160.25033727016.980.1%
1346JAX2016160.18831825515.980.2%
1347CHI1978160.43825320312.780.2%
1348CLE1990160.18822818311.480.3%
1349BAL1981160.12525920813.080.3%
1350IND1991160.0631431157.280.4%
1351HOU2013160.12527622213.980.4%
1352PHI1975140.28622518112.980.4%
1353SFO2009160.50033026616.680.6%
1354NOR1998160.37530524615.480.7%
1355HOU2017160.25033827317.180.8%
1356NWE1992160.12520516610.481%
1357CHI1972140.321225182.513.081.1%
1358NOR1996160.18822918611.681.2%
1359DEN1971140.32120316511.881.3%
1360NWE1975140.21425821015.081.4%
1361CLE2004160.25027622514.181.5%
1362JAX2014160.18824920312.781.5%
1363BUF1986160.25028723414.681.5%
1364NYJ1976140.2141691389.981.7%
1365.5GNB1988160.25024019612.381.7%
1365.5ATL1975140.28624019614.081.7%
1367CLE1974140.28625120514.681.7%
1368STL2011160.1251931589.981.9%
1369SEA2008160.25029424115.182%
1370CIN2010160.25032226416.582%
1371RAM198290.22220016418.282%
1372NYG1974140.14319516011.482.1%
1373NYG1973140.179226185.513.382.1%
1374PHI1977140.35722018112.982.3%
1375.5MIN2011160.18834028017.582.4%
1375.5CIN1993160.1881871549.682.4%
1377TAM2003160.43830124815.582.4%
1378IND1997160.18831325816.182.4%
1379BOS1970140.1431491238.882.6%
1380BUF2001160.18826521913.782.6%
1381.5CAR2010160.12519616210.182.7%
1381.5JAX2001160.37529424315.282.7%
1383NOR1975140.1431651379.883%
1384IND1993160.2501891579.883.1%
1385BUF1977140.2141601339.583.1%
1386NYJ1995160.18823319412.183.3%
1387DET2002160.18830625515.983.3%
1388NOR1999160.18826021713.683.5%
1389SDG1973140.17918815711.283.5%
1390KAN1978160.25024320312.783.5%
1391RAM1994160.25028623914.983.6%
1392ATL1996160.18830925916.283.8%
1393HOU198290.11113611412.783.8%
1394HOU1983160.12528824215.184%
1395TAM1983160.12524120312.784.2%
1396BAL1974140.14319016111.584.7%
1397CLE1999160.12521718411.584.8%
1398PIT1976140.71434229020.784.8%
1399SEA1980160.25029124715.484.9%
1400SEA1992160.1251401197.485%
1401JAX2012160.12525521713.685.1%
1402CIN1971140.28628424317.485.6%
1403NOR1972140.17921518413.185.6%
1404OAK2006160.1251681449.085.7%
1405HOU2005160.12526022313.985.8%
1406STL2008160.12523219912.485.8%
1407HOU1973140.07119917112.285.9%
1408DET2001160.12527023414.686.7%
1409NYG2017160.18824621413.487%
1410HOU1972140.07116414310.287.2%
1411IND2011160.12524321213.387.2%
1412GNB1991160.25027323914.987.5%
1413KAN1977140.14322519714.187.6%
1414TAM2014160.12527724415.388.1%
1415CHI2016160.18827924615.488.2%
1416KAN2008160.12529125716.188.3%
1417BUF1976140.14324521715.588.6%
1418DET1979160.12521919412.188.6%
1419BUF1971140.07118416311.688.6%
1420SDG1986160.25033529718.688.7%
1421HOU1994160.12522620112.688.9%
1422SEA1976140.14322920414.689.1%
1423NYG1983160.21926723814.989.1%
1424TEN2014160.12525422814.389.8%
1425NWE1981160.12532229318.391%
1426BAL198290.05611310311.491.2%
1427NWE1990160.06318116610.491.7%
1428BUF1984160.12525023014.492%
1429NYJ1996160.06327925716.192.1%
1430SFO1979160.12530828417.892.2%
1431SFO1978160.12521920212.692.2%
1432SFO2016160.12530928617.992.6%
1433NOR1980160.06329127016.992.8%
1434CLE2016160.06326424615.493.2%
1435CIN2002160.12527926116.393.5%
1436MIA2007160.06326725015.693.6%
1437SDG2000160.06326925215.893.7%
1438STL2009160.06317516410.393.7%
1439TAM1985160.12529427617.393.9%
1440CAR2001160.06325323914.994.5%
1441BUF1985160.12520018911.894.5%
1442DAL1989160.06320420012.598%
1444CLE2017160.00023423414.6100%
1444DET2008160.00026826816.8100%
1444TAM1976140.0001251258.9100%

If the Seahawks can keep this up, they will wind up being the most efficient team at distributing their points across games for any team since 1970.

{ 0 comments }

Tom Brady has a whopping 34 throwaways this year, which is an outlier for him (for reference, last year he had 22 on 84 more pass attempts); it also leads the league by a large margin.

Games Passing
Rk Player Tm Age Pos G GS Cmp Att Yds Bats Throwawy
Spikes Drops Drop% BadTh Bad% OnTgt OnTgt%
1 Tom Brady NWE 42 QB 12 12 297 486 3268 5 34 0 26 5.8% 88 19.5% 334 73.9%
2 Aaron Rodgers GNB 36 QB 12 12 266 413 3065 2 24 1 13 3.4% 78 20.1% 298 76.8%
3 Josh Allen BUF 23 QB 12 12 225 366 2591 6 22 3 23 6.7% 65 19.1% 259 76.0%
4 Kyle Allen CAR 23 QB 10 10 225 366 2457 11 22 0 23 6.7% 58 16.9% 266 77.3%
5 Kirk Cousins MIN 31 QB 12 12 248 358 3032 7 21 0 16 4.7% 51 15.1% 272 80.7%
6 Matt Ryan ATL 34 QB 11 11 301 447 3246 13 19 1 12 2.8% 60 14.1% 328 76.8%
7 Jameis Winston TAM 25 QB 12 12 281 467 3659 9 17 2 19 4.2% 92 20.5% 318 71.0%
8 Kyler Murray ARI 22 QB 12 12 273 427 2866 15 17 3 16 3.9% 75 18.4% 298 73.2%
9 Derek Carr OAK 28 QB 12 12 259 367 2843 7 16 1 16 4.6% 41 11.7% 283 80.9%
10 Sam Darnold NYJ 22 QB 9 9 196 311 2154 8 16 1 16 5.4% 54 18.4% 222 75.5%

[continue reading…]

{ 1 comment }

This graph shows every game this season. The X-Axis shows the Game Script in each game, for both teams, and the Y-Axis shows the pass ratio by each team in that game. As always, these is a relatively strong relationship between these two variables.

We can also calculate this on the season level, for all 32 teams, on both offense and defense. That’s what I did in the graph below, and there are three notable outliers among the league’s best teams: the Ravens offense, which is extremely run-heavy even given its Game Script, the Patriots offense, which is remarkably pass-heavy given its Game Script, and the 49ers defense, against which teams seem to avoid passing even given the largely negative Game Script those opponents face. I have shaded them in those colors below. [continue reading…]

{ 1 comment }

Previously:

The Vikings have been one of the most run-heavy teams in the NFL under head coach Mike Zimmer.  That made some sense when Minnesota’s passing game wasn’t very good, but that’s no longer the case.  This year, quarterback Kirk Cousins has been one of the most valuable passers in the NFL,  leading the second most efficient passing attack through 13 weeks.  But even in 2019, Minnesota has been pretty run-heavy… until week 13 against Seattle.

The graph below shows Minnesota’s Game Script (X-Axis) and Pass Ratio (Y-Axis) for each game this season.  The Seahawks game is a pretty clear outlier: this was the most pass-happy game of the season, and it came during a neutral Game Script.

The table below shows the full week 13 Game Scripts data. [continue reading…]

{ 0 comments }

Previous Passing Stats:

It has been a rough year for California quarterbacks Jared Goff and Aaron Rodgers. Prior to week 13, Goff’s last 16 regular season games had produced just 17 passing touchdowns against 18 interceptions, along with 16 fumbles. Rodgers has had an up-and-down year, and the murmurs are continuing to grow about whether his best days are behind him.

In week 13, however, the two Golden Bears had outstanding games. Goff threw for 424 yards and 2 TDs on 43 passes, with only one sack and no interceptions or fumbles in a blowout win over the Cardinals. It’s probably worth noting that 66% of Goff’s yards came after the catch, as his receivers finished with a whopping 282 YAC on Sunday. As for Rodgers, he threw 4 TDs and didn’t take a sack or throw an interception in a blowout win in the snow against the Giants.

The table below shows the week 13 stats.
[continue reading…]

{ 0 comments }