≡ Menu

Previously:

If you drop back to pass 70 times, it doesn’t matter what the score is: that’s a very pass-heavy game! The Rams had one of the most pass-heavy games of the season on Sunday in a 55-40 loss to Tampa Bay. Los Angeles finished with 70 pass plays versus just 11 runs, an 86.4% pass ratio rarely see in the NFL.

Someone asked: should we hand the ball to Gurley?

And it wasn’t all game script. Los Angeles had 7 passes and 1 run (a Cooper Kupp handoff, no less) on the team’s first offensive drive of the game. And on the Rams second drive, with the score only 7-0, Los Angeles had 7 passes and no runs.  The Rams seemed to overcorrect on their third drive by running on the first two plays of their third drive, but two Malcolm Brown runs led to a 3rd-and-4 and a Jared Goff interception.  This means Todd Gurley didn’t get his first carry of the game until the team’s 18th play from scrimmage and fourth drive of the game.

Aaron Rodgers and the Packers also had a very pass-heavy game plan in week four.  This was a perfectly even game: it was a back-and-forth contest where Green Bay finished with a -0.1 Game Script.  Running back Aaron Jones rushed 13 times for only 21 yards, while Rodgers had 53 pass attempts, 1 sack, and 5 scrambles (with zero designed runs).  That means the Packers called 59 pass plays and just 15 rushes, although Game Scripts data currently considers scrambles as rushing plays.  That’s remarkably pass-heavy for an even game.

Finally, Joe Flacco and the Broncos stood out as pass-happy, too.  Denver lost, but led the most of the game and finished with a +4.9 Game Script. Flacco played pretty well, taking no sacks and throwing for 15 first downs and 303 yards on 38 attempts.  Perhaps this was a response to my article about how Denver was over-the-top run-heavy in week 3?

The full week 4 Game Script data below: [continue reading…]

{ 0 comments }

There were 14 NFL teams back in 1962, and the starting quarterbacks for 11 of them averaged more yards per pass attempt than the starting quarterbacks for those same teams did in 2018. We learned that in Part I of this series.  Today, in Part II, we will look at the evolution of passing efficiency in the NFL since 1940.

In 1962, the league as a whole averaged 7.9 yards per pass attempt.  That’s a remarkable figure.  So remarkable that it remains the record and is unlikely to be broken anytime soon.  The graph below shows the NFL yards per attempt average in each season from 1940 to 2018.
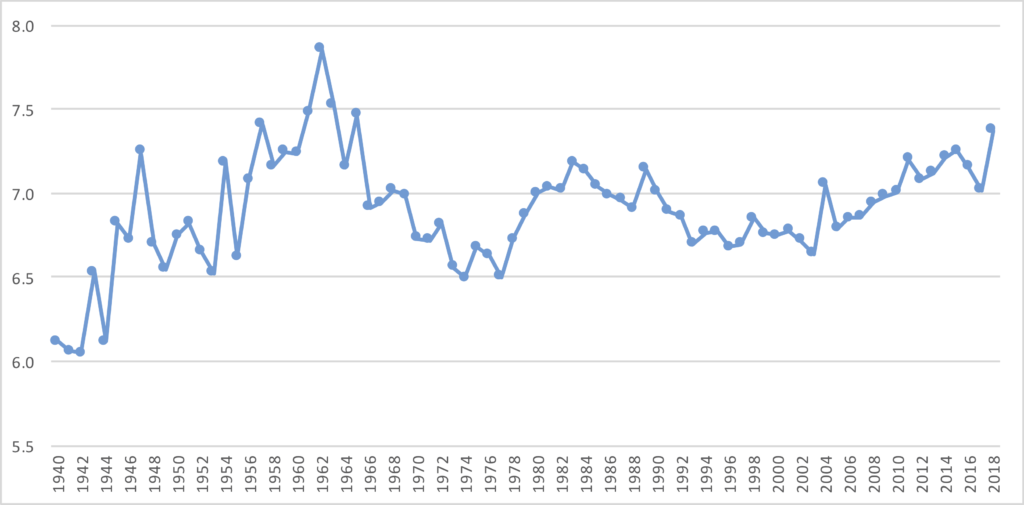
It doesn’t take a long examination to see that the 1962 season is a significant outlier.  So what caused this?  It helps to begin by breaking down yards per attempt into two components: Completions per Attempt and Yards per Completion; the product of these two statistics is, of course, yards per attempt.

Over the last 80 years, completion percentages have been rising. This is well known, but less discussed is that the average gain on those completed passes — the statistic known as yards per completion — has been steadily falling.   The graph below shows the NFL average completion percentage in blue and marked against the Left Y-Axis, and NFL  yards per completion average in orange marked against the Right Y-Axis, for each year from 1940 to 2018.  The graph forms a jagged X: yards per completion starts up and to the left and ends down and to the right, with completion percentage beginning in the lower left quadrant and ending on the upper right quadrant.
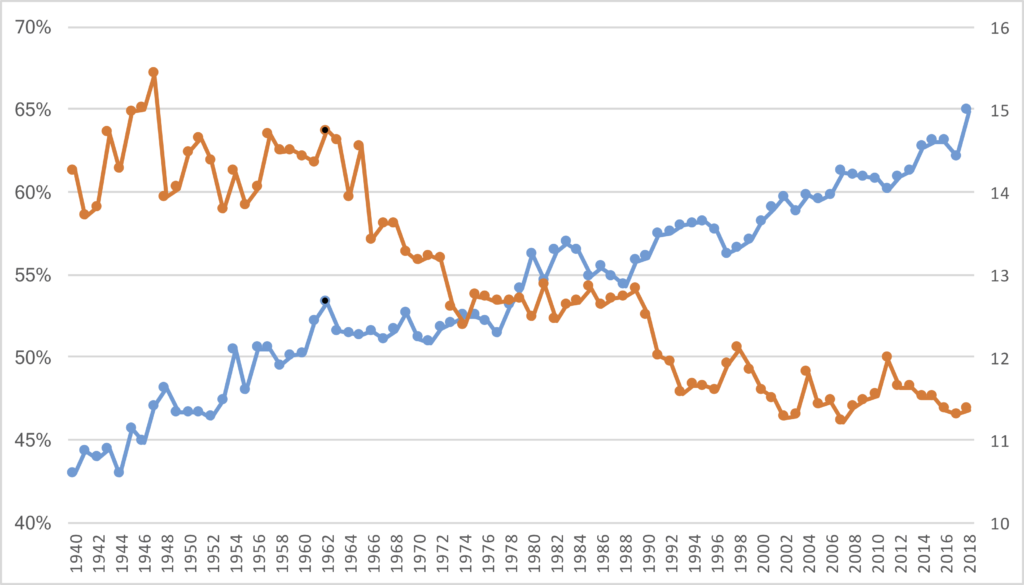
To make it easier for you to see, I shaded the 1962 season in black dots on both lines.  There was a large jump in completion percentage in 1962 — in fact, ’62 set the new record for completion percentage in a season at 53%, and that mark wasn’t broken until 1979!  On the other hand, this wasn’t shocking for the era: after all, 1961 also set a new record for completion percentage.  The 53% rate was notably high and a bit of an outlier, but part of a (still) growing trend towards higher completion percentages year over year.

On the other hand, the 1962 season also represented a reversal of the trend in terms of yards per completion.  Teams gained 14.74 yards per completed pass, the 4th-highest since 1940 both at the time and since.  And the three higher seasons all had come well over a decade earlier, so this was a true change in the tides.  Not only were teams completing more passes than ever, but they were doing so at a rate similar to what happened prior to 1950.

Of course, simple math tells us that if you have an extraordinarily high (for that era) completion percentage combined with an extraordinarily high yards per completion average, that you will wind up with a record-setting yards per attempt average.  And that’s exactly what happened.  The early 1960s were somewhat of an inflection point in this regard: the top three yards per attempt seasons in NFL history were in 1961, 1962, and 1963!  And the 4th-best mark came in 1965.

In the early part of the ’60s, while the AFL was earning a reputation for being a pass-happy league, the NFL was quietly enjoying its most pass efficient seasons in history.  And to be clear, all data in this post is NFL-only.  But even among this era of rising completion percentages and still-high YPC averages, the ’62 season stands alone.  If 1962 didn’t exist, we’d talk about how 1961 and 1963 were remarkably high yards/attempt seasons, but 1962 easily eclipses both of those marks.

Finally, here is the data from every year since 1940, presented in table form.

So what caused all of this? Stay tuned for Part III.

{ 0 comments }

Week 4 (2019) Passing Stats: NFL Offenses Struggle

It was a rough week for a lot of passers in week 4: there were just 39 touchdown passes by the 30 teams, and the league averaged only 5.82 ANY/A. There were a pair of 16-10 victories (NE/BUF, CAR/HOU) where all quarterbacks played poorly, a 16-6 victory that was pretty ugly (CHI/MIN), and a 12-10 matchup on Sunday Night (NO/DAL) that was equally hard to watch.

NFL teams have gotten very conservative in the passing game, and I’d suggest that they are far too conservative. Kirk Cousins did not throw an interception, but that’s because he showed no sign of aggressiveness. Take a look at his passing chart, and keep in mind that this does not show the six times he took a sack: [continue reading…]

{ 0 comments }

Frank Gore Is Remarkable

In 1977, the Kansas City Chiefs went 2-10. This was during one of the worst passing seasons in NFL history, the season that encouraged the 1978 rules changes. Quarterback Mike Livingston went 1-10 as the starter and he was about as bad as his record. Kansas City brought him back as the team’s starter in 1978, but changed coaches, bringing in Marv Levy. The future Bills coach inherited a terrible team in Kansas City that was particularly inexperienced on defense: all three starters on the defensive line were rookies, as was one of the linebackers; two other starters were ’77 draft picks, and another two starters were 24-year old players drafted in 1976.  That’s 8 of 11 starters on defense that were 24 or younger, to go with a a bad passing attack centered around Livingston, and WRs Henry Marshall and Larry Dorsey.

So what did Levy do?  He decided to install the Wing-T offense, centered around three halfbacks, a tight end, and Marshall at split end.  Kansas City had Tony Reed as the starting halfback, Arnold Morgando as the fullback, and Ted McKnight as the Wingback as part of a ball-controlled offense designed to keep the young defense (and weak passing game) off the field. But on October 1st, 1978, it was veteran backup Macarthur Lane — with the emphasis on veteran — that powered the offense.  Lane rushed 17 times for 144 yards in a game where Livingston and backup Tony Adams combined to complete 9 of 21 passes for just 83 yards.

So why is this noteworthy today? Well, on October 1st, Lane was 36 years and 199 days old. Playing in that Wing-T offense, he became the oldest player to ever rush for 100 yards in a game. And yesterday, Frank Gore nearly matched him. The ageless Gore rushed 17 times for 109 yards in a Bills loss to the Patriots. He wasn’t aided by a Wing-T offense, but the 36 year, 138-day old back did his best to keep the Bills alive on a day where the passing attack was a disaster (averaging 1.22 ANY/A).

And historians, take note: Gore will be 36 years and over 200 days old for the Bills four games in December, making him eligible to set the new record for the oldest player to rush for 100 yards in a game. [continue reading…]

{ 0 comments }

Murray has been sacked 16 times in 3 games.

Arizona rookie Kyler Murray has some pretty strong counting stats so far this year: he’s averaging 276 passing yards per game, which would lead him to breaking the mark for passing yards by a rookie if he keeps this up for 16 games. He “only” has three interceptions, and he is completing a whopping 28 passes per game: only Drew Brees (5x), Peyton Manning (2x), and Ben Roethlisberger (2018) have ever done that in a season while playing in at least 8 games.

But Murray’s efficiency numbers have been, well, bad. He’s averaging just 4.42 ANY/A this year, thanks to an awful sack rate (10.5%) and a poor yards per completion average (9.9). But we don’t need an advanced stat like ANY/A to see Murray’s struggles: the most basic of stats will suffice.

Murray has thrown for only 37 first downs so far this year, despite having 153 passing plays (pass attempts plus sacks). That is an ugly 24.2% rate, while the league average is 32.6%. First down rate is one of the most basic stats to measure passing success, but it’s much better than completion percentage and is a handy way to quickly and easily check in on quarterback performance. The table below shows the passing stats for quarterbacks prior to today: [continue reading…]

{ 0 comments }

Interceptions By Win Probability, Part 2

Mayfield is having a tough start to the year, but don’t point to his interception against Tennessee as a reason why.

Last year, I wrote about how not all interceptions are created equally, and that there is a large diversity in the impact of interceptions.

There have been a lot of meaningless interceptions this season already. Baker Mayfield threw an interception down by 23 points with 3 minutes remaining at the Cleveland 20. That interception dropped the Browns chances of winning from zero to zero. Trailing by 42 points, Josh Rosen opened the 4th quarter of the opening game loss to the Ravens by throwing a meaningless interception. The next week, Miami’s Ryan Fitzpatrick threw two 4th quarter interceptions in a blowout loss to the Patriots: yeah, maybe all Dolphins interceptions are meaningless, but these three were *really* meaningless. And the most meaningless (is that a thing?) one yet? Rosen threw an interception on the final play of that Patriots game, too. [continue reading…]

{ 0 comments }

Mike Leach has been at the front of the passing revolution in football circles for three decades.  He worked with Hal Mumme at Iowa Wesleyan in 1989, and that’s where the two began creating the Air Raid offense. Together they moved on to Valdosta State in Georgia, and then up to major college football when they moved to Kentucky in 1997.   There, Leach mentored a future number one overall draft pick; two years later, he moved to Oklahoma and helped the Sooners win a national title before embarking on a decade-long stint in Lubbock as head coach of the Texas Tech Red Raiders.  And since 2012, Leach has been the head coach at Washington State.

The table below shows all of Leach’s starting quarterbacks during his time in major college football: [continue reading…]

{ 0 comments }

Previously:

New England is at it again, rolling through the NFL in dominant fashion.  For the third time in three games, the Patriots had a Game Script of over +14.0.  The Patriots have outscored teams by 53 points at halftime and 73 points through three quarters; both are the best marks in the league.  Here’s your money stat of the week: New England opponents have run 169 plays this year, and 120 of them (71%) have come with the Patriots leading by more than two touchdowns.

From a Game Scripts perspective, the most interesting thing about week 3 might have been that Tom Brady was still really pass-happy. The Patriots joined the rare 10/15/20/45 club: leading by at least 10, 15, and 20 points after the 1st, 2nd, and 3rd quarters, respectively, and throwing 45+ times in the game.  The last time it happened was so unusual I wrote about it in this column then, too.

The other team that was really pass-heavy was Philip Rivers and the Chargers.  In a game where Los Angeles had a +2.4 Game Script, you’d expect a pretty average pass ratio.  Instead, L.A. passed on 74% of plays, the most of all 32 teams in week 3.  It is unusual that the team with the highest pass ratio in a week had a positive Game Script, but it’s hard to fault a team like the Chargers for passing a lot. Also worth noting: the two Chargers running backs, Austin Ekeler and Justin Jackson, caught 11 of 11 targets for 51 yards (and 3 first downs), which … well, I’m not quite sure what to think about that. [continue reading…]

{ 0 comments }

Coaching Tips: Don’t Miss Out On A Free Pass Play

In 2012, the New Orleans Saints led the Cowboys, 31-24, with 2:46 remaining and Dallas holding just two timeouts. Drew Brees completed a pass to Jimmy Graham for the first down, and the Saints looked to be in great shape.

New Orleans still had to run another play before the 2 minute warning, however, and with 2:04 remaining, the Saints ran Mark Ingram off left tackle.  He lost a yard and the two minute warning stopped the clock.  New Orleans ran again on second down, and the Cowboys called their second timeout.  On third and long, Brees completed a pass short of the sticks, and the Cowboys called their final timeout.  After a punt, the Cowboys took over with 1:29 remaining and no timeouts, and needing 64 yards for a touchdown.  That was all Tony Romo, always known for his great 4th quarter passing numbers, needed to tie the game: with 21 seconds remaining, he threw a game-tying touchdown pass, and the two teams went to overtime.

Why am I bringing that up today?  Because the Saints should have passed the ball with 2:04 remaining!  When you are that close to the two minute warning, coaches should view that as a free opportunity to pass the ball and pick up a first down.  This happened again on Sunday in an even more egregious situation.  The Ravens scored a touchdown with 2:01 remaining to cut the lead to 33-28.  Baltimore then brilliantly chose to do a drop kick onside kick; the Chiefs correctly responded with a fair catch, but that meant no time went off the clock.

So now Kansas City had the ball, with 2:01 remaining, and Baltimore down to just one timeout.  The Chiefs, I remind you, have Patrick Mahomes. There was no downside to passing here other than an interception, and well, that’s not something Mahomes is very likely to do. This is an obvious passing situation, and I said so immediately when the situation arose:

Alas, the Chiefs chose to run the ball twice, and then were forced to pass on 3rd and 9 (which, of course, Mahomes converted because well, he’s Mahomes). But that outcome doesn’t change the bad process.
[continue reading…]

{ 0 comments }

Week 3 (2019) Passing Stats: Kyler Murray Hits Rock Bottom

If you took a quick glance at the passing stats from week 3, you might not notice how bad number one overall pick Kyler Murray performed against the Panthers. You’d see that he threw for only 173 yards with 2 TDs and 2 INTs, and might think that it was a typical underwhelming performance by a rookie quarterback.

What you might not have noticed was that Murray had 43 pass attempts and also was sacked a whopping 8 times, losing 46 yards. He also only passed for 9 first downs, a pitiful number given his 51 passing plays (17.6%). Murray threw for just 127 net passing yards against Carolina, a shockingly-low 2.49 net yards per attempt average. In fact, no passer had averaged under 2.50 NY/A in a game with 40+ attempts since 2003.

Murray finished week 3 with a 1.51 ANY/A average, the second-worst performance in week 3 by any starting quarterback. The worst? Well, that honor belongs to Jets third string QB Luke Falk, who was basically useless against the Patriots. Falk had 27 passing plays on Sunday: 20 of them produced negative EPA, meaning they were a negative play, 3 were slightly positive plays (i.e., a 5-yard pass on 1st-and-10), and 4 picked up first downs. New York scored 14 points courtesy of a special teams touchdown and a defensive touchdown.

On the positive side of things, the top three passing stat lines belonged to Patrick Mahomes, Deshaun Watson, and Kyle Allen. The full week 3 passing stats below: [continue reading…]

{ 0 comments }

Advanced Stats Pages Now On Pro-Football-Reference.com

You may have noticed that PFR has been making some additions to their fantastic website, including by adding some advanced statistics pages. For example, regular readers may recall Adam’s post this offseason about Nick Mullens and how much he benefited from yards after the catch.

In the cases of Beathard and Mullens, it’s no coincidence that both played for the same team. Kyle Shanahan’s scheme was able to exploit defenses and create gaping holes in the zone for his receivers to pick up huge chunks of yardage. This created long gains that boosted the stat sheet for his quarterbacks but only required simple throws that nearly every professional passer could make.

Well, now you can check for yourself at PFR: this page shows advanced passing stats from 2018; as it turns out, Mullens averaged 6.9 yards of “YAC” — yards after the catch — on his completions last season, the highest rate in the NFL.  And while they didn’t throw enough passes to qualify, 49ers quarterbacks C.J. Beathard (7.1 YAC/C) and Jimmy Garoppolo (6.9) also had crazy-high YAC numbers.

This season? With Garoppolo back as the San Francisco starter, his receivers are averaging an NFL-best 9.8 yards after the catch.  This page is a great resource, and also can help you uncover some surprises. For example, I expected the marriage between head coach Bruce Arians and quarterback Jameis Winston to lead to a lot of big plays down the field. Winston averaged 8.5 air yards per attempt last season, 2nd-highest in the NFL behind his Bucs teammate Ryan Fitzpatrick. But Winston also ranked last in yards gained after the catch per completion, at 3.7, a residue of Tampa Bay’s downfield style.

Arians was known for constructive a similar offense, but so far this year, Winston is one of five passers averaging over 9 yards of YAC per completion. Is that sustainable over 16 games? We have no way of knowing, but it will be interesting to monitor. And thanks to PFR’s new advanced stats pages, we can.

For fun, I graphed the passers in 2018 and 2019 by their YAC per completion, with 2018 data on the X-Axis and 2019 data on the Y-Axis. Jimmy G and Pat Mahomes are in the upper right, with high YAC numbers in both ’18 and ’19. But Winston is on the upper left, with high YAC in ’19 but low YAC in ’18. [continue reading…]

{ 0 comments }

Luke Falk, who came on in relief for the Jets in week 2.

The Jets started Sam Darnold in week 1 at quarterback, but due to mono, New York was forced to start Trevor Siemian in week two. But in Siemian’s first start, he injured his ankle and was lost for the season. Now, the Jets turn to Luke Falk today to be the team’s third starting quarterback in just three weeks.

How rare is that? Excluding the 1987 season which featured replacement players during week three, the Jets will be just the 6th team since 1950 to start three different quarterbacks in the team’s opening three games.

In 2016, as the Browns embarked on an 0-16 season, Cleveland started Robert Griffin in week 1, Josh McCown in week 2, and Cody Kessler in week 3.  Both changes were the result of injury, with Griffin suffering a broken bone in his shoulder and McCown breaking his collarbone.

In 2008, the soon to be 2-14 Chiefs went with Brodie Croyle at quarterback to open the season, Damon Huard, and finally Tyler Thigpen in week 3. Croyle suffered a shoulder injury in week one, while Huard had a neck/head injury in week two, leading to Thigpen’s promotion to starting quarterback.

In 1997, the Jaguars had a rough start to the year beginning in the preseason. Starting quarterback Mark Brunell suffered a knee injury during the preseason which sidelined him for a few weeks. As a result, Rob Johnson wound up starting week 1, but suffered a high ankle sprain that caused him to miss the following week. Steve Matthews would start for the team in week 2, and following a week 3 bye, Brunell returned as the starter in week 4. Jacksonville won all three games and went 11-5 that season.

In 1988, Bernie Kosar started for the Browns in week 1, but injured his elbow and was replaced by Gary Danielson. In week 2, Danielson started but played poorly in the last game of his NFL career; he was replaced by Mike Pagel, who would start in week 3. Cleveland would finish the season 10-6, with Kosar starting nine games.

Finally, in 1976, the Rams started three different quarterbacks. Starter James Harris injured his thumb in the preseason, leading Ron Jaworski to open the season as the starter. But Jaws was injured in week 1, leading Pat Haden to start in week 2 for Los Angeles. By the third game, Harris was back, and the Rams would finish the year 10-3-1.

And that’s it. The Jets are now the 6th team to have to start three different quarterbacks to open the season, and none of the first five teams had to start four different quarterbacks in its first four games.

{ 0 comments }

Largest Point Spreads in Franchise History

Did you know: Detroit, Tampa Bay, and Cleveland have never been 14-point favorites in any game since 1978? In December 1995, facing the expansion Jaguars quarterbacked by backup Steve Beuerlein, the Lions were 13-point favorites.  That is the largest points spread the team has had since ’78, and the playoff-bound Lions won 44-0.

In 2005, in a game against the Katrina Saints with backup Todd Bouman, the Bucs were 13-point favorites. This was the last game of the regular season, and the host Bucs scored a late defensive touchdown to cover, 27-13.  Tampa Bay would finish the year 11-5.

And finally, we have the Browns.  In 1995, against those same expansion Jaguars, the old Browns were 13.5 point favorites coming off of a bye.  But for the first time, a Bill Belichick-led favorite was shocked by a Tom Coughlin-led underdog, as the Jaguars won 23-15.  From a points spread perspective, this was actually a bigger upset than the 2007 Super Bowl!  The largest points spread for the new Browns came in the final game of the 2007 season, where Cleveland beat San Francisco 20-7 as 11.5-point favorites.

The table below shows the largest points spread for each team in a game since 1978. [continue reading…]

{ 0 comments }

Luke Falk, the Patriots, and Scott Zolak

Luke Falk, who came on in relief for the Jets in week 2.

On Sunday, the Jets will be a sacrificial lamb for the enjoyment of 70,000 fans in Foxboro. New York is a 23-point underdog to the Patriots, making this one of the largest point spreads in NFL history.  The Jets have lost 12 straight regular season games in Gilette Stadium to the Tom Brady Patriots, with the last victory coming back in 2006 (during this span, the Jets beat New England once without Brady, in ’08, and also in the 2010 playoffs). 

Remarkably, New York was an underdog of over 2 TDs in each of the team’s last three games in New England, and a 3-TD underdog against the ’07 Patriots. And yet it is Sunday’s matchup that brings the largest points spread in Jets history. The table below shows the points spread in each Jets game in Foxboro during Brady’s time with the team prior to 2019 (as for 2001, that is not included; the Jets game in Foxboro that year was the origin story for Brady).

 
Vegas Vegas Vegas Vegas
Tm Year Date Opp Week G# Day Result Spread vs. Line Over/Under OU Result
NYJ 2018 2018-12-30 @ NWE 17 16 Sun L 3-38 14.5 not covered 46.5 under
NYJ 2017 2017-12-31 @ NWE 17 16 Sun L 6-26 17.0 not covered 43.5 under
NYJ 2016 2016-12-24 @ NWE 16 15 Sat L 3-41 17.0 not covered 45.0 under
NYJ 2015 2015-10-25 @ NWE 7 6 Sun L 23-30 7.5 covered 47.5 over
NYJ 2014 2014-10-16 @ NWE 7 7 Thu L 25-27 9.5 covered 44.5 over
NYJ 2013 2013-09-12 @ NWE 2 2 Thu L 10-13 11.5 covered 43.0 under
NYJ 2012 2012-10-21 @ NWE 7 7 Sun L 26-29 10.5 covered 47.0 over
NYJ 2011 2011-10-09 @ NWE 5 5 Sun L 21-30 7.5 not covered 50.0 over
NYJ 2010 2011-01-16 @ NWE 19 18 Sun W 28-21 9.5 covered 45.0 over
NYJ 2010 2010-12-06 @ NWE 13 12 Mon L 3-45 4.0 not covered 44.5 over
NYJ 2009 2009-11-22 @ NWE 11 10 Sun L 14-31 11.0 not covered 45.0 push
NYJ 2007 2007-12-16 @ NWE 15 14 Sun L 10-20 20.5 covered 41.0 under
NYJ 2006 2007-01-07 @ NWE 18 17 Sun L 16-37 9.0 not covered 38.5 over
NYJ 2006 2006-11-12 @ NWE 10 9 Sun W 17-14 10.5 covered 38.0 under
NYJ 2005 2005-12-04 @ NWE 13 12 Sun L 3-16 7.5 not covered 42.5 under
NYJ 2004 2004-10-24 @ NWE 7 6 Sun L 7-13 6.0 push 43.5 under
NYJ 2003 2003-09-21 @ NWE 3 3 Sun L 16-23 6.0 not covered 38.0 over
NYJ 2002 2002-12-22 @ NWE 16 15 Sun W 30-17 3.5 covered 41.0 over

But the most shocking thing to me isn’t that the Jets are heavy underdogs, but that the over/under for the game is just 43 points! This means that Vegas is setting the Over/Under on the Jets points total at 10 points, and the Patriots total at 33 points. I mean, I know the Jets are down to third-string quarterback Luke Falk, but a 10-point total for one team is really, really low.

Since 1978, there have only been 45 times where a team, based on the Vegas point spread and over/under, was projected to score under 11 points. The Jets against the Patriots will be the 46th, but New England has not always been on the positive side of things. Before there were Patriots fans, the team once traveled to Arrowhead Stadium in 1992 to face the mighty Chiefs.  Kansas City, with Neil Smith, Derrick Thomas, and Dale Carter, had a pretty good defense in those days, but the real issue was the Patriots offense.  Quarterbacked by Scott Zolak, the 2-11 Patriots had been shut out in back to back games entering the trip to Kansas City and had gained a total of 199 yards of offense.

So on December 13th, 1992, on a cold and rainy day, the Chiefs were favored to win by 16.5 points, and the over/under was 33 points. That means New England was expected to score only 8.25 points, with Kansas City projected to score 24.75 points. Kansas City ultimately won, 27-20, with the Patriots scoring touchdowns once on defense and once after a turnover gaave the team the ball at the 8-yard line.

[continue reading…]

{ 0 comments }

Previously:

In week 2, Cleveland, Kansas City, and Atlanta — with three high-profile quarterbacks — all went pass-happy. Arizona and Carolina — who also sport a pair of number one overall picks at quarterback, did the same. Cleveland dominated the Jets in a game that wasn’t really ever in doubt, and yet Baker Mayfield still wound up throwing on nearly two-thirds of all plays. In Kansas City, Patrick Mahomes was tasked to throw on over two-thirds of Chiefs plays, but hey – he’s Mahomes! The Falcons have Matt Ryan, and while he was inconsistent against the Eagles, Devonta Freeman rushed for just 22 yards on 11 carries. As a result, Atlanta threw on over 70% of its plays in a competitive game against Philadelphia, the highest pass ratio of any winning team in week two.

Meanwhile, Kyler Murray had 43 dropbacks and 3 rushing attempts against the Ravens, while RB David Johnson had just 7 carries. Arizona was trailing most of the way (-6.4 Game Script), but an 80% pass ratio is always going to stand out as pass-heavy.  Arizona and Kliff Kingsbury  had a similar Game Script in week 1 and threw on 72% of plays: it appears Arizona will not be easing into things for the number one overall pick. Finally, we have Carolina and Cam Newton, who is likely to miss week 3 with a lingering foot injury. Newton was obviously not at 100% in week 2 — he tied a career low with just 2 carries, and they gained 0 yards — and yet he tied a career high with 54 dropbacks! Christian McCaffrey (16 for 37) was not particularly effective on the ground, but this was a competitive game throughout. Normally, we suggest passing frequently in close games, but with an injured Newton, it’s fair to wonder if that was the right strategy.

The full week 2 Game Scripts below: [continue reading…]

{ 0 comments }

Can you spot the HOF QB?

Eli Manning has been benched by the Giants, which means he may have taken his last NFL snap. As of today, he ranks 7th all-time in passing yards and 8th all-time in passing touchdowns. Manning also ranks 6th all-time in pass attempts, and his career is one of the more unusual ones in NFL history. And that’s because when a quarterback stays with one team for so long, it usually means he was one of the best quarterbacks in the NFL.

Today I want to compare how Eli Manning has fared, statistically, to the rest of the NFL. Manning was the first pick in the 2004 Draft, and so I looked at all passing stats in the NFL from 2004 through week 2 of the 2019 season. [continue reading…]

{ 0 comments }

In week 1, the passing stats were once again remarkable: the league averaged 7.08 ANY/A and produced a passer rating of 100.2.

In week 2, though, things dipped down quite a bit to 5.96 ANY/A and a passer rating of 87.6. There are injuries to be discussed. Sam Darnold is out with mono and didn’t play last night. Nick Foles broke his left clavicle early in week one and is out indefinitely. In week two, two Hall of Fame quarterbacks went down: Ben Roethlisberger is out for the season with an injured right elbow, and Drew Brees is out for two months torn ligament in the thumb on his throwing hand.

There are also the Dolphins to be discussed. Ryan Fitzpatrick and Josh Rosen combined to be terrible: 7 passing first downs, 4 interceptions, and 7 sacks. And Eli Manning, Carson Wentz, and Derek Carr all had ugly weeks, too.

What did help week 2? The reigning MVP of the NFL, Patrick Mahomes. The best player in football put together a 2nd quarter for the ages on Sunday against the Raiders. Mahomes completed 12 of 17 passes, for a remarkable 278 yards (23.2 yards per completion) and 4 touchdowns, with no interceptions or sacks and *ten* first downs. Jimmy Garoppolo and his former mentor Tom Brady both had great weeks, but there’s no question who was the best quarterback in week two.

The table below shows the full passing stats: [continue reading…]

{ 0 comments }

Kliff Kingsbury Kicks, Kicks, And Kicks Again

Kliff Kingsbury, flirting with the apple of his eye

Week 2 of the 2019 NFL season. With 2 minutes left in the first quarter, trailing 7-0, Arizona faced a 3rd-and-1 from the Ravens 4-yard line. Kyler Murray threw an incomplete pass, setting up a 4th-and-1 from the same distance.

This is an obvious situation to go for it, particularly when you are a 13-point underdog. Only contortionists can concoct 4th-and-1 situations where going for it is a bad idea, and nobody can sustain that argument from the opponent’s 4-yard line in the first quarter. And yet, Cardinals head coach Kliff Kingsbury sent out Zane Gonzalez to kick a short field goal, cutting the lead to 7-3.

After the next Baltimore drive resulted in a field goal, Arizona again drove down the field. The Cardinals reached 3rd-and-goal from the 3-yard line, when Murray threw an incomplete pass. That set up 4th-and-goal from the 3, trailing 10-3 midway through the 2nd quarter. This was another obvious go-for-it situation, but once again, Kingsbury sent Gonzalez out to get three points. Over the last 10 years, NFL offenses have scored touchdowns on about 41% of 3rd (or 4th) and goal plays from the 3-yard line. And as we’ll see in a minute, a 41% success rate is far above the necessary rate to make going for it the correct decision.

On Arizona’s first drive of the second half, trailing 17-6, Arizona once again drove inside Baltimore’s 10-yard line. On 2nd-and-goal from the 5, Murray threw to Larry Fitzgerald. Incomplete. On 3rd-and-goal from the 5, Murray again failed to connect with Fitzgerald. Facing 4th-and-goal from the 5, the Cardinals again sent out Gonzalez for a third chip shot. The Ravens defense was then called for a delay of game, moving Arizona up to the 2-yard line. From there, Kingsbury — trailing by 11 in the 2nd half — kept Gonzalez on the field! In perhaps the most indefensible move of the day, Kingsbury chose to kick a field goal. Over the last 5 years, teams have converted half of these 3rd (or 4th) and goal plays from the 2 into touchdowns. [continue reading…]

{ 1 comment }

First NFL Starts By Backup Quarterbacks And The Point Spread

Minshew and Leach at Washington State

Jaguars rookie Gardner Minshew is making his first NFL start today, as Jacksonville starting quarterback Nick Foles is out with a broken left calvicle. Minshew replaced Foles in week 1 and promptly had one of the best passing performances any player has ever had in his first NFL game, at least if you don’t adjust for era. He completed 22 of 25 passes for 275 yards and 2 TDs with one interception, far exceeding how you would expect a rookie 6th round pick would perform in a season opener.

You might think this would mean Vegas would have high hopes for Minshew, who starred at Washington State under Mike Leach. Together with Minshew and his mustache, he “led the Cougars to 10 wins for the sixth time in program history.”

You might think that this would mean Vegas would be buying on Minshew today against Houston, but that’s not the case: the Jaguars are 8-point underdogs in Houston. Jason Lisk recently wrote about Minshew in the context of the point spread in games started by non-first round backup quarterbacks.

That made me wonder: what would cause a team starting a “player like Minshew” to be favored? I looked at all quarterbacks since 1978 who: [continue reading…]

{ 0 comments }

Passing First Down Rate: What’s Average?

In week 1, Russell Wilson completed 70% of his passes, going 14 for 20. But in the modern NFL, completion percentage is meaningless. What really matters is first down percentage. Wilson took 4 sacks, and only 6 of his 14 completed passes picked up a first down. Therefore, Wilson picked up a first down on only 25% of his 24 dropbacks! Passing first down percentage and completion percentage are supposed to measure the same thing — how well an offense can consistently move the ball via the pass — but there can occasionally be a huge chasm between those numbers.

To be sure, passing first down percentage is hardly a perfect stat. Wilson completed an 8-yard pass on a 1st-and-10, a 7-yard pass on a 1st-and-10, and even had an 11-yard completion to Chris Carson that doesn’t get recorded as a first down because Carson fumbled. On the other hand, 5 of his completions were clearly not successful: a -3 yard completion on 2nd-and-long, a 2-yard completion on 3rd-and-17, 5- and 6-yard completions on 3rd-and-9s, and an 11-yard completion on 3rd-and-26.

Using success rate instead of passing first down percentage would be an improvement — you’d move the two long gains on 1st-and-10 into the success range, and say that 8 of his 24 pass plays were successful. And, of course, this isn’t all the quarterback’s fault or blame: it’s not his fault that Carson fumbled, it’s possible some of the 4 sacks weren’t his fault, and almost nobody is completing a 3rd-and-26 (on the other hand, he probably shouldn’t get credit when his receiver makes a great catch, or his offensive line blocks for much longer than average, or his receiver gets wide open, etc.).

So let’s not let the perfect be the enemy of the good: passing first down percentage is much better than completion percentage, and let’s leave it at that. You can view some of the outliers in NFL history in these two stats here.

A year ago, I looked at the relationship between those two statistics, and so I wanted to update that through the 2018 season. [continue reading…]

{ 0 comments }

What Happens After The Blowout?

The Titans lose 59-0, falling to 0-6. And respond by winning 5 straight games.

In 2011, the Colts were the worst team in the NFL. During mid-season of the year that would be remembered as the ‘Suck 4 Luck’ campaign, Indianapolis reached its lowest moment on national television against the Saints. Facing the high powered New Orleans offense and Drew Brees, it was a mismatch from the opening gun: New Orleans won 62-7.

This was a very good Saints team — that win brought New Orleans to 5-2 — and if you were picking a team to win the next week, you probably would have picked the Saints. The Saints were favored by 14 points against the Rams, but were upset, 31-21.

In 2014, the Matt Ryan-led Atlanta Falcons dominated the Bucs in a Thursday Night massacre. Atlanta won 56-14 in a game where the victors produced a record Game Script of 32.6! At 2-1, Atlanta looked like a team on the rise, but the Falcons lost in Minnesota the next week as 3-point favorites.

It feels inconceivable that a team could look so good one week and lose the next. And even more common is the team on the losing end of a humiliating loss turning things around immediately.

In recent years, the three worst blowouts were the Rams crushing the Raiders 52-0 in 2014, the Falcons demolition against the Bucs described above, and a 58-0 win by Seattle against the Cardinals. The very next week, Oakland, Tampa Bay, and Arizona not only all won, but all won as touchdown underdogs!

My favorite example comes from the 1983 Oilers. In 1982, Houston was terrible, going 1-8. They opened the ’83 season with 9 straight losses, and in the 10th game, lost to the Bengals 55-14 and trailed 48-0 after three quarters. And yet, the next week, as 6-point home underdogs, the Oilers won for just the second time in 20 games.

Okay, one more favorite example. In 2009, the Patriots destroyed the Titans, 59-0, on a snow-covered field in Foxboro. Tennessee dropped to 0-6 after the game, and switched quarterbacks from Kerry Collins to backup Vince Young. The Titans responded by winning five straight games!

In week 1, the Ravens dominated a Miami team that most assume is tanking. Baltimore finished the game with a remarkable +30.0 Game Script, qualifying by any measure as one of the biggest blowouts in recent memory. And while our eyes say Baltimore (a 13.5-point favorite at home against Arizona) and Miami (a 19-point underdog at home against the Patriots) will have similar performances in week two, history says we should exercise some caution in our projections. [continue reading…]

{ 1 comment }

Seven years ago, Neil Paine provided the formula for predicting the expected winning percentage for the home team at the start of a game, based on the Vegas point spread.  There were only 5 upsets where the favorite list, and a sixth game that was a tie with a 2.5-point spread.  The six biggest favorites all won, making this a pretty by-the-book week.

The table below shows the results of each game from the perspective of the home teams in week 1.  The “Expected W%” column shows the expected winning percentage of the home team based on the Vegas point spread; the Eagles were -10.5, so Philadelphia had a 78% chance of winning; the Dolphins were +7, so they had a 31% chance of winning.  The final column shows how likely or unlikely the result was: if the favorite won, the expected winning percentage number was used; if the favorite lost, the expected winning percentage of the underdog was used.  So when the Browns lost, that game gets marked as a 35% likelihood game. [continue reading…]

{ 0 comments }

The Game Scripts are back! As a reminder, a Game Script is simply the average score of a game over each second of play during the game. And if you are like me, as you watched the Dolphins/Ravens game unfold, you were wondering what would the final Game Script be from that massive blowout.

The Ravens took a 7-0 lead less than five minutes into the game, and that jumped to 14-0 before the 8-minute mark, 21-0 before the 11-minute mark, and 28-0 after just 16 minutes. Baltimore got the lead up to 42-10 at halftime, and scored three times in the second half to walk away with a 59-10 win. Over the course of the 3,600 seconds of this game, Baltimore’s average lead was 30.0 points.

That’s the best Game Script by a team since this Rams/Raiders blowout in 2014, a 52-0 win that registered a 30.9 Game Script. [continue reading…]

{ 2 comments }

Jackson squished the fish on Sunday

After every week, I post the weekly passing numbers to look at which passers produced the best stats of the week. The formula is pretty simple.

It begins with Adjusted Net Yards per Attempt, which is (Passing Yards + 20*Passing TDs – 45*INTs – Sack Yards Lost) divided by (Pass Attempts + Sacks). Let’s begin with the best passing performance of week one, which belongs to Ravens second-year quarterback Lamar Jackson. Baltimore’s young quarterback went 17/20 for 324 yards with 5 TDs and 0 INTs, while taking 1 sack and losing one yard. That means Jackson had 423 Adjusted Net Yards on 21 dropbacks, or 20.14 Adjusted Net Yards per Attempt.

The NFL as a whole in week 1 averaged 7.08 ANY/A, which sets our baseline for average play. This means Jackson was 13.06 ANY/A above average over 21 dropbacks, which means he produced 274 Adjusted Net Yards of value over average. That, of course, was the most in the NFL.

It also harkens back to one of the greatest performances in NFL history by another Baltimore quarterback: Johnny Unitas. Historians have long regarded Unitas’s game against the 1967 Falcons as one of the best ever, and the stats confirm that.  In a ‘glitch in the matrix’ moment, the old Baltimore QB went 17/20 against the Falcons that day, for 370 yards with 4 TDs and 0 INTs. Both Unitas and now Jackson are part of the extremely rare 20/20 club: averaging 20 Adjusted Net Yards per Attempt on 20+ pass attempts. In fact, Baltimore has been involved in all three games: Unitas against the Falcons in ’67, Jackson against the Dolphins in week 1 of 2019, and what is the greatest statistical game in NFL history: Joe Namath (in a shootout with Unitas) against Baltimore in 1972.

The full week 1 passing stats below: [continue reading…]

{ 0 comments }

The Vikings Win With A Very Odd Gameplan

Minnesota opened its season with two Kirk Cousins pass plays resulting in a touchdown. The Vikings third offensive play of the season was a pass play, as was the team’s fifth.

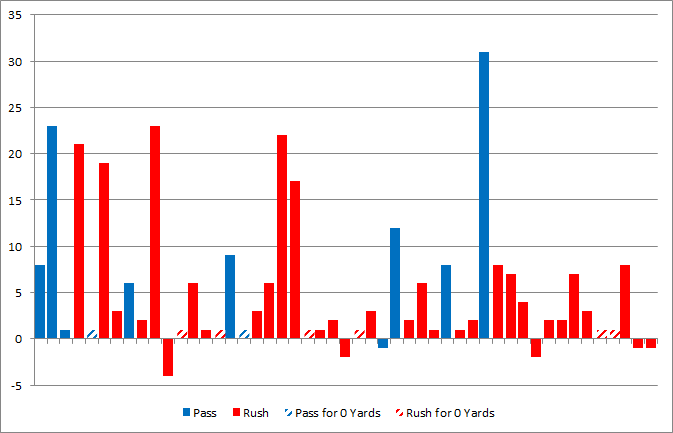
Opening the season with 4 passing plays on the first 5 plays from scrimmage is hardly unusual.  What is unusual is what happened next.   On the Vikings final 44 plays of the day, Minnesota finished with 7 passing plays and 37 rushing plays!  On a drive against the Saints last season, Kirk Cousins went 8-for-10 with 1 sack and 1 touchdown; for the entire game on Sunday, Kirk Cousins went 8-for-10 with 1 sack and 1 touchdown!

The team ran 49 plays on Sunday in a 28-12 win over the Falcons.  Here are the results of those plays, in order, with pass plays in blue and rushing plays in red.  Also, because plays of 0 yards would otherwise not show up on the graph, I’ve noted them separately as 1-yard plays with diagonal shading.

The Vikings did not attempt a pass in the 4th quarter of the game, which is the sort of thing you can do when you lead 28-0 after three quarters.  Still, this was remarkable: the Vikings passed on just 22% of all plays. [continue reading…]

{ 0 comments }

Eli Manning is going to be the Giants starting quarterback today, for the 15th consecutive season opener. Drew Brees and Philip Rivers are the week 1 starters for the Saints and Chargers, respectively, for the 14th straight year. The 2019 season marks the 12th time in a row that Matt Ryan and Aaron Rodgers opened up under center for the Falcons and Packers. And Matthew Stafford is Detroit’s opening game starter for the 11th straight year.

Those six teams have had the same week 1 starter for over a decade; meanwhile, 11 teams are turning to a different week 1 starter than they had this time last year. We can group them into three categories:

The Returning Starters (5): Baker Mayfield, Josh Allen, and Lamar Jackson were first round picks in the 2018 NFL Draft and ended their rookie seasons as starting quarterbacks; they will all be starting for their teams in week one of the 2019 season. Carson Wentz is the Eagles franchise quarterback, but he wasn’t fully recovered from the torn ACL injury that ended his 2017 season in time for the 2018 season opener. Jameis Winston was suspended for three games to begin the 2018 season for violating the NFL’s personal conduct policy, in connection with a female Uber driver accusing Winston of groping her.

The Rookie (1): Kyler Murray was the first overall pick in the 2019 NFL Draft, and he will start for the Cardinals in week one. There were two other first round quarterbacks — Daniel Jones in New York, Dwayne Haskins in Washington — and it is likely that both will follow the Mayfield/Allen/Jackson path, finishing their rookie years as starters and being the opening day starter in 2010.

The New Veteran Starters (5): In Washington, Alex Smith was the starter in 2018, but after suffering a gruesome knee injury, his future is in doubt. The Redskins brought in Case Keenum to replace him. Keenum was Denver’s starter last year, and the Broncos brought in Joe Flacco to replace him, after Flacco lost his job to Jackson in Baltimore. With Wentz and Winston back as starters, that left Nick Foles and Ryan Fitzpatrick without jobs: Foles landed in Jacksonville to replace Blake Bortles (backup for the Rams), while Fitzpatrick is the starter in Miami with the Ryan Tannehill era (now a backup in Tennessee) over. Finally, the surprise retirement by Andrew Luck has left the Colts turning to 2018 backup Jacoby Brissett as the team’s starter.

For the Browns, Mayfield has so clearly entrenched himself as the team’s starting quarterback that it’s easy to forget that he wasn’t the starter entering last season. And while the dysfunction appears to be over, Mayfield will now be Cleveland’s 7th different starting quarterback in week 1 in 7 seasons, tying an NFL record. The ’13-’19 Browns are the fourth team to have 7 different opening day starting quarterbacks in 7 years, joining the Ravens from ’97 to ’03, the Chargers from 1987 to 1993, and the Colts from 1984 to 1990.

The table below shows each team’s week 1 starting quarterback in each year since 2010. [continue reading…]

{ 0 comments }

2019 Pre-Season Wins Totals: Who Rose And Fell?

Back in May, I produced implied Vegas team ratings from the points spreads released by CG Technology. Before the Thursday Night Kickoff game between the Packers and Bears (the less said about that game, the better), Vegas released the final over/under wins totals for each of the 32 teams.

Which made me curious: who are the biggest risers and fallers since May?

The graph below shows the 32 teams. On the horizontal X-Axis is the the expected margin of victory for each team over their 16 games, based on the points spreads released in May (the units are points per game differential).  This incorporates both strength of schedule and home field advantage — it is the actual expected score at the end of the game.  The Y-Axis shows the wins total for each team as of September 5th, which also of course incorporates SOS and HFA. [continue reading…]

{ 0 comments }

Do Running Backs Matter?

Seth Keysor highlights one of the great debates of football twitter in 2019 with four words, and then a bit wordier summary:

Running backs don’t matter.

Everyone who follows football closely has heard that statement or some version of it over the past few years. It’s an exaggerated claim that actually means something closer to this: Not only is running the ball much less important than passing the ball, but running back production is also so dependent on the blocking and offensive scheme that the ability of an individual running back doesn’t move the needle as much as other skill positions like quarterback, wide receiver and tight end. That’s a lot wordier than “running backs don’t matter,” though.

Whether running backs matter much is a difficult question to answer, but I think there’s one thing we can all agree on: they are much more important in fantasy football than real football. On the other hand, we should be careful not to go too far in the other direction and say that running backs don’t matter at all.

Let’s suppose that we think offense, defense, and special teams are worth 4 parts, 3 parts, and 1 part of a team. This makes the 11 starting players on offense worth 50% of the team. We don’t quite know how valuable a quarterback is, but let’s conservatively suggest that they’re worth double the average offensive player. That would make the quarterback position worth 8.3% of the team, leaving 41.7% for the other 10 offensive players (and they’re backups). If you think the quarterback is worth more than that, than there would be an even smaller pie for the rest of the offense. [continue reading…]

{ 0 comments }

Super Bowl Teams And Passing Efficiency

Over the last two days, I have argued that the value of a top passing offense is lower than it used to be. One natural counter to that might be, hey Chase, haven’t you noticed that Tom Brady and the Patriots tend to always win the Super Bowl?

But that’s not exactly as convincing an argument as you might think. The Patriots won the Super Bowl in 2014, 2016, and 2018. And let’s be super clear about what I’m saying: I am not saying that quarterbacks are not critical, just that they are less critical than they used to be! From 1958 to 1979, the team that won the NFL championship or Super Bowl had a Hall of Fame quarterback in all but two of those seasons.

So yes, Tom Brady may be winning Super Bowls, but that’s hardly evidence that quarterbacks matter more than ever. Especially when you consider that Brady being at his best has borne little relation to whether or not the Patriots win the Super Bowl.

The graph below shows the Patriots passing offense in each season from 2001 to 2018, measured by New England’s Adjusted Net Yards per Attempt average minus league average ANY/A. Yes, New England has had an above-average passing offense each year. The team has won 6 Super Bowls, and those dots are in gold and black. [continue reading…]

{ 0 comments }

More Thoughts On The Value Of A Passing Offense

This is Part 2 to yesterday’s post about how value is determined. Please read that before proceeding.

Here’s a hypothetical situation to consider. In a few months, the NFL owners get together and decide that passing is too easy, scoring is too high, and offenses are too good. As a result, they have agreed upon a drastic rules change: starting in the 2020 season, NFL defenses will be allowed to put 12 players on the field, while NFL offenses will still be constrained to 11 players.

This will significantly change the NFL landscape, of course. Scoring is going to plummet. Passing efficiency is going to tank, and rushing with any sort of consistency is going to be impossible.

Now, here’s a question. You are the Kansas City Chiefs with Patrick Mahomes, who — for the sake of this argument — has just completed his second consecutive MVP season. He’s the clear best quarterback in the NFL, but he will now be playing in an NFL where passing is going to be much, much harder.

Does this rule change help or hurt your team’s chances of winning?

Think about it for a minute.

*****************************

I can wait.

***************************** [continue reading…]

{ 1 comment }