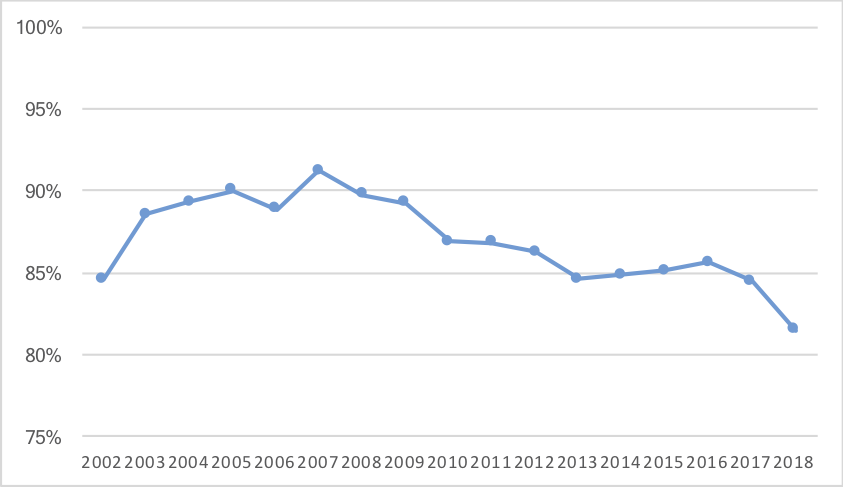
Yesterday, I wrote that NFL yards per carry is at an all-time high. But running backs — while performing very, very well — are not the only reason. In fact, running backs have been responsible for just 81% of all rushing yards this year, which is the lowest since at least 2002:
Rushing yards per carry continues to rise: a month ago, I noted that the league-wide yards per carry average was 4.34. If that held, it would set a new record, breaking the 4.29 mark set in 2011.
Since then, rushing efficiency has soared: since week 9, the Panthers are averaging over 6 yards per carry, 9 more teams are averaging over 5 yards per carry, and a total of 23 teams are averaging 4.29 YPC or better. The great rushing performance of the last month (4.61 YPC) has raised the 2018 league average mark to an incredible 4.44 yards per carry.
And yet, rushing quantity has never been lower. For the season, teams are rushing just 25.7 times per game, and even since week 9, that level is just 26.0 rushing attempts per game. This will go down as the season with the fewest rushing attempts in history, and also the season with the highest yards per carry average in history. The common theme here is passing: teams are passing more than ever, and defenses don’t seem very concerned about stopping the run. Offenses want to pass, and defenses are more than happy to allow teams to run (including via non-running back runs). That’s how you get crazy results like this.
And how crazy are these results? Well, take a look at the graph below, which shows every NFL season since 1932. Each year is on the X-Axis, and there are two Y-Axes: the left Y-Axis shows yards per carry, and the right Y-Axis shows rushing attempts per game. The NFL average yards per carry is shown in blue dots against that left Y-Axis, and the NFL rushing attempts per game is shown in red diamonds against the right Y-Axis.
Previously:
I am short on time this week, so just a few notes:
The Chargers won with a -6.5 Game Script in Pittsburgh, while the Titans beat the Jets at home despite a -8.2 Game Script. The worst Game Script this year by a winning team was Green Bay at -9.3 in the season opener; the Titans game is the second lowest, followed by the Bears against the Cardinals in week 3, the Panthers in Philadelphia in week 7, and the Chargers/Steelers game. [continue reading…]
On Sunday, the Jets lost to the Titans, 26-22. The Jets averaged 2.47 Adjusted Net Yards per Attempt, which is terrible; Tennessee averaged 7.05 ANY/A, which is a bit above average. In 2018, the average team is gaining 6.47 ANY/A. In other words, the Jets were 4.00 ANY/A below average, and Tennessee was +0.58 ANY/A above average.
Sadly for the Jets, that’s par for the course. There have been 21 games (out of 60) since the start of the 2015 season that the Jets were below average in passing offense and below average in passing defense. Here’s how to read the following graph:
X-Axis: Jets passing ANY/A, relative to league average
Y-Axis: Jets opponent’s passing ANY/A, relative to league average
Each year from 2015 to 2018 has a different data label, shown in the legend in the graph. But here’s the shorthand: dots to the left of the graph mean the Jets passing offense was bad; dots high in the graph mean the Jets passing defense was bad (because the opponent had a positive ANY/A relative to league average). Unfortunately for the Jets, things are getting worse: there are 6 large green dots (representing 2018) where the opponent was above average in ANY/A and the Jets were below average in ANY/A.
Here’s the raw data:
Year | G# | Opp | Result | ANY/A | Opp ANY/A | Lg Avg | RANY/A | Opp RANY/A |
---|---|---|---|---|---|---|---|---|
2018 | 12 | TEN | L 22-26 | 2.47 | 7.05 | 6.47 | -4 | 0.58 |
2018 | 11 | NWE | L 13-27 | 5.09 | 10.42 | 6.47 | -1.39 | 3.95 |
2018 | 10 | BUF | L 10-41 | 0.7 | 10.33 | 6.47 | -5.77 | 3.86 |
2018 | 9 | MIA | L 6-13 | 0.51 | 3.71 | 6.47 | -5.96 | -2.76 |
2018 | 8 | CHI | L 10-24 | 5.67 | 8.26 | 6.47 | -0.81 | 1.78 |
2018 | 7 | MIN | L 17-37 | 1.71 | 6.54 | 6.47 | -4.76 | 0.06 |
2018 | 6 | IND | W 42-34 | 8.19 | 5.72 | 6.47 | 1.71 | -0.75 |
2018 | 5 | DEN | W 34-16 | 8.87 | 6.16 | 6.47 | 2.4 | -0.31 |
2018 | 4 | JAX | L 12-31 | 4.43 | 9.3 | 6.47 | -2.04 | 2.83 |
2018 | 3 | CLE | L 17-21 | 2.15 | 4.63 | 6.47 | -4.32 | -1.84 |
2018 | 2 | MIA | L 12-20 | 5.68 | 6 | 6.47 | -0.79 | -0.47 |
2018 | 1 | DET | W 48-17 | 7.61 | 1.83 | 6.47 | 1.14 | -4.65 |
2017 | 16 | NWE | L 6-26 | 5.18 | 5.31 | 5.91 | -0.73 | -0.6 |
2017 | 15 | LAC | L 7-14 | 1.71 | 7.75 | 5.91 | -4.2 | 1.84 |
2017 | 14 | NOR | L 19-31 | 2.5 | 7.67 | 5.91 | -3.41 | 1.76 |
2017 | 13 | DEN | L 0-23 | -0.16 | 6.33 | 5.91 | -6.07 | 0.43 |
2017 | 12 | KAN | W 38-31 | 9.75 | 12.63 | 5.91 | 3.84 | 6.72 |
2017 | 11 | CAR | L 27-35 | 8.77 | 4.97 | 5.91 | 2.86 | -0.94 |
2017 | 10 | TAM | L 10-15 | 4.31 | 4.46 | 5.91 | -1.59 | -1.45 |
2017 | 9 | BUF | W 34-21 | 7.48 | 6.04 | 5.91 | 1.57 | 0.14 |
2017 | 8 | ATL | L 20-25 | 7.67 | 9.53 | 5.91 | 1.76 | 3.63 |
2017 | 7 | MIA | L 28-31 | 6.5 | 7.35 | 5.91 | 0.59 | 1.44 |
2017 | 6 | NWE | L 17-24 | 5.57 | 6.63 | 5.91 | -0.34 | 0.73 |
2017 | 5 | CLE | W 17-14 | 5.24 | 6.19 | 5.91 | -0.66 | 0.28 |
2017 | 4 | JAX | W 23-20 | 4.59 | 3.08 | 5.91 | -1.31 | -2.82 |
2017 | 3 | MIA | W 20-6 | 10.12 | 2.6 | 5.91 | 4.21 | -3.3 |
2017 | 2 | OAK | L 20-45 | 6.61 | 10.36 | 5.91 | 0.7 | 4.45 |
2017 | 1 | BUF | L 12-21 | 2.15 | 7.1 | 5.91 | -3.76 | 1.19 |
2016 | 16 | BUF | W 30-10 | 7.81 | 3.44 | 6.22 | 1.59 | -2.78 |
2016 | 15 | NWE | L 3-41 | -0.27 | 9.03 | 6.22 | -6.49 | 2.82 |
2016 | 14 | MIA | L 13-34 | 2.63 | 14.26 | 6.22 | -3.58 | 8.05 |
2016 | 13 | SFO | W 23-17 | 4.17 | 4.86 | 6.22 | -2.05 | -1.36 |
2016 | 12 | IND | L 10-41 | 2.61 | 12.07 | 6.22 | -3.61 | 5.85 |
2016 | 11 | NWE | L 17-22 | 9.36 | 6.52 | 6.22 | 3.15 | 0.3 |
2016 | 10 | LAR | L 6-9 | 4 | 4.7 | 6.22 | -2.22 | -1.52 |
2016 | 9 | MIA | L 23-27 | 3.78 | 5.23 | 6.22 | -2.44 | -0.98 |
2016 | 8 | CLE | W 31-28 | 6.72 | 5.56 | 6.22 | 0.51 | -0.66 |
2016 | 7 | BAL | W 24-16 | 8.48 | 3.13 | 6.22 | 2.26 | -3.09 |
2016 | 6 | ARI | L 3-28 | 2.82 | 7 | 6.22 | -3.4 | 0.78 |
2016 | 5 | PIT | L 13-31 | 6.44 | 9.48 | 6.22 | 0.22 | 3.26 |
2016 | 4 | SEA | L 17-27 | 2.93 | 10.24 | 6.22 | -3.28 | 4.02 |
2016 | 3 | KAN | L 3-24 | -1.86 | 6.89 | 6.22 | -8.08 | 0.67 |
2016 | 2 | BUF | W 37-31 | 11.14 | 10.39 | 6.22 | 4.93 | 4.17 |
2016 | 1 | CIN | L 22-23 | 5.08 | 8.08 | 6.22 | -1.13 | 1.86 |
2015 | 16 | BUF | L 17-22 | 2.18 | 6.07 | 6.26 | -4.08 | -0.2 |
2015 | 15 | NWE | W 26-20 | 8.21 | 5.94 | 6.26 | 1.95 | -0.33 |
2015 | 14 | DAL | W 19-16 | 6.68 | 0.46 | 6.26 | 0.42 | -5.81 |
2015 | 13 | TEN | W 30-8 | 8.54 | 5.4 | 6.26 | 2.28 | -0.86 |
2015 | 12 | NYG | W 23-20 | 7.79 | 6.92 | 6.26 | 1.53 | 0.65 |
2015 | 11 | MIA | W 38-20 | 9.32 | 5.51 | 6.26 | 3.05 | -0.76 |
2015 | 10 | HOU | L 17-24 | 3.02 | 8.36 | 6.26 | -3.24 | 2.1 |
2015 | 9 | BUF | L 17-22 | 4 | 4.9 | 6.26 | -2.26 | -1.36 |
2015 | 8 | JAX | W 28-23 | 8.36 | 6.26 | 6.26 | 2.1 | 0 |
2015 | 7 | OAK | L 20-34 | 5.74 | 11.47 | 6.26 | -0.52 | 5.21 |
2015 | 6 | NWE | L 23-30 | 7.88 | 6.61 | 6.26 | 1.61 | 0.35 |
2015 | 5 | WAS | W 34-20 | 9.54 | 2.69 | 6.26 | 3.27 | -3.58 |
2015 | 4 | MIA | W 27-14 | 6.66 | 2.49 | 6.26 | 0.39 | -3.78 |
2015 | 3 | PHI | L 17-24 | 3.07 | 4.41 | 6.26 | -3.2 | -1.85 |
2015 | 2 | IND | W 20-7 | 6.8 | 3.65 | 6.26 | 0.54 | -2.62 |
2015 | 1 | CLE | W 31-10 | 7.25 | 5.49 | 6.26 | 0.99 | -0.78 |
What do you think?
It was a rough week 13 for many franchise quarterbacks.
- Kirk Cousins picked up just 183 net passing yards on 46 dropbacks.
- Andrew Luck and the Colts were shut out.
- Cam Newton took four sacks and threw four interceptions.
- Drew Brees threw for just 111 net passing yards on 30 dropbacks.
- Matt Ryan gained only 97 net passing yards on 29 dropbacks.
- Aaron Rodgers had perhaps the worst yards/attempt game of his career.
But Patrick Mahomes was just fine, once against finishing as the top quarterback of the week. It was yet another 4-TD, 120+ passer rating game for Mahomes, the fifth of this season. By way of comparison, Jim Kelly and Joe Montana only had four such games in their entire careers. Mahomes now has had a passer rating of at least 110 in 10 of 12 games this year, the second most by a player through 12 games in history (2011 Rodgers did it 11 times).
Of course, none of those stats are adjusted for era. But Mahomes is having a top-4 season for a 2nd-year quarterback since the merger even once you adjust for era, and arguably a top-2 season depending on how you feel about 2013 Nick Foles and a 28-year-old Kurt Warner in 1999. No, it’s not Dan Marino 1984, but it’s pretty clearly the best season a 23-year-old quarterback has had since Marino.
The full week 13 passing stats below: [continue reading…]
Was this the worst game of Rodgers’s career? He had a game where he averaged 0.00 yards per attempt on one pass, but I don’t think you want to count that. He averaged 2.67 yards/attempt is a game against the Patriots in 2006, but he didn’t start the game and he threw just 12 passes. Maybe you prefer the 22-pass game against the 2015 Broncos as the worst Y/A game of his career, since he picked up just 3.5 yards per pass. Then again, there’s also this game against the Bills in 2014, where he averaged 4.4 yards per attempt on 42 passes; that feels even worse than the Denver game.
Because of the large variance in pass attempts, it’s hard to figure out what’s the worst Y/A game of a player’s career. But here’s one method I like: if you remove game X from a player’s career, how much does his career Y/A change? The game that causes the biggest change could be considered the best or worst game of that player’s career.
And by this methodology, the game against the Cardinals yesterday was in fact the worst game of Rodgers’s career. His career yards/attempt average is 7.840. Remove the game where he threw 1 pass for 0 yards, and his career Y/A is 7.841. If instead you removed the 12-pass Patriots game, Rodgers’s career average would be 7.851. If you instead removed the Denver game, his career average would be 7.858. If the one game from Rodgers’s career you had to remove was that Bills game, his career Y/A would rise to 7.867.
But if you want to get his career Y/A average to 7.87, then you need to take out yesterday’s game. That’s the game that has lowered his career average the most. Take a look: [continue reading…]
Of course, it’s important to know which statistics to examine. Mariota has completed 70.3% of his passes; before this year, his career best was a 62.2% rate as a rookie. But there are two factors that make his completion percentage meaningless: one, completion percentage is rising league-wide, and more importantly, Mariota has taken a ton of sacks.
He has a 12.8% sack rate this year, easily the worst of his career. What’s really remarkable is the interplay between his completion rate and his sack rate. Mariota has thrown just 71 incomplete passes all season, while he’s taken 35 sacks. That’s nearly a 2:1 ratio of incomplete passes to sacks! By way of comparison, AFC South rival Andrew Luck has a ratio of nearly 13:1 — he’s thrown 138 incomplete passes and taken only 11 sacks.
There have been seven games this season where a quarterback had more sacks than incomplete passes: Mariota is responsible for 3 of those 7, and all 3 were losses (all other quarterbacks are 3-1 in such games): [continue reading…]
The Bucs offense continues to fascinate me. Whether it’s Ryan Fitzpatrick or Jameis Winston, this passing offense continues to be very good but also very turnover prone. Tampa Bay has completed 67.0 percent of passes this season, but the Bucs have also thrown interceptions on 5.1% of all passes. We all know that interception rates have been falling and completion percentage rates have been rising over the last few decades. So let’s put these outlier stats in perspective.
Before the 2018 Buccaneers, the last two teams to have interception rates at 5% or higher were the 2013 Giants and 2010 Vikings. In other words, it’s pretty unusual for this era. And a 67.0% completion rate is pretty rare for older eras. Consider:
- The 1980 Houston Oilers, with a 35-year-old Ken Stabler, completed 63.9% of passes and threw an interception on 6.0% of passes; that’s the highest completion percentage in history among teams to throw an INT on 5% of passes, but the Bucs are currently on pace to shatter that mark.
- The 2001 St. Louis Rams, behind Kurt Warner, completed 68.8% of passes and threw an interception on 4.0% of passes. That’s the highest interception rate among teams to complete 67% of their passes or better; the 2010 Saints (68.1%; 3.3%) and 1993 49ers (67.6%; 3.2%) are the only other teams with a completion percentage above 67% and an interception rate higher than even 3%. The Bucs are currently blowing that mark out of the water, too.
The graph below shows the completion percentage (X-Axis) and interception rate (Y-Axis) for every team since 1950. I have put all of the 2018 teams, through 12 weeks, in red dots. And then the 2018 Bucs are the black dot at (67%, 5%): [continue reading…]
Previously:
Buffalo and Jacksonville played a remarkably run-heavy game in week 12. The two teams combined for 393 rushing yards and just 267 passing yards. That means 59.5% of the total yards in this game came on the ground, making it the first time in a non-December game since 2012 that such a high percentage of yards came on the ground. Josh Allen had 101 yards on the ground prior to kneels, and Blake Bortles added 39 yards rushing. These are two of the best running quarterbacks in the league, although the Bortles experiment may be ending in Jacksonville.
If this is the end for Bortles, he won’t be remembered as one of the best running quarterbacks ever, but perhaps he should be. He’s one of just six players in NFL history to average over 6 yards per carry and 20 rushing yards per game in his career (minimum 200 carries): [continue reading…]
You can hear me on the Bill Barnwell podcast today discussing this article on why possession in the NFL matters more now than ever before, but first, you have to hear me talk about the 2018 Jets.
Listen here
Or on iTunes
My segment begins at 29:25.
In 2008, Philip Rivers average 8.04 ANY/A, the best rate in the NFL. This season, Rivers is averaging 8.96 ANY/A, and yet he ranks just fourth in that metric in 2018. That’s a sign of how far the passing environment has changed in the last decade.
Drew Brees led the NFL in ANY/A in 2009 with an 8.31 average; he’s currently having his best statistic season (without adjusting for era), with a 9.69 ANY/A average that would rank as the second best of the modern era. He is the frontrunner in the MVP race, and for good reason: his team has the best record in football and he leads all QBs in ANY/A, a double feature that would surely lock up the MVP crown if it is still true by the end of the year.
Below are the season to date passing stats. [continue reading…]
Marcus Mariota went 22/23 against the Texas and he averaged 13.2 yards per attempt. That sounds like it should be one of the great games in NFL history. So how come the Titans scored just 17 points and lost despite such a high completion percentage and no turnovers until the team’s final offensive play? Tennessee even set a new record for completion percentage in a loss! One reason is that the team punted six times, and you might be wondering how is that even possible to have 6 times as many punts as incompletions.
For starters, Mariota took a whopping 6 sacks, a 21% sack rate. And 7 of Mariota’s 22 completions were negative plays according to EPA. That includes three obvious ones: a 4-yard completion on 3rd-and-19, a 7-yard completion on 3rd-and-9, and a 7-yard completion on 3rd-and-8. (Tennessee went for it on 4th-and-1 after that, but failed; the other four failed third down plays that yielded to punts were two Mariota sacks, a Mariota scramble for 8 yards on 3rd-and-16 after another Mariota sack, and a rushing play on 3rd-and-29 following a 15-yard facemask penalty and yet another sack.) But there was also a 2-yard pass on 1st-and-10, a -1 yard completion on 2nd down, a 2-yard completion on 2nd-and-10, and even a 3-yard completion on 2nd-and-5 is considered a negative play (you’d rather re-do the down than take a 3-yard gain on 2nd-and-5). All of the sudden, Mariota’s 22/23 game turns into 15 positive completions on 29 dropbacks, which is a far different story. That’s still a good game, but not a great one, much less an all-time great one.
Mariota finished with the 5th-best performance of the week; below are your week 12 passing stats. [continue reading…]
The college football regular season is over, with the exception of Army/Navy in two weeks. Below are the final ratings prior to the conference championship games: [continue reading…]
Nearly two decades ago, David Romer analyzed data from games during the 1999, 2000, and 2001 seasons. Doug Drinen wrote a series of articles about his paper, and one of Doug’s key takeaways was that the value of possession following a kickoff was worth +0.6 points to the receiving team. The natural extension of this is that it means a touchdown is worth 6.4 points and a field goal worth 2.4 points. That also means that a touchdown isn’t just 2.33 times (7 divided by 3) as valuable as a field goal, but 2.67 times as valuable.
Now how did Romer derive that value of +0.6 points? Or, as Doug wrote, what does it mean to say that it is worth +0.5 points to the team with the ball to have 1st-and-10 at your own 20?
The half-a-point value of a first at the 20 includes not only the points that you might score on that drive, but also the points your opponent might score with the field position you’re likely to give them if you don’t score, and the points you’re likely to score with the field position they give you after they do or don’t score, and so on.
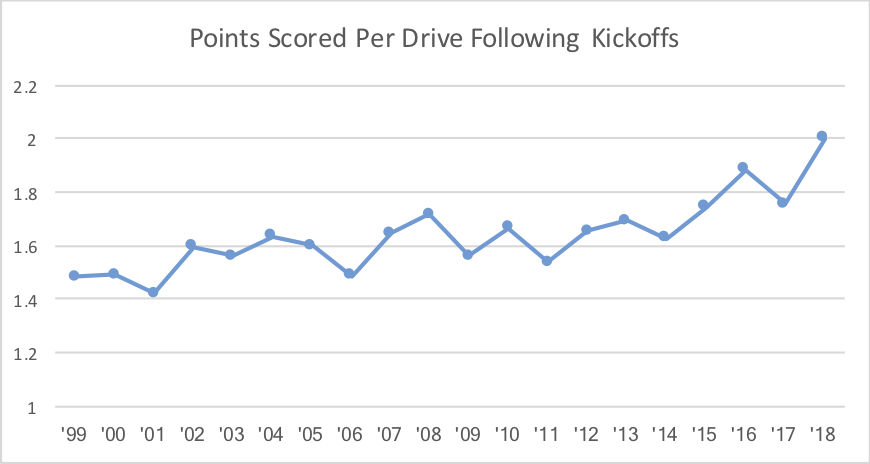
But we don’t need to go into the fine details of the system to get to what I want to talk about today. And that is possession has never been more valuable in the NFL. [1]One other reason: teams are better at making field goals, including from very far away, which means getting into likely field goal range requires less yardage than it used to for the offense.
The graph below shows the average points scored by the receiving team following a kickoff in each season since 1999. Note that this includes all quarters (Romer’s study was mostly limited to the first quarter) and all teams, and only includes points scored by the receiving team (Romer’s study focuses on net points (meaning points scored by the kicking team on the ensuing possession), so the numbers are of course lower). But the key is that teams are scoring more points after kickoffs than they did in the early ’00s.
References
↑1 | One other reason: teams are better at making field goals, including from very far away, which means getting into likely field goal range requires less yardage than it used to for the offense. |
---|
Every 1st down represents a new set of downs that gives a team a chance another small battle against the defense.
Take the Saints, for example. How many 1st-and-10s (or 1st-and-goals or 1st-and-longer than 10s) have they had this year? By my count, 339. How did I get there? New Orleans has had 105 drives this year (more on that in a moment) and 282 first downs this year. Now remember that in the NFL, a touchdown is also a first down, and the Saints offense has scored 48 touchdowns this year. Therefore, New Orleans has recorded 234 non-scoring first downs. Add in the 105 1st downs that began every drive, and this means the Saints must have had 339 sets of downs this season.
Let’s look at the Jets for another example. New York has had 126 drives, 153 first downs, and 18 offensive touchdowns. Therefore, the Jets must have had 261 new sets of downs with which to operate. This methodology should be a pretty accurate way of capturing the number of new sets of downs a team has, although it may be off by 1 or 2 for some teams. (For example, the Jets are probably at 260, not 261; one drive began with an interception but Trumaine Johnson fumbled the return.) You can’t use the actual number of first down plays, because teams often have multiple first down plays due to penalties on the same set of downs (think of a 1st-and-10 where a rusher gains 4 yards and a holding is called, and a team then has a 1st-and-16).
So to calculate the number of sets of downs a team has, you use this formula:
Drives + First Downs Made – Touchdowns
Now how do we calculate the number of drives? That’s pretty simple using the PFR Play Index.
Remember from our work on estimated drives, every drive ends in one of seven ways: [continue reading…]
In 2017, Indianapolis ranked 30th in points and 31st in yards. The Colts also ranked 29th in Net Yards per Attempt and 31st in touchdown passes.
This year, with Andrew Luck back, the Colts rank 5th in points and 9th in yards, while ranking 13th in NY/A and 2nd in touchdown passes. No offense has improved more from 2017 to 2018 than the Colts, and Luck is a big reason why.
Early on this season, it looked like there was something wrong with Luck; through 3 games, he was averaging just 5.34 yards per attempt! Since then, he’s upped his average to 7.63 yards per attempt; that’s actually below the median over that time frame, but coupled with his stellar sack rate and remarkable TD/INT numbers, and he’s been a very valuable quarterback over the last two months.
There are three remarkable Luck numbers this season, but chances are you have only heard of two of them. The Colts star has now gone five straight games without a sack, making him just the 5th player since 1981 to go five straight games with 20+ pass attempts and zero sacks. And Luck has thrown at least 3 touchdown passes in seven straight games, a feat that puts him in even rarer company.
But perhaps the biggest reason for the Colts success right now is how excellent Luck has been on third downs. On average, teams have picked up a first down on 36.9% of all third down pass plays this year. Luck has done it at a rate of 51.9%, making him the most valuable third down passer this season. [continue reading…]
Previously:
In week 11, the Ravens turned to Lamar Jackson, and responded with one of the most run-heavy games in recent memory. Baltimore rushed a whopping 54 times, the most in a non-overtime game since 2014. Jackson himself was responsible for half of those carries, 5 more than any player with at least five pass attempts in a game since 1950.
Not surprisingly, the Ravens dominated time of possession in this game, holding the ball for over 38 minutes. Jackson was an effective enough passer: he picked up a first down on 7 of 21 dropbacks, which is league average. We’ll see if this strategy can work for Baltimore once again — a quarterback running 15 times a week feels unsustainable, let alone 27 — but it certainly makes the Ravens more interesting.
Arizona and Jacksonville were your most run-heavy teams of the week. Leonard Fournette had 28 carries for the Jaguars, and the team rushed on 35.8% of all plays. For the Cardinals, David Johnson had 25 carries, and Arizona had just 21 dropbacks, despite trailing for much of the second half.
The full week 11 Game Scripts below: [continue reading…]
There have been two really remarkable upsets this season: one at the time, and one particularly in retrospect.
In week 3, the Bills went on the road and hammered the Minnesota Vikings, 27-6. Buffalo was a 16.5-point underdog; this season, no other team has won a game as an underdog of more than 10 points. It was an anomaly of historic proportions, marking the first time a team was ever a 15-point underdog and won by 15 or more points.
The other remarkable game was in week 1, when the Saints lost at home to Tampa Bay. The Bucs are 2-7 since that game, while New Orleans is 9-0. So while it was a huge upset at the time — it is tied with Titans/Jaguars as the second biggest upset of the season (10-point spread) — it’s even more remarkable in retrospect. [continue reading…]
The top 5 passers of week 11 consist of the three best QBs this season — Drew Brees, Patrick Mahomes, and Jared Goff — and the two quarterbacks who, at various times, have been considered the most valuable quarterback assets in the league: Andrew Luck and Aaron Rodgers.
Brees had zero sacks and zero interceptions while averaging over 12 yards per pass attempt and throwing for 4 TDs, making him the best passer of the week. Luck also had no sacks or interceptions, averaged over 10 yards per attempt, and threw 3 TDs. Rodgers averaged 11 yards per attempt and threw a pair of touchdowns, but his 5 sacks knocked him down below Luck. Mahomes had 478 yards and 6 TDs, but also 3 INTs and 3 sacks. Still, he averaged over 10 yards per attempt and threw 6 TD. It’s kind of a quirky stat, but Mahomes had by far the best passer rating in NFL history among players with at least 3 INTs in a game. Jared Goff took 5 sacks, but threw no interceptions and threw for 413 yards and 4 TDs.
The average ANY/A in week 11 was 6.24, making it a below-average week by 2018 standards. Below are the week 11 passing stats: [continue reading…]
Back then, I wrote about the best regular season matchups ever. And I’ve also written about the worst regular season matchups ever. And to be clear, there’s no right or wrong way to identify the best or worst matchup ever, even if you just base things on record.
You can’t use just winning percentage, because it’s hard to compare teams who have played a different number of games (is a matchup of two 3-0 teams better than a matchup of two 9-1 teams? I don’t think so, but winning percentage says otherwise). One solution is to add 11 games of .500 football to each team; in other words, add 5.5 wins and 5.5 losses to each team. For the Chiefs and Rams, that would make both teams 14.5-6.5, which translates to an adjusted winning percentage for both Kansas City and Los Angeles of 0.690. A game between two 3-0 teams would have an average adjusted winning percentage of only 0.607, which is one reason why I like this formula.
So where does Rams/Chiefs rank? With all due respect to the classic 49ers/Browns games from 1948, I’m limiting today’s post to games since 1950. And tonight’s matchup is the 20th best game during that period. The table below shows the best matchups in the NFL since 1950. Each game is listed from the perspective of the winner, and displays each team’s each team’s adjusted winning percentage and the average of the two adjusted records. Finally, I’ve included a linkable boxscore to each game. [continue reading…]
Ohio State has beaten Michigan 13 times in the last 14 years. And the only time since 2003 that Michigan beat Ohio State was in 2011, when the Buckeyes were 6-6 and in the bridge year between Jim Tressel and Urban Meyer. And Ohio State nearly pulled off the upset!
For a rivalry known as The Game, it’s been remarkably one-sided for a long time: the last time Michigan beat an Ohio State team of any note, Santonio Holmes and Braylon Edwards were the stars of the game. It’s been awhile.
And yet, this year, both teams are likely in control of their own destiny. The winner of Saturday’s matchup will win the Big 10 East, and head to Indianapolis to face Northwestern in the Big 10 title game. A win there all but guarantees a playoff spot for a 12-1 Michigan team, and a 12-1 Ohio State team would be a favorite to make the college football playoff, too.
Here’s how I’d rank each team’s chances of being one of the four to make the College Football Playoff. Read it as such: keep going down the list until you find four teams that actually exist.
1. SEC Champion Alabama
2. ACC Champion Clemson
3. SEC Champion Georgia
4. 12-0 Notre Dame
5. B10 Champion Michigan
—– Those 5 teams are all “win out and they’re in”, although I note that if Georgia narrowly beats Alabama in an epic SEC Championship Game, there will be some murmurs to take an 12-1 Alabama over a 12-1 Michigan. Both teams will have lost to two playoff teams (Georgia, Notre Dame), and Alabama had been more dominant throughout the season. But the committee seems to value conference championships pretty highly, so I think they would go with Michigan.
6. 12-1 Bama (losing in the SEC Championship Game)
7. 12-1 Big 10 Champion Ohio State
8. 12-1 Big 12 Champion Oklahoma
—– This is the real pressure point for the committee: do you take a 12-1 Ohio State over a 12-1 Oklahoma? The Buckeyes have a much, much worse loss and arguably a tougher schedule. Oklahoma is, subjectively, a better team, too. But the Big 10 has been the better conference this season, and my gut is the committee would take Ohio State at 12-1 over Oklahoma at 12-1. I’d go the other way.
9. 12-1 Pac-12 Champion Washington State
—– Last year, the Pac-12’s best team was USC, and the Trojans playoff hopes were dashed with a Friday night loss on the road against Washington. This year, the Pac-12’s best team is Washington State, and the conference’s best chance to send a team to the playoff was crushed by a Friday night road loss to … USC. Washington State has had a great year, but there are zero notable non-conference games and the Pac-12 as a whole is a down conference. As such, even going 12-1 isn’t enough if there’s a 12-1 conference champion (or a 12-0 Notre Dame or a 12-1 Alabama) still out there.
10. 12-1 Clemson (L-ACCCG)
11. 11-1 Notre Dame
—– Chaos needs to ensue for us to get here.
12. 13-0 UCF
13. B12 Champion West Virginia
Below are the college football SRS ratings through 12 weeks. [continue reading…]
Aaron Rodgers has thrown just one interception in 10 games this year. That’s 1 interception on a league-high 385 pass attempts. And this was it:
Poyer pick!#BUFvsGB #GoBills pic.twitter.com/IqzcIdHtFn
— Buffalo Bills (@buffalobills) September 30, 2018
Damon Huard (2006) holds the current record for interception rate in a season at 0.4%; he threw 1 interception on 244 passes, so to beat him, a quarterback would need to either throw no interceptions and 224 passes (to qualify), 1 interception on more than 244 passes, 2 interceptions on more than 488 passes, or 3 interceptions on more than 672 passes. Rodgers has 1 interception so far this year on 385 pass attempts (0.26%!); he has room to throw one more interception this year and still win the crown, but he probably doesn’t have wiggle room to throw two more.
Josh McCown (2013) had 1 interception on 224 pass attempts (0.4%), putting him second all-time on the single-season list. Tom Brady (2016), Nick Foles (2013), Tom Brady (2010), Dak Prescott (2016), Steve DeBerg (1990), Sam Bradford (2016), and David Garrard (2007) are the only other players to throw fewer than 1 interception for every 100 passes in a season, min 14 pass attempts per team game. (Oh, and Drew Brees has a 0.3% interception rate this year, too: he has 1 interception on 304 passes).
Interceptions rates have plummeted, of course, so it’s hard to truly compare this season by Rodgers to some of the low interceptions of years past. Here’s the league average interception rate in every season since 1970:
Another thing that makes Rodgers’ 2018 interception rate so interesting, particularly compared to Brees, is that Rodgers has thrown a lot of incomplete passes. In fact, he’s thrown more than twice as many incomplete passes as Brees — 147 to 69. The graph below shows every player this season with an interception (no regular quarterback has zero interceptions). The X-Axis shows interceptions; the Y-Axis shows incomplete passes. Rodgers really stands out here, and while you didn’t need the help finding him, I colored his dot in Packers colors:
Rodgers is tied with Joe Flacco for the league lead in incomplete passes at 147, and yet he is also tied with Brees for the fewest interceptions among qualifying passers. That’s how extreme Rodgers has been this year. Consider that Rodgers has thrown an interception on just 0.7% of his incomplete passes; Brees ranks second with an interception on 1.4% of his passes, and nobody else has thrown an interception on fewer than 2.8% of interceptions. Huard in 2006 (1.0%) currently has the record for interception rate on incomplete passes, and that’s another mark Rodgers has in his sights.
It’s been an up-and-down year for Rodgers. For example:
- His winning percentage is below .500, the worst of his career since his first year as a starter in 2008.
- His touchdown rate is below 5.0% for the first time in his career.
- His completion percentage is 62%, the second lowest of his career.
On the other hand, his sack rate is slightly better than his (not very good) career average, his yards/attempt is slightly better than (his remarkably good) career average, he’s averaging more passing yards/game than any season other than 2011, and he’s posting by far the best interception rate of his career, which has been littered with remarkable interception rates.
Rodgers entered the season with a remarkable TD/INT ratio, and it’s only gotten better. He’s now at 4.20/1, easily the best in history (only Brady and Russell Wilson — both are at 3.02 to 1 — have more than 3 touchdown passes for every interception). And while it’s been a rough year for Rodgers, he’s in position to set a new record in 2018.
Last night, Mike McCarthy decided to punt on 4th-and-2, from the Green Bay 33-yard line, with 4:20 remaining and the Packers trailing the Seahawks 27-24. Aaron Rodgers never again took the field, as Seattle picked up two first downs and ran out the clock.
Since 2008, there have been 17 examples where a team trailed by 1-7 points, in the final 5 minutes of the game, and punted on 4th and short (1, 2, or 3 yards).
Three times, those teams won: JaMarcus Russell and the Raiders pulled it off against the Broncos in 2009, Russell Wilson and the Seahawks famously defeated the Patriots in 2012 in this situation, and Derek Carr and the Raiders pulled it off against the Chiefs in 2017.
In his career, Rodgers has had 99 cases where the Packers had a 3rd-and-2 or 4th-and-2 from at least 30 yards away from the end zone. Green Bay picked up a first down 55% of the time.
What do you think?
Previously:
No time for commentary from me today, but here are the Week 10 Game Scripts.
Team | H/R | Opp | Boxscore | PF | PA | Margin | Game Script | Pass | Run | P/R Ratio | Op_P | Op_R | Opp_P/R Ratio |
---|---|---|---|---|---|---|---|---|---|---|---|---|---|
BUF | @ | NYJ | Boxscore | 41 | 10 | 31 | 20.4 | 27 | 46 | 37% | 37 | 18 | 67.3% |
NOR | @ | CIN | Boxscore | 51 | 14 | 37 | 20.3 | 27 | 47 | 36.5% | 27 | 16 | 62.8% |
PIT | CAR | Boxscore | 52 | 21 | 31 | 19.4 | 28 | 30 | 48.3% | 34 | 22 | 60.7% | |
CHI | DET | Boxscore | 34 | 22 | 12 | 15.3 | 31 | 22 | 58.5% | 48 | 24 | 66.7% | |
TEN | NWE | Boxscore | 34 | 10 | 24 | 12.3 | 27 | 36 | 42.9% | 46 | 19 | 70.8% | |
GNB | MIA | Boxscore | 31 | 12 | 19 | 9.5 | 30 | 25 | 54.5% | 43 | 23 | 65.2% | |
CLE | ATL | Boxscore | 28 | 16 | 12 | 8.5 | 21 | 29 | 42% | 54 | 19 | 74% | |
KAN | ARI | Boxscore | 26 | 14 | 12 | 8 | 33 | 23 | 58.9% | 44 | 25 | 63.8% | |
IND | JAX | Boxscore | 29 | 26 | 3 | 7 | 29 | 23 | 55.8% | 38 | 34 | 52.8% | |
LAC | @ | OAK | Boxscore | 20 | 6 | 14 | 5.8 | 27 | 26 | 50.9% | 41 | 21 | 66.1% |
WAS | @ | TAM | Boxscore | 16 | 3 | 13 | 4.4 | 29 | 26 | 52.7% | 43 | 24 | 64.2% |
DAL | @ | PHI | Boxscore | 27 | 20 | 7 | 3.7 | 40 | 28 | 58.8% | 46 | 16 | 74.2% |
LAR | SEA | Boxscore | 36 | 31 | 5 | 0.5 | 41 | 23 | 64.1% | 30 | 34 | 46.9% | |
NYG | @ | SFO | Boxscore | 27 | 23 | 4 | -1.5 | 32 | 23 | 58.2% | 39 | 29 | 57.4% |
For purposes of grading each team’s passing attack in each season since 2002, let’s look at where each team ranked in Adjusted Net Yards per Attempt. Next, let’s group teams into 5 buckets of four teams each based on the following ranks:
— Best passing offenses — i.e., the teams that rank 1, 2, 3, and 4 in ANY/A
— Good passing offenses — those teams that rank 8, 9, 10, and 11
— Average passing offenses — teams that rank 15, 16, 17, and 18
— Bad passing offenses — teams that rank 22, 23, 24, and 25
— Worst passing offenses — teams that rank 29, 30, 31, and 32
I went ahead and calculated the ANY/A of those teams for each season since 2002. In the graph below, I’ve plotted the results, taking the average ANY/A of those teams.
The most remarkable part of this: in 2018, the teams that rank 22nd, 23rd, 24th, and 25th in pass efficiency have an average ANY/A of 5.86. In 2002 and 2003, the teams that ranked 8th, 9th, 10th, and 11th in ANY/A had average ANY/A of 5.82 (’02) and 5.84 (’03). Those same teams are at 7.17 this year.
What stands out to you?
In March, the Jets inexplicably signed Josh McCown to a 1-year, $10M contract.
A few days later, the Jets sent three 2nd round picks along with the 6th pick in the 2018 Draft to Indianapolis to move up to the 3rd spot. That made the McCown signing even more odd in retrospect:
Why did Maccagnan waste $10M on Josh McCown? That is going to be one of the more puzzling moves of the season in hindsight.
— Football Perspective (@fbgchase) March 17, 2018
The Jets have mucked up the quarterback position for as long as anyone can remember, and you can add giving McCown $10M to Mike Maccagnan’s tab next to “trading up for Bryce Petty,” “using a second round pick on Christian Hackenberg”, and “sending a fortune to get a top-3 quarterback prospect”, and “getting into a stalemate with a journeyman quarterback and then giving him $12M.”
On Sunday, McCown was the worst quarterback in football. Paying $10M to a quarterback coach is not justifiable, and paying $10M to a quarterback mentor — whose mentees include Hackenberg, Petty, Johnny Manziel, and Mike Glennon — only works if he can be a great backup quarterback on a team in need of a great backup quarterback.
The full week 10 passing stats below:
Rk | Quarterback | Tm | Opp | Result | Att | Yds | TD | Int | Sk | Yds | ANY/A | VALUE |
---|---|---|---|---|---|---|---|---|---|---|---|---|
1 | Ben Roethlisberger | PIT | CAR | W 52-21 | 25 | 328 | 5 | 0 | 1 | 6 | 16.23 | 243 |
2 | Mitchell Trubisky | CHI | DET | W 34-22 | 30 | 355 | 3 | 0 | 1 | 7 | 13.16 | 195 |
3 | Drew Brees | NOR | CIN | W 51-14 | 25 | 265 | 3 | 0 | 0 | 0 | 13 | 153 |
4 | Baker Mayfield | CLE | ATL | W 28-16 | 20 | 216 | 3 | 0 | 0 | 0 | 13.8 | 139 |
5 | Andrew Luck | IND | JAX | W 29-26 | 29 | 285 | 3 | 1 | 0 | 0 | 10.34 | 101 |
6 | Blake Bortles | JAX | IND | L 26-29 | 38 | 320 | 2 | 0 | 0 | 0 | 9.47 | 99 |
7 | Matt Barkley | BUF | NYJ | W 41-10 | 25 | 232 | 2 | 0 | 1 | 8 | 10.15 | 85 |
8 | Marcus Mariota | TEN | NWE | W 34-10 | 24 | 228 | 2 | 0 | 2 | 14 | 9.77 | 75 |
9 | Jared Goff | LAR | SEA | W 36-31 | 39 | 318 | 2 | 0 | 2 | 11 | 8.46 | 65 |
10 | Philip Rivers | LAC | OAK | W 20-6 | 26 | 223 | 2 | 1 | 1 | 1 | 8.04 | 32 |
11 | Carson Wentz | PHI | DAL | L 20-27 | 44 | 360 | 2 | 1 | 2 | 10 | 7.5 | 29 |
12 | Patrick Mahomes | KAN | ARI | W 26-14 | 28 | 249 | 2 | 0 | 5 | 37 | 7.64 | 25 |
13 | Jeff Driskel | CIN | NOR | L 14-51 | 3 | 45 | 0 | 0 | 0 | 0 | 15 | 24 |
14 | Eli Manning | NYG | SFO | W 27-23 | 31 | 188 | 3 | 0 | 1 | 8 | 7.5 | 20 |
15 | Aaron Rodgers | GNB | MIA | W 31-12 | 28 | 199 | 2 | 0 | 2 | 17 | 7.4 | 16 |
16 | Darius Jennings | TEN | NWE | W 34-10 | 1 | 21 | 0 | 0 | 0 | 0 | 21 | 14 |
17 | Ryan Fitzpatrick | TAM | WAS | L 3-16 | 41 | 406 | 0 | 2 | 2 | 8 | 7.16 | 13 |
18 | Logan Thomas | BUF | NYJ | W 41-10 | 1 | 15 | 0 | 0 | 0 | 0 | 15 | 8 |
19 | Brian Hoyer | NWE | TEN | L 10-34 | 1 | 7 | 0 | 0 | 0 | 0 | 7 | 0 |
20 | Julian Edelman | NWE | TEN | L 10-34 | 1 | 6 | 0 | 0 | 0 | 0 | 6 | -1 |
21 | Logan Cooke | JAX | IND | L 26-29 | 1 | 4 | 0 | 0 | 0 | 0 | 4 | -3 |
22 | Russell Wilson | SEA | LAR | L 31-36 | 26 | 176 | 3 | 0 | 4 | 35 | 6.7 | -5 |
23 | Teddy Bridgewater | NOR | CIN | W 51-14 | 1 | 0 | 0 | 0 | 0 | 0 | 0 | -7 |
23 | Taysom Hill | NOR | CIN | W 51-14 | 1 | 0 | 0 | 0 | 0 | 0 | 0 | -7 |
25 | Dak Prescott | DAL | PHI | W 27-20 | 36 | 270 | 1 | 0 | 4 | 31 | 6.48 | -16 |
26 | Alex Smith | WAS | TAM | W 16-3 | 27 | 178 | 1 | 0 | 3 | 8 | 6.33 | -16 |
27 | Joshua Dobbs | PIT | CAR | W 52-21 | 2 | -3 | 0 | 0 | 0 | 0 | -1.5 | -17 |
28 | Matt Ryan | ATL | CLE | L 16-28 | 52 | 330 | 2 | 0 | 2 | 19 | 6.5 | -20 |
29 | Dontrell Hilliard | CLE | ATL | W 28-16 | 1 | 0 | 0 | 1 | 0 | 0 | -45 | -52 |
30 | Tom Brady | NWE | TEN | L 10-34 | 41 | 254 | 0 | 0 | 3 | 23 | 5.25 | -71 |
31 | Derek Carr | OAK | LAC | L 6-20 | 37 | 243 | 0 | 0 | 4 | 40 | 4.95 | -79 |
32 | Nick Mullens | SFO | NYG | L 23-27 | 39 | 250 | 1 | 2 | 0 | 0 | 4.62 | -88 |
33 | Cam Newton | CAR | PIT | L 21-52 | 29 | 193 | 2 | 1 | 5 | 46 | 4.18 | -91 |
34 | Andy Dalton | CIN | NOR | L 14-51 | 20 | 153 | 1 | 2 | 4 | 24 | 2.46 | -106 |
35 | Matthew Stafford | DET | CHI | L 22-34 | 42 | 274 | 2 | 2 | 6 | 45 | 3.73 | -151 |
36 | Brock Osweiler | MIA | GNB | L 12-31 | 37 | 213 | 0 | 1 | 6 | 50 | 2.74 | -177 |
37 | Josh Rosen | ARI | KAN | L 14-26 | 39 | 208 | 1 | 2 | 5 | 42 | 2.18 | -206 |
38 | Josh McCown | NYJ | BUF | L 10-41 | 34 | 135 | 0 | 2 | 3 | 19 | 0.7 | -228 |
Total | 925 | 7144 | 50 | 18 | 69 | 509 | 6.87 |
This was another remarkable week for NFL passers, who completed 630 of 925 passes (68.1%) for 7,144 yards, with 50 TDs and just 18 INTs. That translates to a 100.9 passer rating, and there were 19 quarterbacks who had a passer rating of over 100 and threw 20+ passes. This came despite there being just 28 teams active in week 10! The quarterbacks took 69 sacks for 509 yards, and finished with a 6.87 ANY/A average. It was yet another remarkable passing week in the best passing season of all time.
Finally, let’s look at the full season passing stats: you have Philip Rivers at #4, and in front of him is a rival quarterback from his own division, a rival quarterback from his own city, and his former teammate. And the bottom three are all rookies, in a narrative twist from the “why are rookies all of the sudden good” trend we had seen in recent years:
Rk | Quarterback | Tm | Age | Att | Yds | TD | Int | Sk | Yds | ANY/A | Value |
---|---|---|---|---|---|---|---|---|---|---|---|
1 | Patrick Mahomes | KAN | 23 | 345 | 3150 | 31 | 7 | 17 | 95 | 9.28 | 994 |
2 | Jared Goff | LAR | 24 | 332 | 3134 | 22 | 6 | 19 | 114 | 9.09 | 895 |
3 | Drew Brees | NOR | 39 | 304 | 2601 | 21 | 1 | 9 | 71 | 9.28 | 859 |
4 | Philip Rivers | LAC | 37 | 272 | 2459 | 21 | 4 | 12 | 75 | 9.24 | 767 |
5 | Matt Ryan | ATL | 33 | 353 | 3015 | 21 | 3 | 24 | 163 | 8.32 | 672 |
6 | Ryan Fitzpatrick | TAM | 36 | 225 | 2199 | 17 | 9 | 13 | 69 | 8.68 | 509 |
7 | Ben Roethlisberger | PIT | 36 | 369 | 2888 | 21 | 7 | 12 | 79 | 7.65 | 423 |
8 | Aaron Rodgers | GNB | 35 | 355 | 2741 | 17 | 1 | 25 | 186 | 7.5 | 366 |
9 | Carson Wentz | PHI | 26 | 269 | 2148 | 15 | 3 | 23 | 156 | 7.39 | 248 |
10 | Mitchell Trubisky | CHI | 24 | 290 | 2304 | 19 | 7 | 18 | 114 | 7.32 | 242 |
11 | Deshaun Watson | HOU | 23 | 285 | 2389 | 17 | 7 | 30 | 149 | 7.19 | 206 |
12 | Russell Wilson | SEA | 30 | 247 | 1967 | 21 | 5 | 29 | 204 | 7.09 | 154 |
13 | Tom Brady | NWE | 41 | 371 | 2748 | 17 | 7 | 16 | 111 | 6.88 | 132 |
14 | Kirk Cousins | MIN | 30 | 363 | 2685 | 17 | 5 | 24 | 141 | 6.87 | 129 |
15 | Cam Newton | CAR | 29 | 292 | 2086 | 17 | 5 | 17 | 130 | 6.7 | 51 |
16 | Andrew Luck | IND | 29 | 371 | 2472 | 26 | 9 | 10 | 76 | 6.59 | 20 |
17 | Alex Smith | WAS | 34 | 301 | 2045 | 10 | 3 | 19 | 99 | 6.28 | -81 |
19 | Blake Bortles | JAX | 26 | 328 | 2341 | 12 | 8 | 18 | 89 | 6.16 | -130 |
20 | Andy Dalton | CIN | 31 | 312 | 2255 | 18 | 10 | 20 | 153 | 6.06 | -158 |
21 | Derek Carr | OAK | 27 | 320 | 2441 | 10 | 8 | 28 | 169 | 6.07 | -163 |
22 | Matthew Stafford | DET | 30 | 331 | 2385 | 16 | 8 | 29 | 181 | 6.01 | -189 |
23 | Eli Manning | NYG | 37 | 346 | 2565 | 11 | 6 | 32 | 239 | 6.02 | -195 |
24 | Brock Osweiler | MIA | 28 | 178 | 1247 | 6 | 4 | 16 | 124 | 5.48 | -205 |
25 | Joe Flacco | BAL | 33 | 379 | 2465 | 12 | 6 | 16 | 79 | 5.96 | -226 |
26 | Marcus Mariota | TEN | 25 | 203 | 1498 | 7 | 5 | 25 | 149 | 5.54 | -226 |
27 | Baker Mayfield | CLE | 23 | 285 | 1984 | 13 | 7 | 22 | 154 | 5.78 | -232 |
28 | Dak Prescott | DAL | 25 | 273 | 1930 | 11 | 5 | 32 | 184 | 5.71 | -253 |
29 | Jameis Winston | TAM | 24 | 148 | 1181 | 6 | 10 | 13 | 60 | 4.91 | -261 |
30 | C.J. Beathard | SFO | 25 | 169 | 1252 | 8 | 7 | 18 | 156 | 5.03 | -281 |
31 | Case Keenum | DEN | 30 | 330 | 2400 | 11 | 10 | 24 | 174 | 5.64 | -318 |
32 | Josh Allen | BUF | 22 | 139 | 832 | 2 | 5 | 21 | 167 | 3 | -566 |
33 | Josh Rosen | ARI | 21 | 208 | 1280 | 6 | 8 | 21 | 155 | 3.86 | -612 |
34 | Sam Darnold | NYJ | 21 | 289 | 1934 | 11 | 14 | 21 | 129 | 4.5 | -632 |
Lg Avg | 0 | 0 | 10467 | 78791 | 523 | 245 | 748 | 4912 | 6.54 | 0 |
What stands out to you?
The 2018 season is the greatest season in passing history. In week 10, prior to Monday Night Football, NFL passers have thrown 855 passes and completed 584 of them for 6,706 yards with 46 TDs and 16 INTs. That translates to an average passer rating of 101.8, which would make this in the running for the greatest single week for passing in history. A whopping 18 of the 26 starting quarterbacks this week had a passer rating of over 100!
But it’s not just the name brand quarterbacks that are doing well. Let’s exclude Carson Wentz and Jameis Winston, who began the season as backups in name only (Wentz was injured; Winston was suspended). And let’s not include Ryan Fitzpatrick, who is obviously having a very strong season for a “backup” quarterback.
And let’s ignore the first round rookie quarterbacks, who aren’t true backups in the way we think of the term. That leaves seven quarterbacks who by any definition qualify as backup quarterbacks: Brock Osweiler, C.J. Beathard, Derek Anderson, Blaine Gabbert, Josh McCown, Matt Barkley, and Nick Mullens. And so far this season, they have thrown more TDs than INTs and have completed over 60% of their passes:
In fact, backup quarterbacks now have a stat line that is roughly equal to league average from the early ’00s: a passer rating of 80.6 and an ANY/A average of 5.20. Four of these quarterbacks — in particular Barkley (on a salary of $790K for 2018), Mullens ($1.05M), Osweiler ($880K), Anderson ($1.1M) — are arguably replacement level (shockingly, the Jets are paying McCown $10M this season). And those four quarterbacks have an ANY/A average of 6.00 and a passer rating of 86.9!
2018 is truly a case of a rising tide lifting all ships.
Alabama is the best team in college football, and maybe the best team in a generation of college football.
Clemson is fantastic, and is the second best team in college football. A Crimson Tide/Tigers clash in the playoff for a fourth straight year is not going to surprise anyone.
Notre Dame is 10-0 and will make the playoff assuming the Irish can handle Syracuse and USC, two average teams.
That leaves one final spot for the playoff. Ohio State and Michigan are both 9-1 and will play in two weeks. The Buckeyes and Wolverines face Maryland and Indiana this week, so they should be 10-1 as they enter The Big Game for the final week of the regular season. The winner will have the inside track for that 4th spot, assuming they can handle Big 10 West division winner Northwestern in Indianapolis.
The Big 12 also has a pair of 1-loss teams in 9-1 Oklahoma and 8-1 West Virginia (due to Hurricane Florence, the West Virginia game against N.C. State was canceled). Michigan’s one loss was in South Bend, a better loss than Oklahoma’s neutral site loss to Texas. Oklahoma has arguably faced a tougher schedule and it will only get tougher: the Sooners will have to face West Virginia in Morgantown, and then possibly a rematch with West Virginia (or Iowa State) in the Big 12 title game. There seems to be no momentum for the Committee to vault a 12-1 Oklahoma over a 12-1 Michigan, but I suppose it’s at least on the table.
But both the Big 10 and Big 12 will have the possibility of a 1-loss champion, which will lead to some interesting debates for the final spot. My hunch is that the Committee would rank the 1-loss teams in the following order:
1. Michigan
2. Oklahoma
3. Ohio State
4. West Virginia
5. Washington State
Below are the single game results from week 10. As always thanks to Dr. Peter R. Wolfe for providing the weekly game logs.
Date | Tm_Conf | PF | Opp | PA | H/R | W/L | Diff | MOV | Opp_Conf | SOS | SRS |
---|---|---|---|---|---|---|---|---|---|---|---|
11-10-2018 | Minnesota_B10 | 41 | Purdue | 10 | Home | Win | 31 | 26 | B10 | 54.4 | 80.4 |
11-10-2018 | Alabama_SEC | 24 | Mississippi St | 0 | Home | Win | 24 | 21 | SEC | 58.8 | 79.8 |
11-10-2018 | Ohio State_B10 | 26 | Michigan St | 6 | Road | Win | 20 | 23 | B10 | 54.4 | 77.4 |
11-10-2018 | West Virginia_B12 | 47 | TCU | 10 | Home | Win | 37 | 29 | B12 | 47.9 | 76.9 |
11-10-2018 | Clemson_ACC | 27 | Boston College | 7 | Road | Win | 20 | 23 | ACC | 51.5 | 74.5 |
11-10-2018 | Washington St_P12 | 31 | Colorado | 7 | Road | Win | 24 | 25.5 | P12 | 45.6 | 71.1 |
11-10-2018 | Tennessee_SEC | 24 | Kentucky | 7 | Home | Win | 17 | 14 | SEC | 56.2 | 70.2 |
11-10-2018 | Georgia_SEC | 27 | Auburn | 10 | Home | Win | 17 | 14 | SEC | 54.1 | 68.1 |
11-10-2018 | Pittsburgh_ACC | 52 | Virginia Tech | 22 | Home | Win | 30 | 25.5 | ACC | 41.1 | 66.6 |
11-09-2018 | Boise St_MWC | 24 | Fresno St | 17 | Home | Win | 7 | 7 | MWC | 59.5 | 66.5 |
11-10-2018 | Texas_B12 | 41 | Texas Tech | 34 | Road | Win | 7 | 10 | B12 | 56.4 | 66.4 |
11-10-2018 | Northwestern_B10 | 14 | Iowa | 10 | Road | Win | 4 | 7 | B10 | 58.6 | 65.6 |
11-10-2018 | Oklahoma St_B12 | 47 | Oklahoma | 48 | Road | Loss | -1 | 0 | B12 | 65.2 | 65.2 |
11-10-2018 | Notre Dame_IND | 42 | Florida St | 13 | Home | Win | 29 | 25 | ACC | 40 | 65 |
11-07-2018 | Northern Illinois_MAC | 38 | Toledo | 15 | Home | Win | 23 | 20 | MAC | 43.2 | 63.2 |
11-10-2018 | Arkansas St_SUN | 44 | Coastal Car. | 16 | Road | Win | 28 | 27.5 | SUN | 34.5 | 62 |
11-10-2018 | Florida_SEC | 35 | South Carolina | 31 | Home | Win | 4 | 7 | SEC | 54.3 | 61.3 |
11-10-2018 | Penn State_B10 | 22 | Wisconsin | 10 | Home | Win | 12 | 9 | B10 | 52.2 | 61.2 |
11-10-2018 | Michigan_B10 | 42 | Rutgers | 7 | Road | Win | 35 | 31 | B10 | 29.9 | 60.9 |
11-10-2018 | Texas A&M_SEC | 38 | Mississippi | 24 | Home | Win | 14 | 11 | SEC | 49.3 | 60.3 |
11-10-2018 | Temple_Amer | 59 | Houston | 49 | Road | Win | 10 | 13 | Amer | 46.5 | 59.5 |
11-10-2018 | Troy_SUN | 35 | Georgia Southern | 21 | Road | Win | 14 | 17 | SUN | 42.5 | 59.5 |
11-08-2018 | Wake Forest_ACC | 27 | North Carolina St | 23 | Road | Win | 4 | 7 | ACC | 51.7 | 58.7 |
11-10-2018 | Utah St_MWC | 62 | San José St | 24 | Home | Win | 38 | 29.5 | MWC | 29.1 | 58.6 |
11-10-2018 | Nevada_MWC | 49 | Colorado St | 10 | Home | Win | 39 | 30 | MWC | 27.6 | 57.6 |
11-09-2018 | Syracuse_ACC | 54 | Louisville | 23 | Home | Win | 31 | 26 | ACC | 31.3 | 57.3 |
11-10-2018 | Mississippi St_SEC | 0 | Alabama | 24 | Road | Loss | -24 | -21 | SEC | 78 | 57 |
11-10-2018 | Memphis_Amer | 47 | Tulsa | 21 | Home | Win | 26 | 23 | Amer | 34 | 57 |
11-10-2018 | Stanford_P12 | 48 | Oregon St | 17 | Home | Win | 31 | 26 | P12 | 30.7 | 56.7 |
11-10-2018 | Georgia Tech_ACC | 27 | Miami FL | 21 | Home | Win | 6 | 7 | ACC | 49.6 | 56.6 |
11-10-2018 | Missouri_SEC | 33 | Vanderbilt | 28 | Home | Win | 5 | 7 | SEC | 49.3 | 56.3 |
11-10-2018 | Utah_P12 | 32 | Oregon | 25 | Home | Win | 7 | 7 | P12 | 49.3 | 56.3 |
11-10-2018 | Iowa St_B12 | 28 | Baylor | 14 | Home | Win | 14 | 11 | B12 | 45.1 | 56.1 |
11-06-2018 | Buffalo_MAC | 48 | Kent St | 14 | Home | Win | 34 | 27.5 | MAC | 27.9 | 55.4 |
11-10-2018 | Auburn_SEC | 10 | Georgia | 27 | Road | Loss | -17 | -14 | SEC | 69 | 55 |
11-10-2018 | Florida Int'l_CUSA | 45 | Texas-San Antonio | 7 | Road | Win | 38 | 32.5 | CUSA | 21.8 | 54.3 |
11-10-2018 | California_P12 | 15 | Southern Cal | 14 | Road | Win | 1 | 7 | P12 | 47.2 | 54.2 |
11-10-2018 | Eastern Michigan_MAC | 27 | Akron | 7 | Home | Win | 20 | 17 | MAC | 36.1 | 53.1 |
11-10-2018 | Virginia_ACC | 45 | Liberty | 24 | Home | Win | 21 | 18 | IND | 34.6 | 52.6 |
11-10-2018 | Nebraska_B10 | 54 | Illinois | 35 | Home | Win | 19 | 16 | B10 | 36.6 | 52.6 |
11-10-2018 | Appalachian St_SUN | 38 | Texas St-San Marcos | 7 | Road | Win | 31 | 29 | SUN | 23.2 | 52.2 |
11-10-2018 | Vanderbilt_SEC | 28 | Missouri | 33 | Road | Loss | -5 | -7 | SEC | 59.1 | 52.1 |
11-10-2018 | Oklahoma_B12 | 48 | Oklahoma St | 47 | Home | Win | 1 | 0 | B12 | 51.1 | 51.1 |
11-10-2018 | Wisconsin_B10 | 10 | Penn State | 22 | Road | Loss | -12 | -9 | B10 | 60 | 51 |
11-10-2018 | Arkansas_SEC | 17 | LSU | 24 | Home | Loss | -7 | -10 | SEC | 60.9 | 50.9 |
11-10-2018 | Louisiana-Monroe_SUN | 38 | South Alabama | 10 | Road | Win | 28 | 27.5 | SUN | 22.9 | 50.4 |
11-10-2018 | Oregon_P12 | 25 | Utah | 32 | Road | Loss | -7 | -7 | P12 | 57.4 | 50.4 |
11-10-2018 | Air Force_MWC | 42 | New Mexico | 24 | Home | Win | 18 | 15 | MWC | 35.3 | 50.3 |
11-10-2018 | South Carolina_SEC | 31 | Florida | 35 | Road | Loss | -4 | -7 | SEC | 56.9 | 49.9 |
11-10-2018 | UCLA_P12 | 28 | Arizona St | 31 | Road | Loss | -3 | 0 | P12 | 49.7 | 49.7 |
11-10-2018 | Indiana_B10 | 34 | Maryland | 32 | Home | Win | 2 | 0 | B10 | 49.3 | 49.3 |
11-10-2018 | LSU_SEC | 24 | Arkansas | 17 | Road | Win | 7 | 10 | SEC | 39 | 49 |
11-10-2018 | Boston College_ACC | 7 | Clemson | 27 | Home | Loss | -20 | -23 | ACC | 71.8 | 48.8 |
11-10-2018 | Cincinnati_Amer | 35 | South Florida | 23 | Home | Win | 12 | 9 | Amer | 39.3 | 48.3 |
11-10-2018 | UNLV_MWC | 27 | San Diego St | 24 | Road | Win | 3 | 7 | MWC | 41.2 | 48.2 |
11-10-2018 | Navy_Amer | 24 | Central Florida | 35 | Road | Loss | -11 | -8 | Amer | 56.1 | 48.1 |
11-10-2018 | Brigham Young_IND | 35 | Massachusetts | 16 | Neut | Win | 19 | 19 | IND | 28.4 | 47.4 |
11-10-2018 | Old Dominion_CUSA | 34 | North Texas | 31 | Home | Win | 3 | 0 | CUSA | 47.2 | 47.2 |
11-09-2018 | Fresno St_MWC | 17 | Boise St | 24 | Road | Loss | -7 | -7 | MWC | 54.1 | 47.1 |
11-10-2018 | Kansas St_B12 | 21 | Kansas | 17 | Home | Win | 4 | 7 | B12 | 39.8 | 46.8 |
11-10-2018 | Baylor_B12 | 14 | Iowa St | 28 | Road | Loss | -14 | -11 | B12 | 57.8 | 46.8 |
11-10-2018 | Southern Miss_CUSA | 23 | UAB | 26 | Road | Loss | -3 | 0 | CUSA | 46.2 | 46.2 |
11-10-2018 | Texas Tech_B12 | 34 | Texas | 41 | Home | Loss | -7 | -10 | B12 | 56.1 | 46.1 |
11-10-2018 | Mississippi_SEC | 24 | Texas A&M | 38 | Road | Loss | -14 | -11 | SEC | 56.7 | 45.7 |
11-10-2018 | Maryland_B10 | 32 | Indiana | 34 | Road | Loss | -2 | 0 | B10 | 45.3 | 45.3 |
11-07-2018 | Miami OH_MAC | 30 | Ohio U. | 28 | Home | Win | 2 | 0 | MAC | 45.2 | 45.2 |
11-10-2018 | South Florida_Amer | 23 | Cincinnati | 35 | Road | Loss | -12 | -9 | Amer | 53.4 | 44.4 |
11-10-2018 | Iowa_B10 | 10 | Northwestern | 14 | Home | Loss | -4 | -7 | B10 | 51.1 | 44.1 |
11-10-2018 | Bowling Green_MAC | 24 | Central Michigan | 13 | Road | Win | 11 | 14 | MAC | 29.9 | 43.9 |
11-10-2018 | Marshall_CUSA | 30 | UNC-Charlotte | 13 | Home | Win | 17 | 14 | CUSA | 29.9 | 43.9 |
11-10-2018 | Duke_ACC | 42 | North Carolina | 35 | Home | Win | 7 | 7 | ACC | 36 | 43 |
11-10-2018 | North Carolina_ACC | 35 | Duke | 42 | Road | Loss | -7 | -7 | ACC | 50 | 43 |
11-10-2018 | Miami FL_ACC | 21 | Georgia Tech | 27 | Road | Loss | -6 | -7 | ACC | 49.3 | 42.3 |
11-10-2018 | Arizona St_P12 | 31 | UCLA | 28 | Home | Win | 3 | 0 | P12 | 41.7 | 41.7 |
11-07-2018 | Ohio U._MAC | 28 | Miami OH | 30 | Road | Loss | -2 | 0 | MAC | 41.3 | 41.3 |
11-10-2018 | Central Florida_Amer | 35 | Navy | 24 | Home | Win | 11 | 8 | Amer | 33.2 | 41.2 |
11-10-2018 | Florida Atlantic_CUSA | 34 | Western Kentucky | 15 | Home | Win | 19 | 16 | CUSA | 24.6 | 40.6 |
11-10-2018 | Louisiana-Lafayette_SUN | 36 | Georgia St | 22 | Home | Win | 14 | 11 | SUN | 29.2 | 40.2 |
11-10-2018 | Middle Tennessee St_CUSA | 48 | UTEP | 32 | Road | Win | 16 | 19 | CUSA | 20.4 | 39.4 |
11-10-2018 | Michigan St_B10 | 6 | Ohio State | 26 | Home | Loss | -20 | -23 | B10 | 61.5 | 38.5 |
11-10-2018 | Southern Cal_P12 | 14 | California | 15 | Home | Loss | -1 | -7 | P12 | 45.1 | 38.1 |
11-10-2018 | Rutgers_B10 | 7 | Michigan | 42 | Home | Loss | -35 | -31 | B10 | 68.5 | 37.5 |
11-10-2018 | SMU_Amer | 62 | Connecticut | 50 | Road | Win | 12 | 15 | Amer | 22 | 37 |
11-10-2018 | Florida St_ACC | 13 | Notre Dame | 42 | Road | Loss | -29 | -25 | IND | 61.7 | 36.7 |
11-10-2018 | East Carolina_Amer | 18 | Tulane | 24 | Road | Loss | -6 | -7 | Amer | 43.5 | 36.5 |
11-10-2018 | Kansas_B12 | 17 | Kansas St | 21 | Road | Loss | -4 | -7 | B12 | 43.5 | 36.5 |
11-10-2018 | Tulane_Amer | 24 | East Carolina | 18 | Home | Win | 6 | 7 | Amer | 29.4 | 36.4 |
11-10-2018 | Houston_Amer | 49 | Temple | 59 | Home | Loss | -10 | -13 | Amer | 49.2 | 36.2 |
11-08-2018 | North Carolina St_ACC | 23 | Wake Forest | 27 | Home | Loss | -4 | -7 | ACC | 43.2 | 36.2 |
11-10-2018 | UAB_CUSA | 26 | Southern Miss | 23 | Home | Win | 3 | 0 | CUSA | 35.7 | 35.7 |
11-10-2018 | TCU_B12 | 10 | West Virginia | 47 | Road | Loss | -37 | -29 | B12 | 64.4 | 35.4 |
11-10-2018 | Kentucky_SEC | 7 | Tennessee | 24 | Road | Loss | -17 | -14 | SEC | 48.9 | 34.9 |
11-10-2018 | Colorado_P12 | 7 | Washington St | 31 | Home | Loss | -24 | -25.5 | P12 | 59.7 | 34.2 |
11-10-2018 | New Mexico_MWC | 24 | Air Force | 42 | Road | Loss | -18 | -15 | MWC | 45.8 | 30.8 |
11-10-2018 | Liberty_IND | 24 | Virginia | 45 | Road | Loss | -21 | -18 | ACC | 47.9 | 29.9 |
11-10-2018 | Louisiana Tech_CUSA | 28 | Rice | 13 | Home | Win | 15 | 12 | CUSA | 17.8 | 29.8 |
11-10-2018 | Illinois_B10 | 35 | Nebraska | 54 | Road | Loss | -19 | -16 | B10 | 45.5 | 29.5 |
11-10-2018 | Georgia St_SUN | 22 | Louisiana-Lafayette | 36 | Road | Loss | -14 | -11 | SUN | 40 | 29 |
11-10-2018 | Georgia Southern_SUN | 21 | Troy | 35 | Home | Loss | -14 | -17 | SUN | 45.7 | 28.7 |
11-10-2018 | San José St_MWC | 24 | Utah St | 62 | Road | Loss | -38 | -29.5 | MWC | 57 | 27.5 |
11-10-2018 | Akron_MAC | 7 | Eastern Michigan | 27 | Road | Loss | -20 | -17 | MAC | 44.2 | 27.2 |
11-10-2018 | Oregon St_P12 | 17 | Stanford | 48 | Road | Loss | -31 | -26 | P12 | 53.1 | 27.1 |
11-10-2018 | North Texas_CUSA | 31 | Old Dominion | 34 | Road | Loss | -3 | 0 | CUSA | 27 | 27 |
11-10-2018 | Rice_CUSA | 13 | Louisiana Tech | 28 | Road | Loss | -15 | -12 | CUSA | 38.6 | 26.6 |
11-10-2018 | UNC-Charlotte_CUSA | 13 | Marshall | 30 | Road | Loss | -17 | -14 | CUSA | 40.4 | 26.4 |
11-09-2018 | Louisville_ACC | 23 | Syracuse | 54 | Road | Loss | -31 | -26 | ACC | 52.3 | 26.3 |
11-10-2018 | Massachusetts_IND | 16 | Brigham Young | 35 | Neut | Loss | -19 | -19 | IND | 44.7 | 25.7 |
11-10-2018 | Army_IND | 31 | Lafayette | 13 | Home | Win | 18 | 15 | fcs | 9.9 | 24.9 |
11-07-2018 | Toledo_MAC | 15 | Northern Illinois | 38 | Road | Loss | -23 | -20 | MAC | 44.3 | 24.3 |
11-10-2018 | San Diego St_MWC | 24 | UNLV | 27 | Home | Loss | -3 | -7 | MWC | 30.8 | 23.8 |
11-10-2018 | Western Kentucky_CUSA | 15 | Florida Atlantic | 34 | Road | Loss | -19 | -16 | CUSA | 39.5 | 23.5 |
11-10-2018 | Connecticut_Amer | 50 | SMU | 62 | Home | Loss | -12 | -15 | Amer | 38.1 | 23.1 |
11-10-2018 | Tulsa_Amer | 21 | Memphis | 47 | Road | Loss | -26 | -23 | Amer | 45.9 | 22.9 |
11-10-2018 | Virginia Tech_ACC | 22 | Pittsburgh | 52 | Road | Loss | -30 | -25.5 | ACC | 48.4 | 22.9 |
11-10-2018 | Texas St-San Marcos_SUN | 7 | Appalachian St | 38 | Home | Loss | -31 | -29 | SUN | 51.8 | 22.8 |
11-10-2018 | UTEP_CUSA | 32 | Middle Tennessee St | 48 | Home | Loss | -16 | -19 | CUSA | 40.9 | 21.9 |
11-06-2018 | Kent St_MAC | 14 | Buffalo | 48 | Road | Loss | -34 | -27.5 | MAC | 48.1 | 20.6 |
11-10-2018 | Purdue_B10 | 10 | Minnesota | 41 | Road | Loss | -31 | -26 | B10 | 46.3 | 20.3 |
11-10-2018 | Coastal Car._SUN | 16 | Arkansas St | 44 | Home | Loss | -28 | -27.5 | SUN | 42.3 | 14.8 |
11-10-2018 | Colorado St_MWC | 10 | Nevada | 49 | Road | Loss | -39 | -30 | MWC | 44 | 14 |
11-10-2018 | Central Michigan_MAC | 13 | Bowling Green | 24 | Home | Loss | -11 | -14 | MAC | 24.2 | 10.2 |
11-10-2018 | South Alabama_SUN | 10 | Louisiana-Monroe | 38 | Home | Loss | -28 | -27.5 | SUN | 34.4 | 6.9 |
11-10-2018 | Texas-San Antonio_CUSA | 7 | Florida Int'l | 45 | Home | Loss | -38 | -32.5 | CUSA | 38.2 | 5.7 |
And here are the updated season standings. Yes, Alabama is ridiculous.
Rk | Team | Conf | Div | Conf Rk | G | MOV | SOS | SRS | REC |
---|---|---|---|---|---|---|---|---|---|
1 | Alabama | SEC | SEC-West | 1 | 10 | 29.4 | 48.6 | 78 | 10-0 |
2 | Clemson | ACC | ACC-Atl | 1 | 10 | 27.2 | 44.7 | 71.8 | 10-0 |
3 | Georgia | SEC | SEC-East | 2 | 10 | 19.1 | 49.9 | 69 | 9-1 |
4 | Michigan | B10 | B10-East | 1 | 10 | 20.5 | 48 | 68.5 | 9-1 |
5 | Oklahoma | B12 | B12 | 1 | 10 | 16.3 | 49 | 65.2 | 9-1 |
6 | West Virginia | B12 | B12 | 2 | 9 | 17.5 | 46.9 | 64.4 | 8-1 |
7 | Notre Dame | IND | Ind | 1 | 10 | 15.9 | 45.9 | 61.7 | 10-0 |
8 | Ohio State | B10 | B10-East | 2 | 10 | 15.8 | 45.8 | 61.5 | 9-1 |
9 | LSU | SEC | SEC-West | 3 | 10 | 9.3 | 51.6 | 60.9 | 8-2 |
10 | Penn State | B10 | B10-East | 3 | 10 | 9.5 | 50.5 | 60 | 7-3 |
11 | Washington St | P12 | P12-North | 1 | 10 | 15.8 | 43.9 | 59.7 | 9-1 |
12 | Fresno St | MWC | MWC-West | 1 | 10 | 20.7 | 38.8 | 59.5 | 8-2 |
13 | Missouri | SEC | SEC-East | 4 | 10 | 6.9 | 52.2 | 59.1 | 6-4 |
14 | Mississippi St | SEC | SEC-West | 5 | 10 | 8.9 | 49.9 | 58.8 | 6-4 |
15 | Iowa | B10 | B10-West | 4 | 10 | 9 | 49.6 | 58.6 | 6-4 |
16 | Iowa St | B12 | B12 | 3 | 9 | 6.2 | 51.6 | 57.8 | 6-3 |
17 | Utah | P12 | P12-South | 2 | 10 | 9.6 | 47.8 | 57.4 | 7-3 |
18 | Washington | P12 | P12-North | 3 | 10 | 10.1 | 47.1 | 57.2 | 7-3 |
19 | Utah St | MWC | MWC-Mntn | 2 | 10 | 23.2 | 33.9 | 57.1 | 9-1 |
20 | Florida | SEC | SEC-East | 6 | 10 | 7 | 49.9 | 56.9 | 7-3 |
21 | Texas A&M | SEC | SEC-West | 7 | 10 | 5.3 | 51.4 | 56.7 | 6-4 |
22 | Texas Tech | B12 | B12 | 4 | 10 | 6.3 | 50.1 | 56.4 | 5-5 |
23 | Kentucky | SEC | SEC-East | 8 | 10 | 5.8 | 50.5 | 56.2 | 7-3 |
24 | Texas | B12 | B12 | 5 | 10 | 5.7 | 50.4 | 56.1 | 7-3 |
25 | Central Florida | Amer | Amer-East | 1 | 9 | 20.1 | 36 | 56.1 | 9-0 |
26 | Michigan St | B10 | B10-East | 5 | 10 | 1.7 | 52.7 | 54.4 | 6-4 |
27 | Purdue | B10 | B10-West | 6 | 10 | 3.5 | 50.9 | 54.4 | 5-5 |
28 | South Carolina | SEC | SEC-East | 9 | 9 | 1 | 53.3 | 54.3 | 5-4 |
29 | Boise St | MWC | MWC-Mntn | 3 | 10 | 12.2 | 41.9 | 54.1 | 8-2 |
30 | Auburn | SEC | SEC-West | 10 | 10 | 6.3 | 47.8 | 54.1 | 6-4 |
31 | Cincinnati | Amer | Amer-East | 2 | 10 | 16.6 | 36.9 | 53.4 | 9-1 |
32 | Stanford | P12 | P12-North | 4 | 10 | 3.8 | 49.3 | 53.1 | 6-4 |
33 | Syracuse | ACC | ACC-Atl | 2 | 10 | 13.7 | 38.6 | 52.3 | 8-2 |
34 | Wisconsin | B10 | B10-West | 7 | 10 | 6.7 | 45.5 | 52.2 | 6-4 |
35 | Appalachian St | SUN | Sun | 1 | 9 | 18.3 | 33.5 | 51.8 | 7-2 |
36 | North Carolina St | ACC | ACC-Atl | 3 | 9 | 5.3 | 46.3 | 51.7 | 6-3 |
37 | Boston College | ACC | ACC-Atl | 4 | 10 | 7.3 | 44.3 | 51.6 | 7-3 |
38 | Northwestern | B10 | B10-West | 8 | 10 | 0 | 51.1 | 51.1 | 6-4 |
39 | Oklahoma St | B12 | B12 | 6 | 10 | 4.8 | 46.3 | 51.1 | 5-5 |
40 | Army | IND | Ind | 2 | 10 | 10.3 | 40.2 | 50.5 | 8-2 |
41 | Duke | ACC | ACC-Coas | 5 | 10 | 7.3 | 42.7 | 50 | 7-3 |
42 | Arizona St | P12 | P12-South | 5 | 10 | 4.7 | 45 | 49.7 | 6-4 |
43 | Miami FL | ACC | ACC-Coas | 6 | 10 | 7.1 | 42.6 | 49.7 | 5-5 |
44 | Maryland | B10 | B10-East | 9 | 10 | 2.5 | 46.9 | 49.3 | 5-5 |
45 | Mississippi | SEC | SEC-West | 11 | 10 | 0.6 | 48.7 | 49.3 | 5-5 |
46 | Vanderbilt | SEC | SEC-East | 12 | 10 | -0.9 | 50.2 | 49.3 | 4-6 |
47 | Oregon | P12 | P12-North | 6 | 10 | 5.8 | 43.5 | 49.3 | 6-4 |
48 | Georgia Tech | ACC | ACC-Coas | 7 | 10 | 8 | 41.3 | 49.3 | 6-4 |
49 | Temple | Amer | Amer-East | 3 | 10 | 6.4 | 42.8 | 49.2 | 6-4 |
50 | Tennessee | SEC | SEC-East | 13 | 10 | -1.6 | 50.5 | 48.9 | 5-5 |
51 | Pittsburgh | ACC | ACC-Coas | 8 | 10 | 1.4 | 47 | 48.4 | 6-4 |
52 | Buffalo | MAC | MAC-East | 1 | 10 | 12.6 | 35.5 | 48.1 | 9-1 |
53 | Virginia | ACC | ACC-Coas | 9 | 10 | 7.1 | 40.8 | 47.9 | 7-3 |
54 | TCU | B12 | B12 | 7 | 10 | -2.3 | 50.2 | 47.9 | 4-6 |
55 | North Texas | CUSA | CUSA-West | 1 | 10 | 14.6 | 32.6 | 47.2 | 7-3 |
56 | Southern Cal | P12 | P12-South | 7 | 10 | -0.1 | 47.3 | 47.2 | 5-5 |
57 | Houston | Amer | Amer-West | 4 | 10 | 11.9 | 34.6 | 46.5 | 7-3 |
58 | Minnesota | B10 | B10-West | 10 | 10 | -1.2 | 47.4 | 46.3 | 5-5 |
59 | UAB | CUSA | CUSA-West | 2 | 10 | 16.4 | 29.8 | 46.2 | 9-1 |
60 | Memphis | Amer | Amer-West | 5 | 10 | 10.8 | 35.1 | 45.9 | 6-4 |
61 | Air Force | MWC | MWC-Mntn | 4 | 10 | 3.7 | 42.1 | 45.8 | 4-6 |
62 | Troy | SUN | Sun | 2 | 10 | 10 | 35.7 | 45.7 | 8-2 |
63 | Colorado | P12 | P12-South | 8 | 10 | 2.7 | 43 | 45.6 | 5-5 |
64 | Nebraska | B10 | B10-West | 11 | 10 | -2.1 | 47.6 | 45.5 | 3-7 |
65 | Indiana | B10 | B10-East | 12 | 10 | -2.4 | 47.7 | 45.3 | 5-5 |
66 | Ohio U. | MAC | MAC-East | 2 | 10 | 10 | 35.3 | 45.2 | 6-4 |
67 | California | P12 | P12-North | 9 | 10 | 1.1 | 44 | 45.1 | 6-4 |
68 | Baylor | B12 | B12 | 8 | 10 | -2.6 | 47.7 | 45.1 | 5-5 |
69 | Brigham Young | IND | Ind | 3 | 10 | 1 | 43.8 | 44.7 | 5-5 |
70 | Arizona | P12 | P12-South | 10 | 10 | 2.4 | 42 | 44.3 | 5-5 |
71 | Northern Illinois | MAC | MAC-West | 3 | 10 | 1.3 | 43 | 44.3 | 7-3 |
72 | Eastern Michigan | MAC | MAC-West | 4 | 11 | 4.6 | 39.6 | 44.2 | 6-5 |
73 | Nevada | MWC | MWC-West | 5 | 10 | 3.2 | 40.8 | 44 | 6-4 |
74 | Tulane | Amer | Amer-West | 6 | 10 | 1.1 | 42.5 | 43.5 | 5-5 |
75 | Kansas St | B12 | B12 | 9 | 10 | -4.2 | 47.7 | 43.5 | 4-6 |
76 | Wake Forest | ACC | ACC-Atl | 10 | 10 | -2.7 | 45.9 | 43.2 | 5-5 |
77 | Toledo | MAC | MAC-West | 5 | 10 | 4.3 | 38.9 | 43.2 | 5-5 |
78 | Georgia Southern | SUN | Sun | 3 | 10 | 6.4 | 36.1 | 42.5 | 7-3 |
79 | Arkansas St | SUN | Sun | 4 | 10 | 2.9 | 39.5 | 42.3 | 6-4 |
80 | UCLA | P12 | P12-South | 11 | 10 | -11 | 52.7 | 41.7 | 2-8 |
81 | Miami OH | MAC | MAC-East | 6 | 10 | 0.4 | 41 | 41.3 | 4-6 |
82 | San Diego St | MWC | MWC-West | 6 | 10 | 1.3 | 39.9 | 41.2 | 7-3 |
83 | Virginia Tech | ACC | ACC-Coas | 11 | 9 | -1.6 | 42.6 | 41.1 | 4-5 |
84 | Middle Tennessee St | CUSA | CUSA-East | 3 | 10 | 5.1 | 35.9 | 41 | 7-3 |
85 | Marshall | CUSA | CUSA-East | 4 | 9 | 6.3 | 34.1 | 40.4 | 6-3 |
86 | Florida St | ACC | ACC-Atl | 12 | 10 | -7.6 | 47.7 | 40.1 | 4-6 |
87 | Louisiana-Lafayette | SUN | Sun | 5 | 10 | 0.1 | 39.9 | 40 | 5-5 |
88 | Kansas | B12 | B12 | 10 | 10 | -6.2 | 46 | 39.8 | 3-7 |
89 | Florida Atlantic | CUSA | CUSA-East | 5 | 10 | 0.4 | 39.1 | 39.5 | 5-5 |
90 | South Florida | Amer | Amer-East | 7 | 10 | 1.9 | 37.5 | 39.3 | 7-3 |
91 | Arkansas | SEC | SEC-West | 14 | 10 | -8.4 | 47.4 | 39 | 2-8 |
92 | Louisiana Tech | CUSA | CUSA-West | 6 | 10 | 3.1 | 35.5 | 38.6 | 7-3 |
93 | Florida Int'l | CUSA | CUSA-East | 7 | 10 | 9.2 | 29 | 38.2 | 7-3 |
94 | SMU | Amer | Amer-West | 8 | 10 | -4.3 | 42.3 | 38.1 | 5-5 |
95 | Western Michigan | MAC | MAC-West | 7 | 10 | -0.3 | 38.1 | 37.8 | 6-4 |
96 | Wyoming | MWC | MWC-Mntn | 7 | 10 | -5.8 | 43.4 | 37.6 | 4-6 |
97 | Illinois | B10 | B10-West | 13 | 10 | -7.1 | 43.6 | 36.6 | 4-6 |
98 | Akron | MAC | MAC-East | 8 | 9 | -3.4 | 39.6 | 36.1 | 4-5 |
99 | North Carolina | ACC | ACC-Coas | 13 | 9 | -9.9 | 45.9 | 36 | 1-8 |
100 | Southern Miss | CUSA | CUSA-West | 8 | 9 | 2.4 | 33.3 | 35.7 | 4-5 |
101 | New Mexico | MWC | MWC-Mntn | 8 | 10 | -4.7 | 39.9 | 35.3 | 3-7 |
102 | Liberty | IND | Ind | 4 | 9 | -2.4 | 37.1 | 34.6 | 4-5 |
103 | Coastal Car. | SUN | Sun | 6 | 10 | -4.1 | 38.6 | 34.5 | 5-5 |
104 | Louisiana-Monroe | SUN | Sun | 7 | 10 | -1.9 | 36.2 | 34.4 | 6-4 |
105 | Tulsa | Amer | Amer-West | 9 | 10 | -6.9 | 40.9 | 34 | 2-8 |
106 | Hawai`i | MWC | MWC-West | 9 | 11 | -3.6 | 37.6 | 34 | 6-5 |
107 | Navy | Amer | Amer-West | 10 | 10 | -10.2 | 43.4 | 33.2 | 2-8 |
108 | Louisville | ACC | ACC-Atl | 14 | 10 | -17.5 | 48.7 | 31.3 | 2-8 |
109 | UNLV | MWC | MWC-West | 10 | 10 | -8.2 | 39 | 30.8 | 3-7 |
110 | Oregon St | P12 | P12-North | 12 | 10 | -15.5 | 46.2 | 30.7 | 2-8 |
111 | Ball St | MAC | MAC-West | 9 | 10 | -7.4 | 38.1 | 30.7 | 3-7 |
112 | Central Michigan | MAC | MAC-West | 10 | 11 | -10.7 | 40.6 | 29.9 | 1-10 |
113 | Rutgers | B10 | B10-East | 14 | 10 | -17.7 | 47.6 | 29.9 | 1-9 |
114 | UNC-Charlotte | CUSA | CUSA-East | 9 | 10 | -5 | 34.8 | 29.9 | 4-6 |
115 | East Carolina | Amer | Amer-East | 11 | 9 | -11.9 | 41.4 | 29.4 | 2-7 |
116 | Georgia St | SUN | Sun | 8 | 10 | -10.2 | 39.4 | 29.2 | 2-8 |
117 | San José St | MWC | MWC-West | 11 | 10 | -13.7 | 42.7 | 29.1 | 1-9 |
118 | Massachusetts | IND | Ind | 5 | 11 | -7.5 | 35.9 | 28.4 | 4-7 |
119 | Kent St | MAC | MAC-East | 11 | 10 | -11 | 38.9 | 27.9 | 2-8 |
120 | Colorado St | MWC | MWC-Mntn | 12 | 10 | -13.7 | 41.3 | 27.6 | 3-7 |
121 | Old Dominion | CUSA | CUSA-East | 10 | 10 | -9.6 | 36.6 | 27 | 3-7 |
122 | Western Kentucky | CUSA | CUSA-East | 11 | 10 | -11.5 | 36.1 | 24.6 | 1-9 |
123 | Bowling Green | MAC | MAC-East | 12 | 10 | -14.8 | 39 | 24.2 | 2-8 |
124 | Texas St-San Marcos | SUN | Sun | 9 | 10 | -6.8 | 29.9 | 23.2 | 3-7 |
125 | South Alabama | SUN | Sun | 10 | 10 | -15 | 37.8 | 22.9 | 2-8 |
126 | New Mexico St | IND | IND | 6 | 10 | -13.6 | 35.8 | 22.2 | 3-7 |
127 | Connecticut | Amer | Amer-East | 12 | 10 | -21.1 | 43 | 22 | 1-9 |
128 | Texas-San Antonio | CUSA | CUSA-West | 12 | 10 | -14.1 | 35.8 | 21.8 | 3-7 |
129 | UTEP | CUSA | CUSA-West | 13 | 10 | -13 | 33.3 | 20.4 | 1-9 |
130 | Rice | CUSA | CUSA-West | 14 | 11 | -17.1 | 34.9 | 17.8 | 1-10 |
Right now, on a neutral field, Alabama would be:
— 6-point favorites against Clemson
— 9-point favorites against Georgia
— 9.5 point favorites against Michigan
— 16-point favorites against Notre Dame
— 22-point favorites against UCF
— 54.5 point favorites against The Citadel, Alabama’s opponent this weekend (that’s based on The Citadel’s 23.5 SRS rating; there actually is no point spread on the game).
This year, the Giants are averaging 6.35 net yards per pass and 4.18 yards per carry. That’s below-average on both counts, as New York ranks 20th in both categories.
This year, the Dolphins are averaging 6.53 net yards per pass and 4.30 yards per carry. Miami ranks 15th in NY/A and 17th in YPC.
And yet the Giants are averaging more yards per play this year than Miami! How is that possible — after all, plays are just rushes or passes (including sacks), and the Dolphins are averaging more yards per pass and yards per rush. But New York has gained 5.70 yards per play this year, while Miami is averaging only 5.58 yards per play.
The answer, of course, is Simpson’s Paradox. We can also see an example of Simpson’s Paradox with Chicago. This year, the Bears are averaging 6.65 net yards per pass and 4.45 yards per carry. That’s above-average in both categories, as Chicago ranks 12th in both metrics. And yet the Bears rank below the Giants in yards per play, at just 5.65.
This is because the Giants pass a lot, and passes are more effective at gaining yards (even net of sacks) than rushes. The Giants have passed on a league-high 70% of plays, while Miami has passed on 58% of plays and the Bears just 54% of plays.
This happens with a few teams every year. The Jaguars are averaging 6.02 net yards per pass, 4.25 yards per rush, and 5.41 yards per play. The Redskins are averaging 6.12 net yards per pass and 4.33 yards per rush, and yet… Washington is only averaging 5.34 yards per play, a lower average than Jacksonville. That’s because the Jags have passed on 66% of plays, while the Redskins have passed on only 56% of plays. [continue reading…]
A couple of weeks ago, I wrote that over his 4-year career, Jameis Winston had been great at picking up first downs and also at throwing interceptions. Well, now that Ryan Fitzpatrick’s interception rate has ticked back up, the same is true for the 2018 Bucs as a whole.
Jameis Winston leads all players with a 6.8% interception rate through 9 weeks. But Fitzpatrick’s 3.8% interception rate puts him as the 5th most INT-prone passer of the first half of the ’18 season. On the other hand, there are just five players this season who have picked up first downs on 40% of their dropbacks so far: Jared Goff (43.2%), Patrick Mahomes (41.0%), and Philip Rivers (40.9%) — three of the top MVP candidates — and then Fitzpatrick (42.6%) and yes, Winston (40.4%).
On the team level, the Buccaneers have picked up a first down on 41.5% of dropbacks (calculated based on a league-high 148 passing first downs, divided by the team’s 333 pass attempts and 24 sacks). The Rams lead the league in this metric at 43.3%, followed by Tampa Bay, Kansas City, the Chargers, and the Saints. The worst five teams are the Bills (22.2%), the Cardinals, the Browns, the Jets, and the Cowboys.
When it comes to interception rate, the Bills have the worst performance in that category, too, at 5.5%. But here, Tampa Bay ranks 2nd in the NFL at 5.1%. Usually, there’s a pretty strong relationship between these two categories: teams with good interception rates have good first down rates, and teams with bad interception rates have bad first down rates. Tampa Bay is a very… very large outlier. No other team ranks in the top 9 in first down rate and bottom 9 in interception rate, while Tampa Bay ranks 2nd and 2nd-from the bottom. The Bengals (11th-best 1st down rate, 10th-worst INT rate) are the only other team in the top/bottom 12 of both metrics, and the 49ers, Texans, and Lions are the only other teams in the top/bottom 15.
On the flip side, Baltimore and Washington are the anti-Bucs. The Ravens rank 25th in first down rate, but 9th (aka 24th-from-the-bottom) in interception rate, while the Redskins are 22nd in first down rate and 5th (aka 28th from the bottom) in interception rate. Yes, Alex Smith is still your anti-gunslinger.
On the graph below, I have plotted where each team fares in first down rate (X-Axis) and interception rate (Y-Axis). Interception rate is plotted in reverse order, so a low (good) INT rate is high in the graph; therefore, you want to be in the upper right corner of the graph. The worst passing teams — the Bills, Cardinals, and Jets — are in the lower left corner of the graph. And all alone in the bottom right? That’s where you’ll find Tampa Bay, the biggest passing outlier this season. [continue reading…]