≡ Menu

Previously:

This was the least notable week in a long time, at least from a Game Scripts perspective. No team won with a negative Game Script. There weren’t any really large Game Scripts (Chicago had the biggest, but it was lower than the average best Game Script of the week), and no team stood out on the extreme end for being very pass-happy or very run-heavy.

The Raiders, Texans, and Titans were the most run-happy teams in week 9. Oakland gave up on the game — and the season, and football as a city — in an embarrassing performance against San Francisco. Despite a Game Script of -16.0, Oakland finished with only a 57% pass ratio. If you need more evidence of Oakland quitting, the Raiders punted with 2 minutes left at midfield on 4th-and-9, trailing by 31 points.

In more meaningful games, Houston and Tennessee, with a pair of young mobile quarterbacks, stuck to the ground game. Deshaun Watson had another efficient passing game (although he did take 4 sacks on 28 dropbacks), and also had 6 carries for 38 yards. And while he averaged 6.9 net yards per pass attempt and 6.3 YPC, the rest of the Houston offense was not so effective: Alfred Blue and Lamar Miller somehow were given 27 carries, despite only gaining 60 yards, in a game that was tight the whole way. If there was a takeaway, it’s that the Texans need to run more effectively, or rely on Watson more.

The graph below shows the amount of yards gained on each play by Houston (Y-Axis), plotted against time elapsed into the game (X-Axis). Plays with Watson (passes, sacks, and Watson rushes) are in red, while Texans running back rushing plays are in blue.

Meanwhile, Marcus Mariota had 10 carries as part of a very run-heavy attack for Tennessee. The Titans finished with a Game Script of only +2.0, but still had more rushing attempts than pass plays. There have been 45 games this season where a team had more rushing plays than pass plays: this was just the 6th where the team had a Game Script of +2.0 or worse (the Saints against the Ravens were the only team to have more rushes than passes in a game with a negative Game Script this year).

The full week 9 Game Scripts data below: [continue reading…]

{ 0 comments }

Week 9 Passing Stats: Nick Mullens Shines In Debut

Nick Mullens was an undrafted free agent signing by the 49ers last season who was waived as part of the team’s final cuts in September. He was resigned in January, and then was again waived in September as part of San Francisco’s final cutdown.

He was added to the practice squad, and then, after Jimmy Garoppolo tore his ACL, the 49ers brought Mullens up to the active roster. Then, C.J. Beathard injured his throwing wrist in a game against the Cardinals, and while he played through the injury, he was questionable to start the team’s week 9 game on short rest. In a last minute decision, San Francisco went with Mullens — who had never entered an NFL game before — as the team’s week 9 starting quarterback.

And it somehow went magically, as Mullens turned in one of the greatest debuts by a quarterback in NFL history.

Mullens averaged a league-high 14.64 ANY/A, and ranked second to Drew Brees is value added among all quarterbacks for week 9. The weekly ANY/A average in week 9 was 6.40 ANY/A, another strong passing week for the NFL, and that’s even with Nathan Peterman playing.

And yes, a word about the Bills embattled quarterback. Peterman threw a league-high 49 pass attempts this week, and yet — amazingly — finished just 22nd in passing yards! It was another miserable week for the Buffalo passer, who averaged 0.6 ANY/A. That increased his average for the year, as Peterman is still wading in negative ANY/A waters for the season.

The table below shows the week 9 passing results. [continue reading…]

{ 0 comments }

New York Blues

Over the Jets last 32 games, New York is 10-22, a 0.3125 winning percentage.

Over the Giants last 32 games, New York is also 10-22.

For the Giants, that numbers is a bit backloaded: Big Blue is 4-20 in their last 24 games, and 6-2 in the 8 games before that. By the end of the year, you could envision the Giants going 6-26 over their last 32 games (a 0.1875 winning percentage). The Jets went 5-11 last year, and another 5-11 season is a reasonable guess: that would bring them to 10-22 over their last 32 games.

If that happens, it would mean, on average, New York football would have a 25% winning percentage over the last two years. Which is really, really bad…and also pretty rare. The Jets and Giants may not always be very good, but it’s unusual for both teams to be bad for a notable stretch of time. The graph below shows the trailing 32-game winning percentage for both the Jets and the Giants since 1960. The Jets, of course, are in green; the Giants, in blue. [continue reading…]

{ 0 comments }

In week 10, Alabama produced the win of the season, blanking #3 LSU, 29-0, in Baton Rouge. It was the worst home loss for Louisiana State since 2002, and yet another example of how Alabama is operating on a different level than any other team in college football.

Alabama scored a 91.8 in the SRS for this performance, and the Crimson Tide now have the best two games of the season (Alabama also had a 91.8 in a 62-0 win over Mississippi). The worst game of the year by Alabama (according to the SRS) was a 51-14 drubbing over Louisville on opening weekend. The second-worst game this season was a 65-31 win on the road against Arkansas. A 45-23 win over Texas A&M was the only game the Crimson Tide have won by less than four touchdowns.

Nick Saban has won 5 national championships with Alabama, and his 2016 team was a dominant squad that went 14-0 and lost in the final minute of the national championship game. And yet… this feels like the best Alabama team under Saban, and by a pretty clear margin. And if it’s the best Alabama team under Saban, it’s not too hard to suggest it’s the best Alabama team ever. And if it’s the best Alabama team ever, well, it’s obviously in the discussion for best college football team ever.

That’s how good this 2018 Alabama team is. Right now, they are a touchdown better than the rest of the FBS. Even Clemson has had a couple of unimpressive games: the Tigers needed to rally and score a last minute touchdown to beat an average Syracuse team, and caught a break in a 2-point win over Texas A&M. That’s perfectly normal for an average elite team, but those two blemishes are a standard deviation below anything an apparently invincible Alabama has done this year. Below are the full week 10 SRS ratings. [continue reading…]

{ 0 comments }

Rushing Efficiency Has Soared, With A Twist

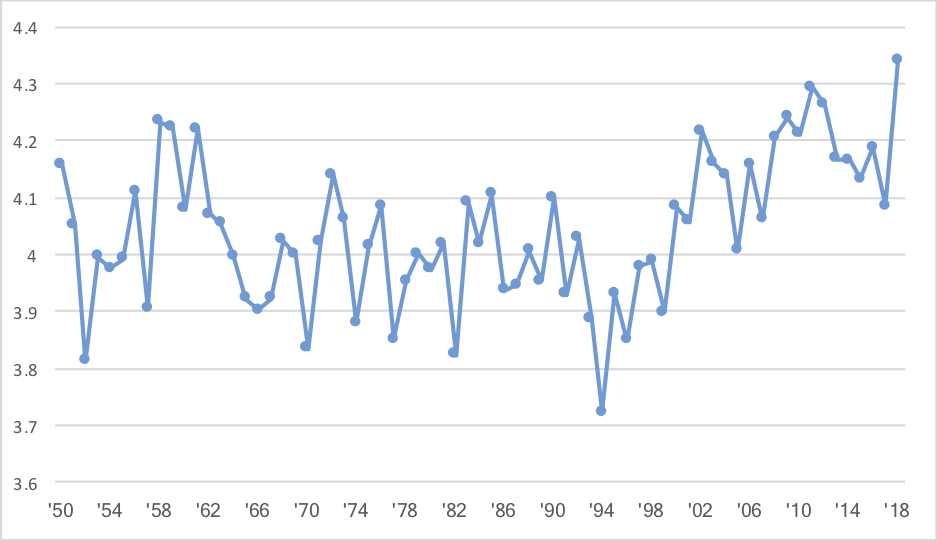
This season, the average carry in the NFL has gained 4.34 yards. That would set a new record, and it would also represent a large 0.25 YPC increase over last season’s average. The graph shows the YPC average in every NFL season since 1950:

[continue reading…]

{ 1 comment }

The Big 12 came into college football existence in 1996, when Texas, Texas Tech, Texas A&M, and Baylor left the SWC to join forces with Nebraska, Colorado, Kansas, Kansas State, Oklahoma, Oklahoma State, Iowa State, and Missouri from the Big 8. The conference has been one of the best in college football, but it’s done a terrible job of producing quality NFL quarterbacks. In fact, there have been just 19 quarterbacks to start an NFL game who played in the Big 12:

Baker Mayfield
Patrick Mahomes
Bryce Petty
Landry Jones
Geno Smith
Brandon Weeden
Ryan Tannehill
Robert Griffin
Blaine Gabbert
Sam Bradford
Colt McCoy
Stephen McGee
Josh Freeman
Chase Daniel
Vince Young
Seneca Wallace
Chris Simms
Sage Rosenfels
Koy Detmer

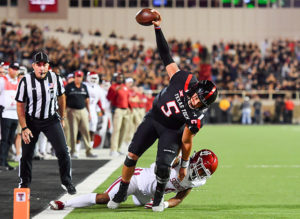
Mahomes running for a touchdown against Mayfield’s Sooners

There have been 25 quarterbacks drafted from the Big 12: of the group that have started more than 5 games, only two have a winning record. Young, who managed to have a good record despite not being a good passer, and Mahomes, who is now 8-1. Before 2018, no quarterback from the Big 12 had thrown more TDs than interceptions, had more wins than losses, and started more than 5 games.

There are five former Big 12 quarterbacks who have started a game this season: Mahomes, Mayfield, Tannehill, Gabbert, and Bradford.  Through 8 weeks, there were no Big 12 starting QB matchups (although Gabbert played a bunch against Tannehill in the season opener), but tomorrow, the Browns and Chiefs will play.  This means a revival of sorts of a classic game between Mayfield and Mahomes that featured 12 passing touchdowns and nearly 1300 passing yards.

This will be the first time two teams started Big 12 quarterbacks since week 17 of the 2016 season, a forgettable and meaningless matchup between Landry Jones and RG3.  The most high-octane Big 12 QB game of all time was probably another week 17 game, this time between Geno Smith and Ryan Tannehill in 2014.  The table below shows all matchups where both starting quarterbacks played in the Big 12:

YearTeamWinning QBOppLosing QBBoxscoreScoreCombined Pass YdCombined Pass TDCombined INT
2016pitLandry JonescleRobert GriffinBoxscore27-2450952
2015miaRyan TannehillphiSam BradfordBoxscore20-1960931
2014nyjGeno SmithmiaRyan TannehillBoxscore37-2465540
2014miaRyan TannehillnyjGeno SmithBoxscore16-1330002
2013nyjGeno SmithmiaRyan TannehillBoxscore20-742413
2013miaRyan TannehillnyjGeno SmithBoxscore23-343923
2013ramSam BradfordjaxBlaine GabbertBoxscore34-2049252
2013miaRyan TannehillcleBrandon WeedenBoxscore23-1056124
2013nyjGeno SmithtamJosh FreemanBoxscore18-1746622
2012ramSam BradfordtamJosh FreemanBoxscore28-1356835
2012miaRyan TannehillramSam BradfordBoxscore17-1450020
2012wasRobert GriffintamJosh FreemanBoxscore24-2262211
2012ramSam BradfordwasRobert GriffinBoxscore31-2851642
2011jaxBlaine GabberttamJosh FreemanBoxscore41-1440125
2011cleColt McCoyjaxBlaine GabbertBoxscore14-1040911
2011ramSam BradfordcleColt McCoyBoxscore13-1237311
2010tamJosh FreemanramSam BradfordBoxscore18-1733830

Quarterbacks from the Big 12 have disappointed for over two decades. But Mahomes is changing things, and Mayfield may be on the path to joining him.

{ 0 comments }

Rivers, Brees, and The Elusive Quest For An MVP Award

Drew Brees and Philip Rivers are two of the best quarterbacks of the last dozen years. Brees joined the Saints in 2006, paving the way for Rivers to become the Chargers starting quarterback that season. Since then, they are the only two players who threw for 50,000 yards from 2006 to 2017, and they  have been just a hair behind Tom Brady, Aaron Rodgers, and Peyton Manning in terms of efficiency.

But despite over a decade of great play, neither Brees nor Rivers have won the AP MVP award. The main reason? The triumvirate of Manning, Brady, and Rodgers have won 8 of the 12 AP MVP awards from ’06 to ’17. In the other years, the award went to Matt Ryan in 2016, Cam Newton in 2015, and running backs Adrian Peterson in 2012 and LaDainian Tomlinson in 2006.  In 2012, if Peterson didn’t win the award, Manning would have won it (Peterson beat Manning 30.5 votes to 19.5 votes, and Manning lapped the field for the AP All-Pro QB vote), so neither Brees not Rivers were denied that season.

But in 2006, it probably would have gone to Brees, it not for the historic year that Tomlinson had.  Brees was the AP first-team All-Pro choice at QB, largely because of how he transformed the Saints offense from one of the worst to one of the best in a single offseason.  Tomlinson ran away with the vote, capturing 44 of 50 votes, but Brees was the runner-up with 4 votes to Manning’s two.  That said, I’m not sure I feel particularly bad for Brees on this point: advanced statistics point to Manning as having been the best quarterback that year, and by a decent margin.  The ’06 Colts were historically great at picking up first downs, Manning led in ANY/A, and Manning lapped the field in Total QBR.  Brees would have won the award based on factors other than pure merit, had it not been for Tomlinson’s performance.

Still, it’s hard not to feel bad for these teammates on the ’04 and ’05 Chargers.  For the last 12 years, Brees and Rivers have been behind Manning/Brady/Rodgers in 10 of 12 years, and also behind historically great single seasons from Brees’s NFC South rivals.   I went ahead and calculated how many Adjusted Net Yards each quarterback has provided, relative to league average, for each season since 2006.  The formula is simple.  In 2009, for example, Brees averaged 8.31 ANY/A (Adjusted Net Yards/Attempt, of course, is yards per attempt, with a 45-yard penalty for interceptions, deductions for sacks, and a 20-yard bonus for touchdown passes) and Rivers averaged 8.30 ANY/A, while the league average that season was 5.65.  Brees had 534 dropbacks, so he is credited with 1,422 Adjusted Net Yards of value added over average (8.31 – 5.65, multiplied by 534).  Rivers had 511 dropbacks, so he is credited with 1,356 ANY of value added over average.

In both 2008 and 2009, Brees and Rivers ranked 1st and 2nd in value added over average.  In ’08, both the Saints and Chargers finished 8-8; Manning, who led the NFL with 6 game-winning drives, won the AP MVP on the 12-4 Colts.  In ’09, Manning’s Colts began the year 14-0 before shutting things down for the season; Manning was always a shoe-in for that award, thanks to a whopping 7 fourth quarter comebacks in those 14 games; no other quarterback had more than 3 that season.  But in terms of ANY/A (and Value), Rivers and Brees were better choices than Manning both years.

In addition, Brees had three seasons where he ranked 2nd in value (’06, ’11, ’17) and two more where he ranked 3rd (’12, ’13). Rivers had a third 2nd-place finish in value in 2010 (behind MVP Brady), and also had a 3rd (2017), 4th (2013), and 5th (2006) place finish.

This year, both players are having remarkable seasons, but Rivers ranks 3rd in Value and Brees ranks 6th in Value. Yes, it looks like Patrick Mahomes or Jared Goff or even Todd Gurley could be what stops Brees and Rivers from that elusive first AP MVP Award.

The graph below shows Brees, Rivers, and the leader in Adjusted Net Yards over average for each year since 2006. The NFL leader is in red; Rivers is in Chargers colors, and Brees is in Saints colors.  Both Rivers and Brees have had a lot of great seasons, but seasons that fall just shy of MVP-level  great.

Rivers and Brees both were victims of Manning in ’08 and ’09, but the biggest snake eyes either of them rolled was in 2011. That year, Rodgers had his best season and was historically great — the only better seasons since ’06, by value, were Manning ’13 and Brady ’07. But Brees 2011 was also great — in fact, it’s the 5th-best season since ’06, with Ryan ’16 being the only other season ahead of him. It just so happens that Brees picked a bad time to have a career season.

{ 0 comments }

Previously:

Houston, Seattle, and Indianapolis were your three most run-heavy teams of the week, in large part because their team’s quarterbacks were so darn efficient. The Seahawks had the best passer rating of week 8, followed by the Texans, the Raiders, and the Colts. Seattle was noticeably rush-heavy: yes, the Game Script was heavily in Seattle’s favor, but the Seahawks became the first team in 2018 to rush on over 68% of plays.

On the other side of things, the Jaguars and Giants were the three most pass-happy teams of week 8. Jacksonville, a week after trading for Carlos Hyde, passed on 72% of all plays in a tight game… and that includes Blake Bortles being responsible for 8 of the team’s 17 runs! Including sacks, pass attempts, and rushes, Bortles was the Jaguars guy on 53 of 62 plays, or 85.4% of all Jacksonville plays.

The full week 8 Game Scripts data, below: [continue reading…]

{ 0 comments }

Since the start of the 2013 season, the top 5 players in receptions consist of three future Hall of Famers — Antonio Brown, Julio Jones, and Larry Fitzgerald — and two players traded yesterday.  Those two players, Demaryius Thomas and Golden Tate, may not be bound for Canton, but they should be remembered as two of the best receivers of the ’10s.

Thomas may well wind up on as a second team member of the  All Decade team of the ’00s.  As of today, he ranks 3rd in the decade in receiving yards (behind Brown and Jones), third in receptions (behind Brown and Fitzgerald), and 8th in receiving touchdowns.  Tate has a reputation as one of the best receivers in the NFL in terms of yards after the catch: he’s averaged 6.7 yards after the catch since 2013, easily the most of any wide receiver with a significant number of receptions.

The two receivers have both made a living on short passes; on passes within 15 yards of the line of scrimmage, the duo rank 2nd and 3rd in receptions behind Brown.  And given that both players are now changing teams — Tate was traded to the Eagles for a 3rd round pick, Thomas was traded to the Texans for a 4th round pick — it’s worthwhile to see how each receiver has done under different passers.  In particular, given how both have been great on shorter passes, I used the PFR Index to see the quarterback breakdown for each receiver on passes since 2013 under 15 yards from the line of scrimmage. [continue reading…]

{ 0 comments }

Week 8 Passing Stats: Watson, Wilson, Newton Dominate

The three best dual threat quarterbacks in the NFL right now are Cam Newton, Russell Wilson, and Deshaun Watson. You can make a good case that they were also the three best quarterbacks of week 8.

Watson was the most valuable passer of week 8, throwing for 5 TDs on just 20 dropbacks, with zero interceptions and zero sacks. Wilson was the second most valuable passer of the week, and became just the second player in the last three seasons to have a perfect passer rating while throwing at least three touchdown passes. And Newton led all quarterbacks with 52 rushing yards and a touchdown, led the Panthers to 36 points on 7 scores on 10 drives, and did not take a sack or an interception.

The full week 8 passing stats below. The average ANY/A this week was 6.98; as always, Value is calculated as the difference between each passer’s ANY/A and the weekly average, multiplied by that passer’s number of dropbacks. [continue reading…]

{ 0 comments }

Jameis Winston entered the NFL as a 21-year-old in 2015. Now, midway through his fourth season, Winston still has a number of rookie struggles. He currently has a 6.8% interception rate in 2018, bringing his career interception rate up to 3.2%. Among the 39 passers with 500 attempts since 2015, Winston has the worst interception rate in the NFL.

On the other hand, interceptions are not a very sticky statistic, and a pretty poor way of evaluating quarterback play.  Winston is an aggressive passer who has played on bad teams, so that tends to lead to interceptions.  And young quarterbacks — Winston is still just 24 — sometimes struggle with interceptions, especially on bad teams.

Meanwhile, Winston has been downright remarkable at picking up first downs.  Including sacks, Winston has picked up a first down on 37.3% of his dropbacks since entering the league; that’s the 2nd-best rate in the NFL over that span.  Last year, he led the league in percentage of pass attempts that went for a first down; this year he’s been even better (although he only ranks 3rd).  Including sacks, he has still picked up a first down on 40% of his dropbacks.

Since 2015, Winston ranks 1st in INT rate and 2nd in Passing First Down rate.  No other player ranks in the top 9 in both, although Roethlisberger, Newton, and Fitzpatrick rank in the top 12 in both stats. [continue reading…]

{ 1 comment }

It was not a particularly eventful week in terms of college football upsets. No top-5 SRS teams lost, and only two top-10 SRS teams lost — and both lost to very good teams. Iowa ranked 7th in the SRS last week, and lost on the road to Penn State, who ranked 11th in the week 8 ratings. The annual Florida/Georgia game in Jacksonville featured two top 10 teams, with then-#3 Georgia defeating then-#8 Florida.

Other top teams to lose: #13 Washington, #15 Texas A&M, #16 Purdue, #21 Texas Tech, #22 Missouri, #23 Wisconsin, and #26 Texas. The Longhorns may have been 26th in the SRS, but with a 6-1 record and wins over USC, TCU, and Oklahoma, the Longhorns entered week 8 6th in the AP rankings. A loss to Oklahoma State (hi Doug!) in Stillwater now puts the Big 12 playoff picture into chaos. Next week, West Virginia travels to Austin in a matchup of two of the top teams in the conference.

Alabama was off this week, which opened the way for Georgia and Clemson to be the dominant teams of the week. Both teams demolished teams from Florida: the Bulldogs defeated a pretty good Florida team by 19, while Clemson crushed a bad Seminoles team by 49 points. West Virginia, Arizona, and Utah round out the top 5 teams of the week in terms of single game SRS ratings. [continue reading…]

{ 0 comments }

Interceptions By Win Probability

Against the Jets in week 5, trailing 34-16 with 11 seconds left, Case Keenum threw an interception on the game’s final play.

Against the Broncos in week 1, the Seahawks had the ball with 2 seconds left at their own 11-yard line, down by 3. Russell Wilson threw an interception on the game’s final play.

Against the Panthers in week 3, the Bengals were down 31-21 with 3 seconds left when Andy Dalton threw an interception on the game’s final play.

Trailing 30-14 against the Chiefs, with 9 seconds left, Blake Bortles threw an interception on the game’s second-to-last play.

All of these are examples of meaningless interceptions, at least from a win probability perspective. These teams all had a less than one percent chance of winning the game, and the interception therefore was not meaningful. Tom Brady had one of these, too: the Patriots had a win probability of over 99% when, up 38-0 in the 4th quarter, he threw an interception. That pick was meaningless.

We should not treat all interceptions equally, and with win probability data becoming more mainstream, we are no longer restricted by a game’s box score. A special thanks to Ron Yurko (@Stat_Ron) for providing the raw data. [continue reading…]

{ 1 comment }

Danielle Hunter Is Remarkable

Vikings defense end Danielle Hunter has recorded a sack in every game this season, making him just the 8th player since 1982 to record a sack in each of his team’s first 8 games:

 
Rk Year Tm W L T W-L% Count
1 William Fuller 1994 PHI 5 2 0 0.714 7
2 Shaun Ellis 2003 NYJ 2 5 0 0.286 7
3 Robert Mathis 2005 IND 7 0 0 1.000 7
4 DeMarcus Ware 2008 DAL 4 3 0 0.571 7
5 Dwight Freeney 2009 IND 7 0 0 1.000 7
6 Demarcus Lawrence 2017 DAL 4 3 0 0.571 7
7 Everson Griffen 2017 MIN 5 2 0 0.714 7
8 Danielle Hunter 2018 MIN 4 2 1 0.714 7

[continue reading…]

{ 1 comment }

Back-To-Back Long Winning/Losing Streaks

In 2017, the Houston Texans lost their final six games of the season. Tom Savage started the first of those three games, with T.J. Yates starting the final three. This year, with Deshaun Watson back from injury, the Texans… lost their first three games of the season. So entering week 4, Houston was on a 9-game losing streak. Since then? Houston has won four straight, and with a home game against the Dolphins tonight, have a good chance of running that winning streak to five straight. With a win in Denver next week, the Texans would have followed a streak of 6+ straight losses by, immediately, winning 6+ straight games.

That’s pretty rare: only six teams have ever strung together back to back streaks of 6+ wins and 6+ losses. And if Houston runs the streak to 9 straight wins, the Texans would be the first team to ever have back-to-back 9-game streaks.

The longest streak? That belongs to the San Diego Chargers. In 1987, the Chargers lost the season opener, but responded by winning 8 consecutive games (including three with replacement players). And then San Diego promptly lost 8 straight games, marking the only time a team has ever had back-to-back 8-game winning/losing streaks. For those curious, a 36-year-old Dan Fouts was the starter for 5 of the games during the winning streak, and four of the games during the losing streak, which stretched into 1988.

Just two other times has a team had a 6+ game winning streak followed by a 6+ game losing streak. In 1977, the Don Coryell Cardinals began the season 1-3 before Jim Hart and crew went on a 6-game winning streak, bringing St. Louis’s record to 7-3. From that point on, the Cardinals lost their final four games of the regular season and the team’s first eight games of 1978 under Bud Wilkinson.

Finally, the 2001 Rams under Kurt Warner won their final six regular season games, plus the team’s two NFC playoff games, allowing St. Louis to enter the Super Bowl on an 8-game winning streak. The Rams lost to the Patriots in the Super Bowl, of course, and then began the 2002 season on a 5-game losing streak, with Warner the starter for all but the final game. And at 0-5, the Rams responded with a 5-game winning streak, then under Marc Bulger!

What about teams like the Texans, who followed long losing streaks with long winning streaks? There are just three of those teams, using 6-game minimums.

In 1970, the Cincinnati Bengals had one of the more interesting seasons in NFL history.  With Paul Brown and Bill Walsh as offensive masterminds, the Bengals found a gem in Greg Cook to be the team’s quarterback in 1969.  Unfortunately, Cook suffered what would be a career-limiting injury, and the Bengals brass turned the ball over to Virgil Carter.  You know the story from there, as Carter, Walsh, and Brown helped usher the West Coast Offense into the NFL.  After winning the team’s opener, Cincinnati lost 6 straight games, before going on a 7-game winning streak to end the regular season.  The Bengals lost the team’s only playoff game.

In 1994, the New York Giants began the season 3-0, then lost 7 straight games, and then won the team’s final 6 games. Dave Brown was the team’s quarterback for all but one game.

Finally, we have the 1974 Jets, with a 31-year-old Joe Namath who managed to play every game that season.  New York lost its first game, won its second game, and then won on a 6-game losing streak followed by a 6-game winning streak to end the season.  From weeks 3 through 8, the Jets ranked 25th in passer rating and 17th in Net Yards per Attempt; during the final six weeks, the Jets ranked 3rd in passer rating and 3rd in NY/A.

{ 0 comments }

Previously:

Your most remarkable Game Scripts-related stat of the week comes from the Saints. If you knew that New Orleans trailed 17-7 after the third quarter, and that Drew Brees was healthy (and effective!), what would you expect the Saints pass ratio to be?

65% 75%? 80%?

Try 44%! New Orleans finished the day with 39 rushes against just 31 pass plays, a 44% pass ratio. How remarkable is that?

The last time the Saints trailed by 7 or more points entering the third quarter, and ran on 55% or more of their plays… was in 1983! In fact, when trailing by 7 or more through three quarters, the Saints have never rushed on 50% or more of their plays in the Drew Brees era! And this was a 10-point third quarter deficit!

In fact, since 2000, there have only been three games where New Orleans trailed by a touchdown entering the 4th quarter and finished the game with more rushes than pass plays:

  • A 2005 game against the Bears
  • This 2004 game against Tampa Bay.

New Orleans finished with 12 passing first downs and 12 rushing first downs, the sort of balanced attack that has rarely been seen for the Saints. Even the ground game was balanced: Alvin Kamara had 4 rushing first downs, Brees had 3 (all on 3rd- or 4th-and-1), Taysom Hill had 3, and Mark Ingram had two.  Remarkably, New Orleans had four 4th-down conversions, and all four game on the ground.
[continue reading…]

{ 0 comments }

Week 7 Passing Stats: The Rookies Play Like Rookies

This was not a good week to be a rookie quarterback. Josh Allen was on the sidelines due to an injured elbow, and he may have had the best week of any of the top rookie passers.

Josh Rosen was a disaster on Thursday night, as he threw two picks six as his Cardinals were destroyed, 45-10. Even ignoring that two of his three interceptions were returned for touchdowns, Rosen finished with a 0.87 ANY/A average, the worst of any quarterback in week seven.

Sam Darnold was not much better. The Jets had six drives in the second quarter, and picked up zero first downs. For the game, Darnold finished with 45 dropbacks and threw for just 7 first downs, and his 16% passing first down rate was the worst of any quarterback in week seven.

Baker Mayfield was only slightly better: the Browns seven first half drives ended in six straight punts and a turnover on downs when Cleveland took possession at the Tampa Bay 19-yard line. Cleveland had 6 three-and-outs, and the Browns picked up a first down on just 21% of all passing plays: third-worst of the week, ahead of only the Cardinals and Jets.

The top passers this week were Rivers and Mahomes, who have separated themselves as the top two quarterbacks in the AFC this season. The full week 7 passing stats below. On average this week, teams completed 22.1 of 34.0 passes, for 247.4 gross passing yards, with a 93.4 passer rating. [continue reading…]

{ 1 comment }

Four teams saw their SRS ratings drop by at least 4 points from their rating one week ago: Ohio State, Oregon State, Minnesota, and Tulane. In that group, Ohio State was the notable loss, of course: Purdue was 38th in the SRS — so better than people may have realized — but still had a rating 14 points lower than that of the Buckeye. Yet in week 8, Purdue blew out Ohio State 49-20, producing one of the three best performances of the season (joining ALabama’s 62-7 blowout against Ole Miss and LSU’s 36-16 win over Georgia).

Purdue was joined by Virginia, North Carolina, California, and Nebraska as teams that saw their SRS rise by at least 4 points. Below are the full SRS ratings through 8 weeks. As always thanks to Dr. Peter R. Wolfe for providing the weekly game logs. [continue reading…]

{ 0 comments }

Todd Gurley Through 50 Games

Todd Gurley is now 50 games into his NFL career, and he is only getting better. He is averaging an impressive 109.4 yards from scrimmage per game, but he’s been noticeably better since Sean McVay arrived.

As a rookie in 2015, Gurley averaged about 100 yards from scrimmage per game but faded down the stretch, topping the century mark just once in his last seven games. In 2016, in an ugly Jeff Fisher offense, Gurley was extremely consistent, but not in a good way: he did not pick up 109 yards in a single game that season. But since McVay arrived, Gurley has topped his current career average in 16 of 21 games.

The graph below shows the yards from scrimmage gained by Gurley in every regular season game of his career, color-coded by year. [continue reading…]

{ 0 comments }

Which teams are throwing the most to one receiver? Which teams are spreading it around the most? A good way to answer that is by using a Concentration Index. Let’s use Andrew Luck and the Indianapolis Colts as an example. Eric Ebron is the team’s leading receiver with 326 receiving yards, which represents 18.2% of the team’s total 1,796 receiving yards. To calculate a team’s concentration index in receiving yards, you need to square the percentage of receiving yards by each player, and sum the results. For example, 18.2% squared is 3.3%; do that for every player on Indianapolis and the total is 12.6%.

As it turns out, that’s the most diverse passing attack in the NFL. The most concentrated passing attack? That’s in Detroit:

The table below shows the concentration index for each team through six weeks, along with each team’s passing efficiency (as measured by ANY/A). Here’s how you read the top line. Detroit has the highest concentration index. The Lions have 1,404 receiving yards and have averaged 6.17 ANY/A, which ranks 20th in the NFL. Tate is the team’s leading receiver with 31% of the Lions receiving yards, and the team has a concentration index of 23%. [continue reading…]

{ 1 comment }

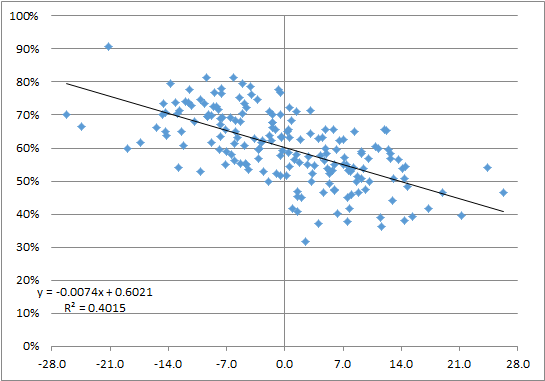
Below is a scatter plot showing the Game Scripts (on the X-Axis) and pass ratio (on the Y-Axis) of every game so far this season. I have also provided a best-fit line:

[continue reading…]

{ 1 comment }

Previously:

Entering week 6, the Cowboys had Game Scripts of -6.0 against the Panthers, +10.1 against the Giants, -7.8 against the Seahawks, +1.6 against Detroit, and +0.2 against the Texans.

Entering week 6, the Jaguars had Game Scripts of +3.6 against the Giants, +12.2 against New England, -1.5 against Tennessee, +8.2 against the Jets, and -13.7 against the Chiefs.

So color me surprised to see Jacksonville get throttled on Sunday against the Cowboys in Dallas, losing 40-7 and finishing with a -17.3 Game Script. It wasn’t quite a Vikings against the Bills level upset, but Jacksonville was a 3-point favorite; it is pretty unusual for a 3-point dog to lead by 21+ points at halftime and win by 30+ points; in fact, the last time it happened, the Jaguars were on the other side of things.

The full week 6 Game Scripts are below: [continue reading…]

{ 0 comments }

In week 1, the average over/under across 16 games was 44.8. In 9 of those games, the over hit.

Week 2 was when the passing explosion began; in 8 games that week, the teams combined for 48+ points, and in the other 8, teams failed to top 41 points. Nearly every over/under is between 41 and 48 points, so the O/U didn’t matter much this week: in the 8 games that produced 48+ points, the over hit, and in the other 8 games, the under hit.

But that doesn’t mean Vegas wasn’t aware of the passing explosion. The average over/under in week 2 was 45.0, but it jumped to 46.1 in week 3. Once again, we had a 41/48 split: no team scored 42, 43, 44, 45, 46, or 47 points in week 3. So the over/under didn’t matter: 8 games had 48+ points scored and went over, and 8 games had 41 or fewer points and went under. But Vegas had already begun raising the line.

How much? Week 4 had an average over/under of 46.7! And yet the over was still the good bet, as 9 of 15 games went over. This despite the rare event of two games producing 50+ points and still going under! In week 4, 10 out of 15 games combined for 49 or more points, in the greatest passing week in NFL history.

So in week 5, the over/under average jumped to 47.3…. and the over still hit more often than not! There were 8 games with 46+ points scored (7 had 50+ points scored), and the over hit in all of them. The other 7 games all went under, including two games with 44 points scored.

And last week the over/under average was 46.8, perhaps artificially lower because the Saints and Lions (who had 50+ point over/under lines in week 5) were on bye. And yet in week 6, 9 out of 15 games went over.

The table below shows the weekly over/under results this year. The Under has never been a winner, and the books seem to be doing all they can to make over/unders high enough to get people to bet the under: [continue reading…]

{ 0 comments }

The Buffalo Bills have the worst passing attack in the NFL, and it is not particularly close. The NFL is averaging 6.5 Adjusted Net Yards per Attempt, the 30th-best passing offense is averaging 4.5 ANY/A, and the 31st-best passing attack is averaging 4.1 ANY/A.  The Bills? They are averaging 2.0 ANY/A and have reached the cellar by being bad at every facet of the passing game.  The Bills rank last in the league in completion percentage, passing yards, passing touchdowns, passing touchdown rate, and yards per attempt. The Bills also have the worst sack rate *and* the worst interception rate in the NFL.

In 1941, the league average completion percentage was 44.3%; the 2018 Bills are completing passes at a 50.6% clip.

In 1941, the average NFL team gained 122 passing yards per game; the 2018 Bills are gaining 123 passing yards per game.

In 1941, NFL teams threw an interception on 10% of passes; the 2018 Bills have thrown an interception on 7.3% of passes.

But if you pick any year more recent than 1941, you might think Buffalo was a below-average passing team.  The league average completion percentage has been over 50.6% in every season since 1961. When it comes to interceptions, 1975 and 1971 are the only post-merger seasons where the league average more than 1.5 interceptions per game.  And in passing yards per game?  It’s been higher than Buffalo’s current average in every season beginning in 1942.

If you want to use yards per attempt, you have to go back to 1935 to find a season where Buffalo’s current 5.39 Y/A average would be above average.   The last time the league average ANY/A was below 2.0 was in 1938, and the NFL has never had a NY/A average as poor as the 2018 Bills.

So yes, Buffalo’s passing performance this season has been otherworldly.  And it got worse in week 6, as Josh Allen and Nathan Peterman combined to gain just 129 passing yards on 31 dropbacks, while throwing two interceptions.  And with 90 seconds left in the 4th quarter of a tie game, Peterson threw a brutal pick six that swung the game to Houston.

Below are the week 6 passing stats, with some familiar names at the top.

RkQuarterbackTmOppResultAttYdsTDIntSkYdsANY/AVALUE
1Matt RyanATLTAMW 34-294135430189.67136
2Aaron RodgersGNBSFOW 33-3046425203209.08130
3Patrick MahomesKANNWEL 40-433635242009.5110
4Tom BradyNWEKANW 43-4035340102139.38109
5Mitch TrubiskyCHIMIAL 28-3131316312139.64106
6Jameis WinstonTAMATLL 29-344139542268.81102
7Ben RoethlisbergerPITCINW 28-214636910008.4693
8Carson WentzPHINYGW 34-133627830178.9593
9Russell WilsonSEAOAKW 27-32322231189.5475
10Brock OsweilerMIACHIW 31-284438032007.9567
11C.J. BeathardSFOGNBL 30-3323245212188.8861
12Sam DarnoldNYJINDW 42-3430280212138.1956
13Philip RiversLACCLEW 38-1420207211129.0555
14Dak PrescottDALJAXW 40-727183203117.0719
15Case KeenumDENLARL 20-2341322212256.7915
16Geno SmithLACCLEW 38-1418000082
17Cam NewtonCARWASL 17-234027521166.440
18DeAndre HopkinsHOUBUFW 20-131000000-6
19Joe FlaccoBALTENW 21-03723811005.76-25
20Andrew LuckINDNYJL 34-424330143005.72-31
21Andy DaltonCINPITL 21-2842229203165.62-37
22Kirk CousinsMINARIW 27-1734233114175.03-54
23Josh AllenBUFHOUL 13-201784002163.58-54
24Alex SmithWASCARW 23-173616320375.03-55
25Josh RosenARIMINL 17-2731240014324.66-62
26Blake BortlesJAXDALL 7-4026149113103.93-73
27Jared GoffLARDENW 23-2028201015273.91-83
28Nathan PetermanBUFHOUL 13-2012611200-0.75-86
29Eli ManningNYGPHIL 13-3443281014274.45-94
30Marcus MariotaTENBALL 0-21151170011661.96-116
31Derek CarrOAKSEAL 3-2731142006362.86-132
32Deshaun WatsonHOUBUFW 20-1325177127352.25-134
33Baker MayfieldCLELACL 14-3846238125242.82-184
Total102878055328804736.440

And in addition, here are the passing stats to date. I am using 15 dropbacks multiplied by the number of weeks in the season to determine whether a passer has qualified. The table has 58 rows, but for ease of reading, I have defaulted to only showing the top 10.

RkQuarterbackTmAgeAttYdsTDIntSkYdsANY/AValue
1Patrick MahomesKAN2321218651846269.26606
2Jared GoffLAR24194192812511689.15546
3Drew BreesNOR3919016581108649.16531
4Philip RiversLAC3719417021537529.03512
5Matt RyanATL332241955142171088.45475
6Ryan FitzpatrickTAM3612913561157379.66433
7Aaron RodgersGNB352541997121191277.56296
8Ben RoethlisbergerPIT3626120331269597.2194
9Kirk CousinsMIN30260192112318986.94126
10Carson WentzPHI2615811928113967.08103
11Tom BradyNWE4121415991368506.93100
12Mitch TrubiskyCHI24161126111412807.06100
13Russell WilsonSEA301651308134191256.8670
14Matthew StaffordDET3019113851059596.515
15Alex SmithWAS3417112056212696.37-20
16Andy DaltonCIN312291674147121006.39-23
17Deshaun WatsonHOU23217179897251206.38-26
18Joe FlaccoBAL3326417889411416.35-35
19Cam NewtonCAR291701158948466.25-42
20C.J. BeathardSFO25114892657775.87-74
21Jimmy GaroppoloSFO27897185313975.75-75
22Ryan TannehillMIA301299728511985.78-98
23Josh RosenARI2190626227545.38-107
24Sam DarnoldNYJ2117913469713855.86-118
25Derek CarrOAK2723317837817975.86-154
26Eli ManningNYG37230166264201545.79-172
27Blake BortlesJAX2623716749814685.68-201
28Baker MayfieldCLE2315310764513865.09-231
29Dak PrescottDAL25171114474191125.22-240
30Case KeenumDEN30233168778151065.49-246
31Andrew LuckIND29288179216810765.62-256
32Tyrod TaylorCLE29844622213813.41-298
33Marcus MariotaTEN251187932417994.1-321
34Josh AllenBUF2213983225211673-557
NQNick FolesPHI2982451115264.6-164
NQSam BradfordARI3180400246332.64-330
NQJameis WinstonTAM2461540544176.8222
NQBrock OsweilerMIA284941542008.2787
NQBlaine GabbertTEN2945242113254-119
NQNathan PetermanBUF24308514312-2.64-301
NQMatt SchaubATL3772000002.86-25
NQDeShone KizerGNB2275501221-1.22-69
NQMatt CasselDET366140100-5.17-70
NQLamar JacksonBAL2152400182.67-23
NQTaysom HillNOR2821000005-3
NQKevin ByardTEN2516610008680
NQOdell BeckhamNYG2615710007771
NQAlbert WilsonMIA2615210007266
NQNelson AgholorPHI251150000159
NQDerrick HenryTEN2418000082
NQGeno SmithLAC2818000082
NQCorey BojorquezBUF221000000-6
NQJacoby BrissettIND251000000-6
NQJohnny HekkerLAR281000000-6
NQDeAndre HopkinsHOU261000000-6
NQJK ScottGNB221000000-6
Lg Avg0067305070432816946530246.480
{ 0 comments }

Smith and Davis with the 49ers

On Sunday against the Panthers, Washington quarterback Alex Smith threw a touchdown pass to tight end Vernon Davis. Over 12 years ago, the two connected for the first touchdown reception of Davis’s career, back when both players were with the 49ers.

How rare is it for a quarterback to throw a touchdown pass to a player, and then throw a touchdown pass 12 years later to the same player on a new team? Well, it’s never happened before. The closest was with Randall Cunningham and Cris Carter; the duo connected for a touchdown pass in November 1987 with the Eagles, and last connected for a touchdown pass in September 1999 with the Vikings, a span of nearly 12 years.

The table below shows, through 2017, all QB/Receiver pairings where the duo connected for touchdown passes on different teams.  I have used “different teams” liberally here (e.g., including the old Browns and Ravens as different teams), but you can consider them the same team if you like.

QBReceiverFirst TDFirst TmLast TDLast TmTD Tm1TD Tm2Total TDsYears
Alex SmithVernon Davis09/10/2006sfo10/14/2018was3513612.1
Randall CunninghamCris Carter11/01/1987phi09/12/1999min17163311.9
Y.A. TittleHugh McElhenny10/05/1952sfo10/27/1963nyg1321511.1
Drew BledsoeTerry Glenn09/08/1996nwe10/01/2006dal21103110.1
Peyton ManningBrandon Stokley12/14/2003clt01/12/2013den186249.1
Jay SchroederGary Clark12/08/1985was12/04/1994crd141159
Steve McNairDerrick Mason10/25/1998oti09/23/2007rav303338.9
George BlandaBilly Cannon10/30/1960oti11/24/1968rai201218.1
Jay CutlerEddie Royal09/08/2008den09/11/2016chi5278
Jay CutlerBrandon Marshall12/03/2006den11/16/2014chi1426408
Ken StablerDave Casper09/22/1974rai11/29/1981oti387457.2
Zeke BratkowskiCarroll Dale09/17/1961ram10/20/1968gnb47117.1
Brian GrieseDesmond Clark09/04/2000den10/07/2007chi7297.1
Vinny TestaverdeMark Carrier12/06/1987tam01/01/1995cle215267.1
Jim HarbaughCurtis Conway10/10/1993chi11/05/2000sdg2247.1
Carson PalmerT.J. Houshmandzadeh11/28/2004cin12/04/2011rai341357
Fran TarkentonBob Tucker10/25/1970nyg10/30/1977min8197
Neil O'DonnellYancey Thigpen09/19/1993pit09/10/2000oti114157
Vinny TestaverdeKeyshawn Johnson09/20/1998nyj12/19/2004dal86146.2
Carson PalmerJermaine Gresham09/12/2010cin11/27/2016crd4376.2
Jack KempKeith Lincoln11/12/1961sdg12/09/1967buf1566.1
Trent DilferDarrell Jackson11/04/2001sea10/21/2007sfo5166
Billy WadeJoe Marconi09/26/1959ram10/25/1964chi1455.1
Steve DeBergTony Martin12/05/1993mia12/27/1998atl1125.1
Neil O'DonnellJeff Graham09/06/1992pit08/31/1997nyj1345
Jim HarbaughFloyd Turner09/04/1994clt12/13/1998rav105154.3
Jim HarbaughRoosevelt Potts09/25/1994clt12/27/1998rav2244.3
Browning NagleTerance Mathis10/04/1992nyj12/02/1996atl2134.2
Earl MorrallNorm Bulaich10/10/1971clt12/01/1975mia2134.1
Jim HardyBob Shaw10/20/1946ram12/10/1950crd111124.1
Ralph GuglielmiJoe Walton11/02/1958was12/09/1962nyg5164.1
Vinny TestaverdeMichael Jackson10/24/1993cle11/16/1997rav1217294.1
Ernie NeversCobb Rooney10/10/1926dul10/26/1930crd2354
Josh McCownMatt Forte11/17/2013chi12/03/2017nyj2134
Lamar McHanGary Knafelc10/04/1959gnb10/20/1963sfo2134
Vinny TestaverdeBrian Kinchen09/26/1993cle10/05/1997rav3254
Tarvaris JacksonSidney Rice11/25/2007min11/20/2011sea7294
Peyton ManningJacob Tamme11/01/2010clt09/21/2014den46103.9
Frank ReichPete Metzelaars12/15/1991buf09/03/1995car2133.7
Rodney PeeteIrving Fryar09/01/1996phi01/02/2000was3143.3
Chuck MuncieWes Chandler09/02/1979nor12/20/1982sdg1233.3
George TaliaferroDick Wilkins09/02/1949lda11/27/1952dtx2133.2
Boomer EsiasonRob Moore09/05/1993nyj11/17/1996crd6173.2
Vinny TestaverdeDerrick Alexander09/18/1994cle11/02/1997rav216183.1
Milt PlumTom Watkins09/24/1961cle11/01/1964det1123.1
Rich GannonAndre Rison11/30/1997kan12/16/2000rai56113
Bob GaglianoTerry Greer10/11/1987sfo10/07/1990det1123
Kent GrahamLeShon Johnson09/29/1996crd09/26/1999nyg1123
James HarrisBob Klein11/04/1974ram10/30/1977sdg5163
Josh McCownAustin Seferian-Jenkins11/09/2014tam10/22/2017nyj1343
Rich GannonDerrick Walker11/28/1996kan10/10/1999rai1122.9
Gus FrerotteRandy McMichael09/11/2005mia12/02/2007ram5272.2
Kyle OrtonBrandon Lloyd09/21/2008chi11/28/2010den29112.2
Erik KramerChris Penn10/12/1997chi10/03/1999sdg5162
Norm SneadBob Grim10/31/1971min10/21/1973nyg1342
Benny FriedmanLen Sedbrook11/18/1928dwl10/05/1930nyg2681.9
Jeff BlakeWillie Jackson09/12/1999cin11/05/2000nor2131.1
Benny FriedmanOssie Wiberg11/06/1927cib12/09/1928dwl2241.1
Benny FriedmanRex Thomas10/30/1927cib11/29/1928dwl2241.1
Al DekdebrunRay Ebli11/10/1946bba12/07/1947cra1121.1
Vinny TestaverdeEarnest Byner09/24/1995cle10/20/1996rav1121.1
Benny FriedmanCarl Bacchus10/23/1927cib11/11/1928dwl3361.1
Benny FriedmanProc Randels11/27/1927cib12/09/1928dwl1121
Bob CeleriBuddy Young10/21/1951nyy10/26/1952dtx2131
Bob CeleriGeorge Taliaferro12/09/1951nyy10/18/1952dtx2130.9

Stabler and Casper hold the record for combined touchdowns on two teams, at 45, although most of those were in Oakland. Bledsoe/Glenn, Cunningham/Carter, Cutler/Marshall, and — if you want to include them, Testaverde/Jackson and Testaverde/Alexander — are the only pairs to connect for double digit touchdowns on two different teams.

{ 0 comments }

It was an eventful week of college football, with 6 teams ranking in the top 16 falling in week 7:

  • #2 Georgia was blown out by LSU, 36-16.
  • #6 West Virginia lost to giant killer Iowa State; over the last 53 weeks, the Cyclones have beaten three Big 12 teams that ranked in the top 6: Oklahoma and TCU in 2017, and the Mountaineers 30-14 on Saturday.
  • #7 Washington, which had a loss to Auburn in the season opener (and which only looks uglier in retrospect, as the Tigers have gone 2-3 against the rest of the FBS since then), had a perhaps fatal loss to Oregon on Saturday afternoon. The Huskies lost in overtime, 30-27, in Eugene.
  • #8 Penn State, a week after a narrow home loss to Ohio State, was upset 21-17 at home against Michigan State.
  • #15 Wisconsin was obliterated by Michigan in Ann Arbor, 38-13. The 25-point differential was the worst by the Badgers in a true road game in over a decade.
  • #16 Miami lost to Virginia, 16-13.

In addition, Notre Dame narrowly beat Pittsburgh (19-14), Central Florida barely escaped Memphis (31-30), and Texas, Texas Tech, and Texas A&M all escaped with one-score wins. [continue reading…]

{ 0 comments }

Doug Williams was a better passer with the Bucs than he gets credit for, particularly in 1979. He easily led the NFL in sack rate, with an absurdly low 1.7%, when the league average was 7.5%. He also averaged 14.7 yards per completion, the 4th-best rate in the league. But Williams completed only 41.8% of his passes, which was bad even for a 2nd-year quarterback in 1979.

The Bucs ranked dead last in completion percentage (42.2%), with the 27th-best team in completion percentage over five percentage points higher at 47.4%. But as I noted last week, passing first down percentage is a more important metric than completion percentage. And because Williams had a remarkable sack rate and was a downfield thrower, the Bucs picked up a first down on 30.7% of all passing plays. In 1979, that ranked a respectable 12th in the 28-team league.

The Bucs were 11.9% below average in completion percentage but 1.2% above average in passing first down percentage. That’s a difference of 13.1%, which is the largest difference between any team’s completion percentage and passing first down rate since 1970. The full results below: [continue reading…]

{ 1 comment }

Let’s compare two groups of 2018 receivers.

Group A

Adam Thielen
Odell Beckham
DeAndre Hopkins
Zach Ertz
Julio Jones

Group B

Brandin Cooks
George Kittle
Mike Evans
Tyreek Hill
Cooper Kupp

Which group of receivers would you rather have going forward? I think you know the answer to that question.

The receivers in Group A are the top 5 receivers this season as measured by one simple metric: yards multiplied by targets.

The receivers in Group B are the top 5 receivers this season as measured by another simple metric: yards divided by targets, based on a the players who rank in the top 50 this season in targets.

Here’s how to read the table below. Brandin Cooks has played 5 games this year and has seen 33 targets and gained 452 receiving yards. If you multiply his yards by his targets, he has 14,916, and his Yards x Target rank is 28th. On the other hand, he has averaged 13.7 Yards per Target, which ranks 1st in the league through five weeks. [continue reading…]

{ 1 comment }

Previously:

The Buffalo Bills got rid of Tyrod Taylor, spent a first round pick on a quarterback, and are somehow more run-heavy! In 2018, the Bills had the strongest rush identity in the NFL, in large part because of Taylor. Yet on Sunday, Buffalo produced the most run-heavy game of the year, rushing more than twice as often as passing in a 13-12 win against the Titans. The only time the Bills did that last year was in the snow storm against the Colts.  In week 5, Josh Allen had 20 dropbacks and gained just 78 yards; Allen rushed 4 times for 19 yards and a touchdown, LeSean McCoy had 24 carries for 85 yards, and Chris Ivory had 14 carries for 43 yards.

The most pass-happy team of the week is also the most pass-happy team from 2017: the New England Patriots. Against the Colts, the Patriots led 7-0 after 6 minutes, 14-0 after 18 minutes, 24-3 at halftime, and 38-17 midway through the 4th quarter. And yet Tom Brady finished the day with 44 pass attempts, while Patriots running backs had just 20 carries. This game was the 5th time in the last 10 years that the Patriots had 44+ pass attempts despite leading by 14+ at both halftime and the end of the game; over that same period, the rest of the NFL had done it just four times. That’s why New England — with the 4th-best Game Script of the week and the highest Pass Ratio of any team with a positive Game Script in week 5 — was the most pass-happy team of the week.

The full week 5 Game Scripts are below: [continue reading…]

{ 0 comments }

It was not a good day for Blake Bortles and the Jaguars in week 5. He finished the game with a 3.65 ANY/A, going 33/61 for 430 yards, with 1 TD, 4 interceptions, and 5 sacks for 29 yards. Even those numbers overstate things: At halftime, he was averaging 0.92 ANY/A, and after 40 minutes, he was averaging just 1.86 ANY/A. With some good passing numbers when the game was out of hand, Bortles bumped his ANY/A to 4.40, before it dropped to 3.65 when he threw a meaningless interception on the final play of the game.

One interesting way to show how the game progressed is by using a bubble chart, where the size of each bubble represents the scoring differential, the X-Axis represents time elapsed in the game, and the Y-Axis shows adjusted net yards. Each bubble represents one attempt. As you can see, a lot of Bortles’ production came when the game was out of hand (and win probability would be an even better metric to use than scoring differential here, as the “larger” bubbles late in the fourth quarter were also when the game was out of hand due to time remaining as much as scoring differential):

[continue reading…]

{ 0 comments }