≡ Menu

ANY/A and the HOF Gray Ink Test

A few years ago, I looked at Eli Manning and the HOF in the context of an ANY/A Gray Ink test. What do I mean by that? Here’s what I did:

  • Step 1) Calculate each quarterback’s ANY/A for each season of his career where he had enough pass attempts to qualify for the passing title (14 attempts per team game). ANY/A, of course, is calculated as follows: (Passing Yards + PassTDs * 20 – INTs * 45 – Sack Yards Lost) / (Pass Attempts + Sacks).
  • Step 2) For each quarterback, award him 10 points if he led the league in ANY/A, 9 points if he finished 2nd, 8 points if he finished 3rd, … and 1 point if he finished 10th. A quarterback receives 0 points if he does not finish in the top 10 in ANY/A or does not have enough pass attempts to qualify.
  • Step 3) For each quarterback, add his “points” from each season to produce a career grade.

I decided to update that post (written in 2014) and make a few changes.

1) I have included the results from the last four seasons.

2) I included sack data from 1960 to 1968, using estimated individual sack data based on team sack data.

3) I have lumped together the AAFC/AFL with the NFL in each season as if it was all one big league.

4) I have pro-rated the values based on the number of qualifying passers in each season. So let’s say a player ranks 4th in ANY/A in 2017, where there were 32 qualifying passers. He gets the average of 7 points and 7 points * 32 divided by 32, which is of course just 7 points. Now, let’s say a player ranks 4th in ANY/A in a 10-team league. He gets the average of 7 points and 7 points * 10/32 (2.18), which is 4.6 points. This is not a special formula, but a “good enough” metric that helps discredit players in smaller leagues, but not overly so (hence the average idea).

Okay, enough words. Here are the results. I have also included the raw totals, so you can see what happens if I didn’t pro-rate the values. Finally, I subjectively included some HOF labels at the end: actually in the HOF (not very subjective), Future HOFer, Borderline, and then either Not Eligible or a No for the HOF.

RkPlayerFirst YrLast YrRaw ScorePro ScoreHOF
1Peyton Manning19982015109110.8Fut HOF
2Dan Marino198319999690.9HOF
3Joe Montana197919948277.5HOF
4Tom Brady200020177777.3Fut HOF
5Drew Brees200120177676.7Fut HOF
6Brett Favre199120106867.2HOF
7Johnny Unitas195619738766.2HOF
8Dan Fouts197319876863.9HOF
9Y.A. Tittle194819648963.6HOF
10Steve Young198519996461.6HOF
11Fran Tarkenton196119787160.2HOF
12Norm Van Brocklin194919608155.8HOF
13Aaron Rodgers200520175353.6Fut HOF
14Otto Graham194619557853.4HOF
15Sammy Baugh193719528751.6HOF
16Roger Staubach196919795548.3HOF
17Philip Rivers200420174747.4Border
18Ben Roethlisberger200420174545.5Fut HOF
19Bobby Layne194819626242.6HOF
20Bart Starr195619715242.1HOF
21Ken Anderson197119864640.5Border
22Kurt Warner199820093939.5HOF
23Tony Romo200620163939.5Border
24Terry Bradshaw197019834238.7HOF
25Sonny Jurgensen195719744538.4HOF
26Charlie Conerly194819615738.2No
27Trent Green199720083737.5No
28Troy Aikman198920003937.0HOF
29Boomer Esiason198419973936.5No
30Len Dawson195719754033.5HOF
31John Hadl196219773932.5No
32John Elway198319983230.8HOF
33Tommy Thompson194019504629.7No
34Warren Moon198420003128.9HOF
35Milt Plum195719693728.2No
36John Brodie195719733328.1No
37Carson Palmer200420172727.6Not El.
38Billy Kilmer196119783327.5No
39Daryle Lamonica196319743227.4No
40Sid Luckman193919504326.2HOF
41Jim Hart196619843025.9No
42Matt Ryan200820172625.7Border
43.5Bob Griese196719802924.8HOF
43.5Joe Namath196519772924.8HOF
45Jim Kelly198619962624.5HOF
46Ken Stabler197019842723.5HOF
47Vinny Testaverde198720072423.4No
48Roman Gabriel196219772823.3No
49Bob Waterfield194519523623.2HOF
50Craig Morton196519822622.6No
51Daunte Culpepper200020092222.3No
52Rich Gannon198720042222.1No
53Jeff Garcia199920082222.0No
54Dave Krieg198019982321.4No
55Frankie Albert194619523121.2No
56Bert Jones197319822421.1No
57Brad Johnson199420082020.3No
58Tobin Rote195019662920.3No
59Earl Morrall195619762520.2No
60Mark Brunell199420112020.1No
61Mark Rypien198820012120.0No
62Billy Wade195419662820.0No
63Don Meredith196019682419.9No
64Jim Everett198619972119.6No
65Matt Hasselbeck199920151818.3Not El.
66Matt Schaub200420161818.0Not El.
67Chad Pennington200020101818.0No
68Steve McNair199520071817.9Border
69Brian Sipe197419831917.8No
70Bernie Kosar198519961917.7No
71Russell Wilson201220171717.6Border
72Donovan McNabb199920111717.1Border
73Joe Theismann197419851816.9No
74Chris Chandler198820041716.7No
75George Blanda194919752116.4HOF
76Bobby Thomason194919572416.3No
77Norm Snead196119761916.2No
78Joe Ferguson197319901816.1No
79Bill Kenney198019881715.9No
80Jeff George199020011515.3No
81Bill Nelsen196319721815.3No
82George Ratterman194719562215.2No
83Jake Plummer199720061515.1No
84Phil Simms197919931615.0No
85Parker Hall193919462614.3No
86Neil Lomax198119881514.0No
87.5Tom Flores196019691713.9No
87.5Ed Brown195419652113.9No
89Babe Parilli195219691713.6No
90Bobby Hebert198519961513.5No
91Scott Mitchell199220011413.4No
92Vince Ferragamo197719861413.3No
93Charley Johnson196119751512.8No
94Danny White197619881312.3No
95Lynn Dickey197119851312.2No
96Greg Landry196819841411.9No
97Ron Jaworski197419891211.6No
98Frank Ryan195819701411.5No
99Johnny Lujack194819511711.4No
100Cecil Isbell193819422011.3No
101Archie Manning197119841211.2No
102Steve Grogan197519901211.2No
103Nick Foles201220171010.8Not El.
104Randall Cunningham198520011110.6Border
105Steve Bartkowski197519861110.5No
106Steve DeBerg197819981110.3No
107Chris Miller198719991110.3No
108Tony Eason198319901110.2No
109Jared Goff201620171010.0Not El.
110Kirk Cousins20122017109.9Not El.
111Erik Kramer19871999109.7No
112James Harris19691979119.4No
113Doug Williams19781989109.4No
114Jim Zorn19761987109.4No
115Davey O'Brien19391940179.3No
116.5Andy Dalton2011201799.3Not El.
116.5Brian Griese1998200899.3No
118Tommy Kramer19771990109.2No
119David Garrard2002201099.1No
120Eli Manning2004201799.1Border
121Eddie LeBaron19521963138.9No
122Michael Vick2001201598.9Not El.
123Jim Finks19491955138.8No
124Josh McCown2002201788.6Not El.
125Paul Christman19451950148.6No
126Rudy Bukich19531968108.4No
127Jay Schroeder1985199498.4No
128Greg Cook19691973108.3No
129Matthew Stafford2009201788.1Not El.
130Pat Haden1976198198.0No
132.5Alex Smith2005201788.0Not El.
132.5Robert Griffin2012201688.0Not El.
132.5Kerry Collins1995201188.0No
132.5Doug Flutie1986200588.0No
135Paul Governali19461948127.9No
136Frank Filchock19381950137.9No
137Dak Prescott2016201787.8Not El.
139Craig Erickson1992199787.6No
139Ken O'Brien1984199387.6No
139Frankie Sinkwich19431947137.6No
141Neil O'Donnell1991200387.5No
142Steve Beuerlein1988200377.2No
143Cam Newton2011201777.2Border
144Andrew Luck2012201677.1Not El.
145Gus Frerotte1994200877.0No
146Damon Huard1998200877.0No
147Jeff Hostetler1988199776.8No
148Jim Harbaugh1987200076.8No
149Jim McMahon1982199676.6No
150Wade Wilson1981199876.6No

The future HOFers rank 1-4-5-13-18 by this litmus test: there’s not much to debate there.

Among the actual HOFers, only George Blanda — who is probably the least qualified quarterback of the “modern” era to make the HOF — ranks outside of the top 50. Bob Waterfield and Ken Stabler are the next lowest quarterbacks, and that’s consistent with how I’d view them. As a litmus test, this does a decent job for being a (somewhat) quick and dirty way to measure HOF play.

Among the Not Eligible guys, only Carson Palmer is in the top 60. He ranks 37th, on the back of a #1 season in 2015 with the Cardinals (+10.3 points, since there were 34 qualifying passers that year), a #3 season with the Bengals in 2005 (+8.25, also 34), and a 6th and 7th rankings in ’06 and ’14 (+5, +4.06). That’s not really a HOF career by any stretch, but it’s a memorable career.

Among the pure no guys — those who have been passed over and didn’t receive my subjective borderline label — you have Charlie Conerly at 26, Trent Green at 27, Boomer Esiason at 29, John Hadl at 31, Tommy Thompson at 33, and Milt Plum at 35. All good quarterbacks, occasionally great ones, who are HOVG (at worst) type players.

And then we get to the borderline guys. I gave 10 players that label, including three guys who entered the league in the last ten years and who are probably too young to really evaluate. Among the other 7…

Philip RiversKen Anderson, and Tony Romo all are in the top 25, and make sense to be discussed together. None of the three won a Super Bowl, all three had fantastic efficiency numbers, and all three are more favored by the analytics crowd than the non-analytics crowd. Statistically, based on regular season efficiency, all three are clear HOF players. But, of course, that’s not the HOF test.

Steve McNair, Donovan McNabb, and Randall Cunningham are all borderline guys, too, and are underrated by an analysis like this that ignores rushing. They rank 68th, 72nd, and 104th. McNair (2003) and Cunningham (1998) each have a first place finish in ANY/A, while McNabb has a 2nd (2006) and 3rd (2004) place spot. McNair also has a 5th (2001) and a 9th (1999), while Cunningham has a 10th (1990), but that’s it, and that’s the problem. McNabb and McNair each have three finishes at 11 or 12 (worth zero) and McNabb has three more at 13/14; this analysis ignores solid seasons and rushing, which is going to hurt these guys a lot.

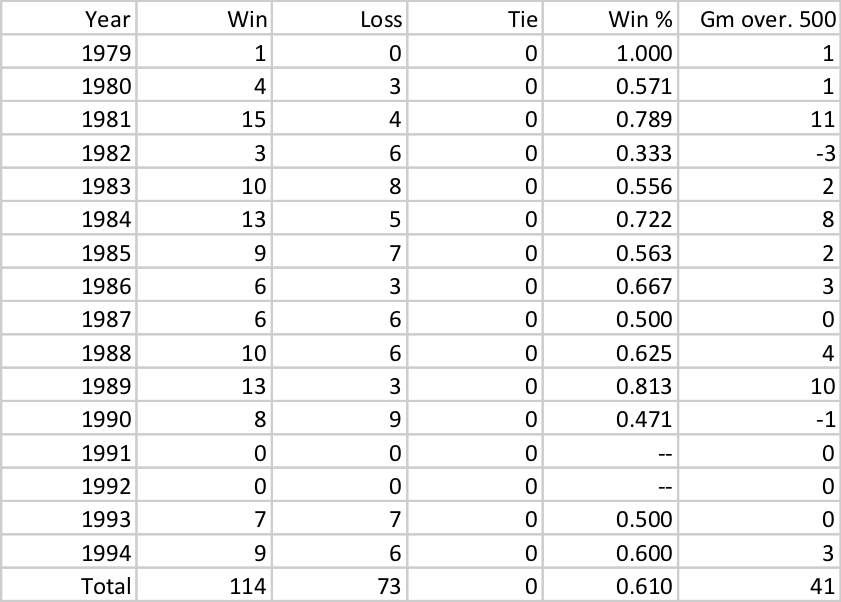
And then, of course, we get to Eli Manning. He was the inspiration for this post three years ago, and not much has changed since.  Manning has a a 5th-place finish from 2011 (+6.1), and three 10th place finishes (2009, 2012, and 2015, each worth 1 point).  He also has a 12th (2014) and a 13th (2010) place finish, but those are his only other top-15 seasons.  Manning performs horribly in the ANY/A Gray Ink test for HOFers.  He’s far behind Blanda, let alone the Stabler/Waterfield floor of quarterbacks.

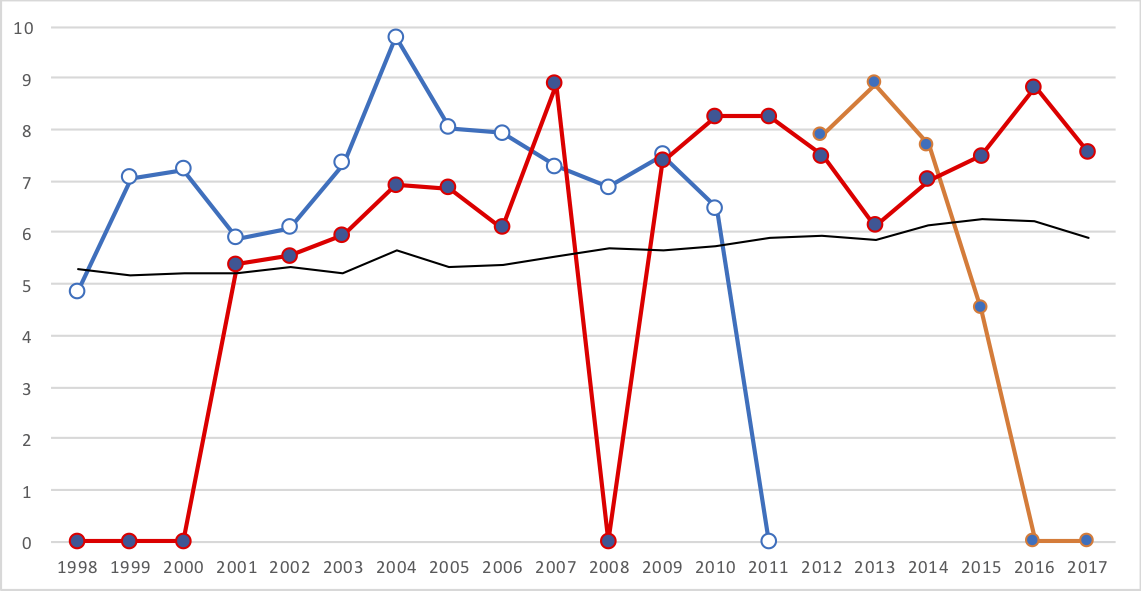
The graph below shows the data data but with color-coded labels: black for HOF or future HOFer,red for not in, orange for not eligible, and large green dots for the borderline guys.  The running quarterbacks (McNair, McNabb, Cunningham, and Newton) are at the back of the pack with Manning (the second farthest dot to the right); the three “stats stars” are to the left, and then you have Ryan who currently ranks just outside of the top 40 (the X-Axis is rank; the Y-Axis is prorated value).

What do you guys think?

{ 1 comment }

Brad Oremland is a longtime commenter and a fellow football historian. Brad is also a senior NFL writer at Sports Central. There are few who have given as much thought to the history of quarterbacks and quarterback ranking systems as Brad has over the years. What follows is Brad’s latest work on quarterback statistical production.


This is the penultimate article in a seven-part series. It is a supplement to my series on the greatest quarterbacks of all time, last year’s article on the top-ranked QBs in Total Statistical Production, and last month’s post about QB-TSP in the 2017 season and another way of using TSP. Over the last five weeks, I’ve written about the top 100 quarterbacks of the Modern Era, as ranked by TSP:

81-100
61-80
41-60
21-40
1-20

This article presents a different way of evaluating quarterbacks. It is data-heavy, so if you’re just here for my prose, I’m sorry to disappoint. The chart below shows those same 100 QBs, along with each player’s: Adjusted TSP, Career Value, Seasons among the top 10 in QB-TSP, Top-10-Points, Year-Points, 500-TSP seasons, 1,000-TSP seasons, 1,500-TSP seasons, 2,000-TSP seasons, 2,250-TSP seasons, 2,500-TSP seasons, Pro Bowls, All-Pro honors ((From 1970-present, I used the Associated Press All-Pro Team. I counted First-Team selections as 3 points and Second-Team selections as 1 point. A First-Team selection by one or more other major organizations, for a player not named First-Team by AP, counts as +1, and an MVP selection by any major organization was worth +1.

For instance, in 2016, Tom Brady was named Second-Team All-Pro by AP (1 pt), but First-Team by the Sporting News, so he scored 2 pts that season. The score of AP First-Team All-Pro Matt Ryan was unaffected, remaining 4 points (including his MVP selection). In 1993, the AP All-Pros were Steve Young and John Elway, but the Sporting News chose Troy Aikman. Young scored 3, and Aikman and Elway 1 each. In 1990, Joe Montana scored 4 points, with Randall Cunningham and Warren Moon earning 2 each. [continue reading…]

{ 1 comment }

A couple of months ago, I asked this question on Twitter:

Do you know the answer? I’ll give you a couple of moments to think about it. First, a graph showing the 200 players with the most pass attempts in NFL history (all have at least 1,325 attempts). On the X-Axis is completion percentage; on the Y-Axis is Yards per Completion. There are no era adjustments here, which can also make it kind of fun: over time, completion percentages have skyrocketed, while the average yardage gained per completion has decreased. As a result, a player with a very high yards per completion percentage almost certainly played long ago, and therefore has a low completion percentage (and vice versa). Take a look: [continue reading…]

{ 1 comment }

Championship Leverage, By Bryan Frye

Today’s post is a re-post from friend of the program Bryan Frye’s site, which is being republished with his permission and encouragement. As regular readers know, Bryan operates his own fantastic site, http://www.thegridfe.com. You can view all of Bryan’s guest posts here, and follow him on twitter @LaverneusDingle. What follows are Bryan’s words, with minor editing from Chase.


Over the years, I’ve given much thought to the value (Championship Leverage) of postseason games relative to regular season games. Sabermetrics guru Tom Tango invented the Leverage Index in 2008 to apply a value to the gravity of a given base-out-inning situation in baseball. Later, Neil Paine used the concept for basketball and, subsequently, football. I found his application of the concept to NFL quarterbacks to be particularly interesting, and I decided to go into more detail on Neil’s methodology and expand the findings back to 1936 (the first NFL season with a standardized schedule). [continue reading…]

{ 0 comments }

Yesterday, we looked at quarterback records against the spread.  In that post, I noted that Tom Brady and the Patriots have been favorites in a remarkable 52 consecutive games, which would nearly be an NFL record if Brady hadn’t missed any games. For his career, the Patriots have been favored in 232 games that Brady has started, been an underdog 52 times, and the line has been a Pick’em in 4 games.

The table below shows the number of games that each quarterback’s team has been a favorite, underdog, or pick’em since 1978. For quarterbacks who started games before 1978, like Terry Bradshaw, I have played ** next to their name to indicate that this data does not cover their whole career.  Post-1978 Bradshaw, however, has the highest percentage of games as a favorite, followed by Steve Young and then Brady. [continue reading…]

{ 0 comments }

Joe Montana and Records Against The Spread

Joe Montana’s teams were really good at winning football games, going 117-47 and 16-7 in games started by the Hall of Fame quarterback. Montana’s teams had a 0.711 overall winning percentage, which is great; but what’s even more remarkable is how well his teams did against the points spread.

On average, Montana’s teams were favored by 4.5 points. And given the nature of how points spreads work, you would expect most teams to win about half of their games against the spread. But Montana’s teams went 114-73 against the spread, a remarkable winning percentage of 0.610. Much of the success was due to the 49ers of 1981 (15-4 ATS), 1984 (13-5), and 1989 (13-3). The ’81 team was one of the most surprising Super Bowl champions of all time; San Francisco was favored in just 9 of 19 games that year, with three of those spreads being just 1-point lines. And the ’84 and ’89 teams were two of the greatest teams of all time, so it’s not surprising that they had great ATS records, too. The table below show’s the record against the spread for each of Montana’s teams in each season of his career:

Also really good against the spread, of course, is Tom Brady and the Patriots. The ’01, ’03, and ’04 Patriots were all Super Bowl champions that were remarkable against the spread, combining to go 41-11-3 relative to the Vegas odds. The Patriots remained solid but unspectacular against the spread since then, although the ’16 team went 13-2 with Brady under center.

What makes the Brady stuff all the more remarkable: the last 52 times the Patriots have taken the field with Brady under center, the Patriots have been favored. And you have to go back 60 games, November 2014 game against the Packers, where New England has been underdogs with Brady under center. More on that tomorrow. [continue reading…]

{ 0 comments }

Brad Oremland is a longtime commenter and a fellow football historian. Brad is also a senior NFL writer at Sports Central. There are few who have given as much thought to the history of quarterbacks and quarterback ranking systems as Brad has over the years. What follows is Brad’s latest work on quarterback statistical production.


Brees threw a lot in garbage time

What I thought was an off-hand musing about Drew Brees’ production in low-leverage situations (for my ongoing series about the greatest statistical QBs in history) sparked a surprisingly contentious debate about whether Brees had padded his stats in garbage time.

I tried to align this with a very conservative definition of “garbage time” … all data are from 2004-17 — 2004 was Brees’ first good season — and none of the game/score situations below produced any wins by any team during those years. “P/B/R” indicates the combined total of Peyton Manning, Tom Brady, and Aaron Rodgers.

Please pardon the informal prose and formatting; this was originally composed as a comment, not an article. [continue reading…]

{ 1 comment }

Brady vs. Manning, Yearly ANY/A

Yesterday, Brad Oremland’s great series on his top-ranked QBs in Total Statistical Production concluded. You should give that a read today, especially if you missed it because of the holiday.One thing that Brad wrote about in the Manning section was how Manning was nearly always better than Brady during the ’00s. It’s easy to forget about that now — Brady has been the much better QB for each of the last three years, and for most years in the ’10s. But during the ’00s, the only year that Brady was clearly better was ’07.I decided to make a graph of the Adjusted Net Yards per Attempt for Tom Brady (in red with blue dots) and Peyton Manning (in blue with white dots for his Colts years, and orange with blue dots for his Broncos years) for each of the last 20 seasons. Brady missed all or nearly all of the ’98 (college), ’99 (college), ’00 (backup), and ’07 (injury) seasons, while Manning missed all of the ’11 (injury), ’16 (retired), and ’17 (retired) seasons. They each get a zero for those seasons, even tho Brady threw 14 passes combined in those years. The thin black line represents league average ANY/A each season.You can break this down into a few categories. [continue reading…]

{ 0 comments }

Top 100 QBs: 20-1, By Brad Oremland

Brad Oremland is a longtime commenter and a fellow football historian. Brad is also a senior NFL writer at Sports Central. There are few who have given as much thought to the history of quarterbacks and quarterback ranking systems as Brad has over the years. What follows is Brad’s latest work on quarterback statistical production.


This is part five of a seven-part series. It is a supplement to my 2015 series on the greatest quarterbacks of all time, last year’s article on the top-ranked QBs in Total Statistical Production, and a recent post about QB-TSP in the 2017 season and another way of using TSP. I strongly encourage you to read those pieces if you haven’t done so already. You may also be interested in the previous entries of this series.

Best Statistical QBs: 81-100
Best Statistical QBs: 61-80
Best Statistical QBs: 41-60
Best Statistical QBs: 21-40

In this series, I present the top 100 pro football quarterbacks as ranked by QB-TSP. This is a purely statistical ranking, with all the drawbacks that entails, and in many places it is not reflective of my subjective evaluations. This week, we examine the top 20 quarterbacks of the Modern Era.

Questions and comments are encouraged, but please understand that this series is a product of extensive research and analysis, not whim or guess or hot take, and it was produced with no agenda except to inform and explain. Thanks for reading. [continue reading…]

{ 0 comments }

Checkdowns: Trivia On 100 Yard Rushing Games

Let’s start with some trivia.

Which running back has the most 100-yard rushing games in his career?

Click 'Show' For the Answer Show

There have been 11 running backs who have rushed for 100+ yards in a winning effort in 40 or more regular season games. Ten of them are in the Hall of Fame, but the man who has done it 51 times — the third most ever — is not (and is eligible). Name him.

Click 'Show' For the Answer Show

Which running back has the best winning percentage in games when he rushed for 100+ yards, minimum 15 games?

Click 'Show' For the Answer Show

Which running back has the best winning percentage in games when he rushed for 100+ yards, minimum 30 games?

Click 'Show' For the Answer Show

Here’s a record that I am confident will not be broken in the next 20 years, and might not ever be broken at all. One running back rushed for 100+ yards in a game that his team lost 32 times in his career. No other player has done it more than 23 times. To get a sense of comparison, Adrian Peterson and Steven Jackson have done it 31 times, combined.  Name him.

Click 'Show' For the Answer Show
[continue reading…]

{ 0 comments }

Frank Gore’s Career Has Been Almost All Prime

Frank Gore has had a remarkable career. He’s averaged at least 60 rushing yards per game in 12 different seasons, second only to Emmitt Smith. But it’s also been somewhat remarkable in how unremarkable each season has been: Gore averaged a nondescript 43.4 rushing yards per game as a rookie and then an eye-popping 105.9 rushing yards per game in his second season; since then, for 11 straight years, Gore has averaged between 60 and 80 rushing yards per game. No other player has more than 7 such seasons in their career, let alone consecutive, with Warrick Dunn, Franco Harris, and Ricky Watters tied for second place on the list.

So far, Gore has rushed for 14,026 rushing yards in his career.  But I wanted to try to identify similar — and dissimilar — rushers to Gore.  So here’s what I did: for each running back, I identified his rushing yards in each season of his career.  For seasons where the league had fewer than 16 team games per season, I pro-rated that player’s production as if the league had 16 games.  So players in a 14-game season get their rushing yards bumped by 14.3%, regardless of how many games they played.  Then, I gave a player 100% credit for their best rushing season, 90% credit for their second best rushing season, 80% credit for their third best rushing season, and so on.  Doing this gives Gore just 6,824 rushing yards, just under half of his actual total.

[continue reading…]

{ 0 comments }

The 2017 Eagles won the Super Bowl, but the 2016 Eagles were just 7-9. That is pretty misleading: the 2016 Eagles had the best DVOA of any team in the last 30 years with a losing record, so in some ways, the ’17 season wasn’t a big surprise.

On the other hand, well, the Eagles became just the 4th team to go from a losing record to Super Bowl champion in one season. The other three teams were much worse in the prior year than the 2017 Eagles, but you can probably guess them: the 2001 Patriots, 1999 Rams, and 1981 49ers.

On average, Super Bowl champions win 12.7 games the year they win the Super Bowl (with non-16 game seasons pro-rated to 16 games), 10.9 games the year before, 9.7 the year before that, 9.5 three years before, and 9.2 four years before. The table below shows the number of wins in Year N (the Super Bowl year) for each Super Bowl champion, along with their number of wins in the prior four years. The final column shows the average of wins in Years N-1, N-2, N-3, and N-4. Note that all non-16 game seasons have been pro-rated. [continue reading…]

{ 2 comments }

Simeon Rice was one of the best pass rushers of his generation. He led all players in sacks from 1996 to 2005, and also from 1999 to 2002. During those four seasons, Rice played on defenses that faced just 2,098 pass plays: every team other than the Bills (2,078 pass plays) faced more pass plays during those years.

In fact, in his average season — weighted for the number of sacks Rice recorded — his defenses faced just 32.78 pass attempts (including sacks) per game. The reason I weight for number of sacks is that if Rice played on defenses that faced 600 pass attempts during his big sack years, and 400 pass attempts during his low sack years, that’s not the same as facing 500 pass attempts every year. A player’s reputation is built off of his big sack years, which generally coincide with his prime; as a result, those years should received more weight. If a 37-year-old Rice played on a team that faced 700 pass attempts and Rice barely played, it wouldn’t make sense to count that equally with a year in his prime.

The table below shows every season of Rice’s career. By way of example, as a rookie, he played for Arizona and recorded 12.5 sacks, which is 10.25% of his career total. His Cardinals faced 548 pass plays (including sacks), or 34.25 per game that season, so when calculating his career grade, 10.25% of it will come from the 34.25 number. The “Prod” column is the product of the “Perc” column and the “TPA/G” column. The far right column shows the average NFL sack rate that season, which is shown only for reference. [continue reading…]

{ 1 comment }

2017 Game Scripts: Results from all 534 games

There are 256 regular season games each year, plus 11 postseason games, for a total of 267 NFL games per season. This means there are 534 team games each year, which means 534 different Game Scripts and 534 different pass ratios. Here’s a graph of all pass ratios (on the Y-Axis) from 2017, marked against Game Scripts (on the X-Axis).  As you can see, as a team’s Game Script improves, its pass ratio tends to decrease.

[continue reading…]

{ 3 comments }

In 2001, Michael Strahan had 22.5 sacks, the most in a single season since 1982.

In 1987, Reggie White had 21 sacks in just 12 games, the highest per-game average since 1982.

In 1986, Lawrence Taylor won the AP MVP award and had 20.5 sacks.

Those three seasons were all great sack seasons, but I’d argue that DeMarcus Ware in 2008 – when he had 20.0 sacks – was the best sack season of the bunch.

Let’s start by looking at the NFL average sack rates (defined as sacks divided by sacks plus pass attempts) in each season since 1982, when the NFL began tracking sacks for individual defensive players. I have colored in red the ’86, ’87, ’01, and ’08 seasons. [continue reading…]

{ 1 comment }

Top 100 QBs: 21-40, By Brad Oremland

Brad Oremland is a longtime commenter and a fellow football historian. Brad is also a senior NFL writer at Sports Central. There are few who have given as much thought to the history of quarterbacks and quarterback ranking systems as Brad has over the years. What follows is Brad’s latest work on quarterback statistical production.


This is part four of a five-part series. It is a supplement to my 2015 series on the greatest quarterbacks of all time, last year’s article on the top-ranked QBs in Total Statistical Production, and last month’s post about QB-TSP in the 2017 season and another way of using TSP. I strongly encourage you to read those pieces if you haven’t done so already. You may also be interested in parts one, two, and three of this series.

In this series, I present the top 100 pro football quarterbacks as ranked by QB-TSP. This is a purely statistical ranking, with all the drawbacks that entails, and in many places it is not reflective of my subjective evaluations. Each week, we’ll examine 20 players, continuing this week with ranks 21-40. [continue reading…]

{ 0 comments }

Yesterday, I looked at the 34 quarterbacks to throw 1,000 passes from 2011 to 2017. In that group, there were four quarterbacks who stood out with low interception rates and high sack rates. All four are black, which is pretty unlikely to happen by random chance given that there were just six black quarterbacks in the study.

But that was a small sample. Today, we expand the group to look at all quarterbacks with at least 1,000 career pass attempts who were active in 2002 or later. For each quarterback, I looked at their INT% and sack% in each season, and measured those rates relative to league average. I have plotted the career grades on the graph below.

On the X-Axis is interception rate relative to league average; it spans from -1.5% (which means 1.5% worse than league average: i.e., really bad) to +1.5% (really good). Tom Brady and Aaron Rodgers are the two at just over +1.0%, while Tommy Maddox is at the far left at -1.26% (he has the worst era-adjusted interception rate since the merger). On the Y-Axis is sack rate relative to league average: at the very bottom, of course, is David Carr, at -4.7%; at the very top are Peyton Manning (+3.3%) and … old Bears QB Jim Miller (+3.0%). [1]Miller played from ’95 to ’02, so he just makes it into the study. To be clear, if a player was active in ’02, his entire career was included, which is just another reason why we … Continue reading

So for purposes of this chart, you want to be up and to the right, which indicates better than average sack rates and better than average interception rates. There are 22 black quarterbacks who threw 1,000 passes. I have plotted them in red, while all other data points are in blue. Take a look: [continue reading…]

References

References
1 Miller played from ’95 to ’02, so he just makes it into the study. To be clear, if a player was active in ’02, his entire career was included, which is just another reason why we need to era-adjust the data. Also, yeah, Miller was really good at avoiding sacks.
{ 0 comments }

In December 2010, Jason Lisk wrote an interesting piece about whether race still matters when it comes to quarterback play in the NFL. That article has stuck with me over the years — I referenced it last year in a piece questioning whether Colin Kaepernick’s political stance impacted his style of play in 2016 — and the key excerpt is below:

Still, one of the things I have observed is that black quarterbacks, as a group, have tended to be better at avoiding interceptions than their white counterparts. …

Interceptions are highly random, subject to game situation, dependent on deflections, tips, the receiver running the correct route, the defender making a good play and not dropping the ball. They can also be somewhat controlled by the quarterback’s behavior. If you try to fit the ball into tight windows, your chances for both a good play and a bad one increase. There is also no other quarterback action that gets criticized as “stupid” or “dumb” like an interception thrown. I can see how black quarterbacks feel they need to be more cautious when it comes to interceptions, to avoid that criticism. I suspect that the difference in interception numbers is a real effect driven by this external pressure.

So, I think that race matters, because the numbers – as well as direct statements from McNabb and Doug Williams as quoted in Hill’s piece – tell me it matters in affecting how the black quarterbacks play the game as far as avoiding interceptions.

[continue reading…]

{ 1 comment }

Clearly a rushing quarterback

How do you identify who is a rushing quarterback? On the surface, rushing yards per game seems like a pretty simple and easy way to do it.  Michael Vick is the career leader in rushing yards per game by a quarterback, at 42.7. [1]Although Spec Sanders would be number one if you were inclined to label him a quarterback. Robert Griffin (39.8), Cam Newton (39.6), Russell Wilson (34.1), and Colin Kaepernick (33.3) are the next five quarterbacks on the career rushing yards/game list after Vick. [2]Bob Hoernschemeyer, Tuffy Leemans, and Charley Trippi also all averaged more than 25 passing yards per game and at least 35 rushing yards per game.

That seems to work pretty well, I suppose. But what about Bobby Douglass? He averaged 40.5 rushing yards per game with the Bears in 61 games but only 45 starts; he played in 30 more games the rest of his career that torpedoed his career average to 29.2. Or Greg Landry, who averaged 24.5 rushing yards per game with the Lions, but whose career averaged is only 18.5 because of time spent as a backup.

And here’s the really tricky part. Today’s quarterbacks pass more than ever. If a quarterback runs 6 times and passes 34 times in 2018, does that make him less run-happy than a quarterback who ran 6 times and passed 24 times in 1981? I think it might: the 1981 QB ran on 20% of plays, while the 2018 QB will run on 15% of his plays. But it is not necessarily intuitive (or correct) to identify rushing quarterbacks by how much they rush for relative to their passing.

So that’s what I did today: I calculated both the rushing yards per game and the rushing yards per pass attempt career averages for all quarterbacks with at least 1,000 pass attempts.  Here’s how to read the table below (which shows the top 100 rushing quarterbacks by this metric), using Bobby Douglass as an example. Douglass rushed 410 times in his career for 2,654 yards, a 6.47 YPC average. He played in 91 games, meaning he averaged 29.2 yards per game. He threw only 1,178 passes, however; as a result, Douglass averaged an incredible 2.25 rushing yards for every pass attempt in his career. That’s the best in NFL history, and Vick is the only one who is even close. [continue reading…]

References

References
1 Although Spec Sanders would be number one if you were inclined to label him a quarterback.
2 Bob Hoernschemeyer, Tuffy Leemans, and Charley Trippi also all averaged more than 25 passing yards per game and at least 35 rushing yards per game.
{ 0 comments }

You probably don’t think too much about Vince Young these days. The former Texas Longhorn star and Tennessee Titans disappointment last played in an NFL game back in 2011. But when I ran some queries recently, Young shocked me in a couple of stats. Let’s start with one you probably didn’t expect.

Young had a really good sack rate, particularly in 2009. But what makes Young’s sack rate really impressive is his sack rate relative to his rushing ability. In 2009, Young rushed 55 times and was sacked just 9 times. Among players with at least 200 pass attempts in a season, Young 2009 is the only instance where a player had at least 6 times as many rushing attempts as sacks; even if you drop the ratio to 5 times, only two other seasons are included.

And because Young had an insanely low average sack yards that year — he averaged just four yards lost per sack — he set another “record” that year. Young rushed 55 times and lost 36 yards on sacks; no other player has ever had more rushing attempts than sack yards lost, much less than 1.5:1 ratio that Young had that would hold up until you drop the pass attempt minimum below 120.

For his career, the numbers are similar, though obviously less extreme. Young had 282 career rushing attempts and just 83 sacks; that ratio of 3.40 rush attempts per sack is the highest among all players since 1970 (among the top 200 leaders in pass attempts). If you look at rushing yards compared to sacks, Young was at 17.58-to-1, second only to Michael Vick, who was helped by a remarkable 7.0 yards per carry average that nobody can match.

The table below shows this data for the 200 quarterbacks with the most attempts since 1970. When it comes to being a rushing quarterback and avoiding sacks, nobody can beat Vince Young: [continue reading…]

{ 0 comments }

2017 Playoff Game Scripts

Today we are going to look at the Game Scripts from the 11 games in the 2017 playoffs. There were two big blowouts in the postseason: the Eagles over the Vikings in the NFCCG and the Patriots over the Titans in the division round. Both teams won by over 20 points and had Game Scripts of over +10. But there were two other games that were very close but with blowout Game Scripts: in other words, two games that almost saw miraculous comebacks.

The Jaguars beat the Steelers with a Game Script of +10.6. Jacksonville led 21-0 early in the 2nd quarter and 28-7 late in the first half. But Pittsburgh scored 5 touchdowns on the team’s final 7 drives of the game, ultimately falling 45-42.

The Vikings led the Saints 17-0 just 20 minutes into the division round game, and that score held with just 17 minutes left in the game. From there, New Orleans staged a furious comeback, scoring 24 points in 16-minute stretch to take a 24-23 lead. This was one of the most miraculous comebacks in playoff history, but it was upstaged by an even more miraculous comeback by the Vikings just seconds later.

The full Game Scripts data from the playoffs, below: [continue reading…]

{ 0 comments }

Weeks 16 and 17 Game Scripts (2017): Finally!

The end of 2017 was a pretty busy time for me, so I stopped the game scripts data after week 15. Under the philosophy of late than never… [continue reading…]

{ 0 comments }

Top 100 QBs: 41-60, By Brad Oremland

Brad Oremland is a longtime commenter and a fellow football historian. Brad is also a senior NFL writer at Sports Central. There are few who have given as much thought to the history of quarterbacks and quarterback ranking systems as Brad has over the years. What follows is Brad’s latest work on quarterback statistical production.


This is part three of a seven-part series. It is a supplement to my 2015 series on the greatest quarterbacks of all time, last year’s article on the top-ranked QBs in Total Statistical Production, and last month’s post about QB-TSP in the 2017 season and another way of using TSP. I strongly encourage you to read those pieces if you haven’t done so already. You may also be interested in parts one and two of this series.

In this series, I present the top 100 pro football quarterbacks as ranked by QB-TSP. This is a purely statistical ranking, with all the drawbacks that entails, and in many places it is not reflective of my subjective evaluations. Each week, we’ll examine 20 players, continuing this week with ranks 41-60. [continue reading…]

{ 0 comments }

Surplus Yards And QB Seasons, By Adam Steele

Adam Steele is back for another guest post. You can view all of Adam’s posts here. As always, we thank him for contributing.


Earlier this month, I introduced a new stat called Surplus Yards and applied it to the 2017 season. If you haven’t read that post, consider that required background reading.

Since then, I calculated and archived every 40+ yard completion since 1994. The chart below shows the league average Surplus % for each of the last 24 seasons:

[continue reading…]

{ 0 comments }

Nobody questions how valuable Rob Gronkowski has been to the Patriots and to Tom Brady. The future Hall of Fame tight end is a dominant force when healthy, and Brady’s numbers with and without Gronk reflect that. With the PFR game play finder, we can easily look at Brady’s career numbers in the regular season on passes to Gronkowski and to everyone else.

[Note: I still am not a fan of using per-target statistics to judge wide receivers, but I find them an interesting — but certainly not definitive — part of the puzzle when looking at quarterback production. Also note: all statistics in this post are from the PFR game play finder, so they may differ slightly from official numbers.]

Here are a few stats to consider:

  • Gronk has seen 8.2% of Brady’s career targets, but is responsible for 10.7% of his career passing yards (+2.6%).
  • On passes to Gronk, Brady has averaged 9.95 yards per attempt; on passes to all other Patriots, Brady has averaged 7.36 yards per attempt, a whopping 2.59 yards/attempt lower.
  • Thought of another way, Gronkowski has elevated Brady’s yards per attempt by 0.21, as Brady has a career yards / attempt average of 7.57.

So yes, Gronk has been great.  [1]And note that using yards is not even the best way to show how valuable Gronk has been.  He’s responsible for 15.3% (!) of Brady’s career touchdowns.; But so has Jordy Nelson, who has been a critical part of the success that Aaron Rodgers has had in Green Bay.  Let’s look at those same numbers:

  • Nelson has seen 14.6% of Rodgers’ career passes, but he is responsible for 18.0% (+3.3%) of his career passing yards.
  • On passes to Nelson, Rodgers has averaged 9.81 yards per attempt; on passes to all other Packers, Rodgers has averaged 7.67 yards per attempt, 2.14 yards/attempt lower.
  • Nelson has elevated Rodgers’ career yards per attempt average by 0.31, as Rodgers has a career Y/A average of 7.98.

Gronkowski being +2.59 Y/A better than all other Patriots is a remarkable figure, and Nelson being at “just” +2.14 doesn’t quite compare.  But due to volume, Nelson has actually raised his quarterback’s career average by a much larger degree.

I used the PFR game play finder to look at the passing breakdown of Brady, Rodgers, and also Drew Brees and Peyton Manning. Some nuggets:

  • Marvin Harrison was responsible for 16.6% of Manning’s targets, the highest in the bunch. Brady is the only quarterback of the bunch who didn’t throw even 9% of his targets to one player; Rodgers, meanwhile, has seen four different receivers (Nelson, Randall Cobb, Greg Jennings, and James Jones) on the receiving end of at least 9% of his passes. This is in part because Rodgers has had a shorter career, and also the general lack of roster turnover in Green Bay.
  • More than any other quarterback, Brees has made a living off of secondary weapons. Kenny Stills (11.82 yards/target, 133 targets), Robert Meachem (10.74, 251), and Devery Henderson (10.27, 384) were the only three players to average over 10 yards per target on at least 100 targets.
  • Brees throws a ton to running backs, and they also kill his average. Among players for these four quarterbacks who were responsible for at least 2.5% of their quarterback’s targets, Brees has the three players with the lowest average gains: LaDainian Tomlinson, Reggie Bush, and Mark Ingram.
  • Nothing stands out immediately to me about Manning: as you would suspect, Reggie Wayne, Harrison, and Demaryius Thomas are the three who have helped him the most, but not to a particularly noteworthy degree. Harrison had the most targets, Wayne bumped his average up the most (+0.16), and Thomas had the best average gain (9.32).

[continue reading…]

References

References
1 And note that using yards is not even the best way to show how valuable Gronk has been.  He’s responsible for 15.3% (!) of Brady’s career touchdowns.
{ 1 comment }

Antonio Brown is one of the best players in the NFL, and is on his way to becoming a Hall of Fame wide receiver. Over his last 88 games, regular and post-season combined, he’s averaging over 100 yards per game. He’s been an AP first-team All-Pro selection for four straight seasons, and has led the NFL in receiving yards since he entered the league in 2010.

He also was the 195th pick in the draft, meaning he’ll likely become the 3rd player in the 195-199th draft slot range to make it to Canton. And just like Tom Brady and Terrell Davis, Brown’s success was unexpected and unique.

Don Hutson may have been the greatest receiver in league history and wasn’t drafted, but there’s a reason for that: Hutson entered the league in ’35, and — not coincidentally — the NFL didn’t institute the draft until the following season. There are only five other undrafted wide receivers to ever average at least 80 receiving yards per game over a three-year period, with a minimum of 30 games played. Charley Hennigan and Lionel Taylor did it in the early days of the AFL. George Sauer pulled off the same trick with the Jets, operating as the perfect possession receiver for Joe Namath (to the extent such a thing existed) and opposite the great Don Maynard. Later, Rod Smith did it with the Broncos, and of course Wes Welker got there with the Patriots.

Only one player drafted later than Brown has averaged 80 receiving yards per game over a three year stretch: Raymond Berry, the dominant possession receiver of his era, who teamed with Johnny Unitas.

Brown plays with Ben Roethlisberger, of course, and that obviously helps. But what makes Brown’s success noteworthy isn’t that he was a low draft pick and has averaged 80+ receiving yards per game, but that he was a low draft pick and averaged over 100+ receiving yards per game! [continue reading…]

{ 9 comments }

Passing from 1950 to 2017 (in graphic form)

Five years ago, I posted one of my favorite graphs, which shows how passing has changed in the NFL since 1950. A picture is worth at least 1,000 words in this case. I have updated the graph for the last few years of data and also to include first downs.

With one chart, you can see what has happened, on average, on each pass play (sacks plus pass attempts) for each season in pro football history. The graph below shows the number of interceptions per dropback (red), sacks per dropback (purple), non-INT incomplete passes per dropback (in yellow), non-first down completions per dropback (green), and then first downs on completed passes per dropback (blue). Of course, a dropback is simply a pass attempt or a sack. The information is stacked on top of each other for ease of viewing.

Pretty fun!

{ 0 comments }

Football Perspective Turns Six Years Old

The community make this site number one.

On June 15, 2012, Football Perspective was born. Since that day, Football Perspective has published at least one new article every single day. This is the site’s 2,363rd post: You can view every article ever written at FP here, and at the top of each page on this site is a link to the Historical Archive, which is also updated after each post is published.

At some point, The Streak will end, and that’s okay. You guys have already made this site way more successful than it ever should have been. It is never lost on me how lucky I am to have a community where people are willing to take time out of their busy lives to check Football Perspective. And in an era where civility is moving in inverse relationship to interception rate, it’s inspiring the way you conduct yourselves. The comments sections on the internet are known for being awful and trending downward, but you go out of your way to be civil to others and to provide thoughtful, intelligent, helpful, and meaningful responses. There really is a Football Perspective community, and it’s a very cool thing. Getting to know you, getting help from you, and just learning and enjoying football with you is an awesome experience.

It’s also important to pay it forward, and a few years ago, I chronicled my history as a football writer. I hope that article is inspiring to young and old writers across the football universe, or at least not too demoralizing. But if there’s one thing I’ve learned in my 16 years as a pro football writer, it’s that you are the sum of your connections. And nobody is more fortunate than me in that regard.

I have been influenced by some of the best people — and minds — in our football world: David Dodds and Joe Bryant at Footballguys.com, Sean Forman, Neil Paine, and Mike Kania at Sports-Reference.com, and the incomparable Doug Drinen at both sites. Without each of those six people actively and continuously supporting me, my life would be materially worse, and oh yeah this website wouldn’t exist.

Writers like Bob Henry, Sigmund Bloom, Matt Waldman, Maurile Tremblay, Jason Wood, and many others at Football Guys have been great friends and sounding boards over the years. Jason Lisk, Chris Brown, Scott Kacsmar, Sharon Katz, Mike Clay, and Stephanie Stradley have been really smart, thought-provoking individuals who have helped shape my thoughts, both inside and outside of football.

Brian Burke, Aaron Schatz, and Bill Barnwell all could have been competitors, but have instead gone out of their way to promote me and my little site. Bill in particular has been kind enough to use his large platform to frequently drive traffic to this site and has become a good friend in the process. I met him after starting this site. How neat is that?

I’ve been lucky to get to know a number of people who work in the NFL, and they are much kinder, smarter, and interesting than you would think. It’s fascinating to get a glimpse into what’s going on behind the curtain, and I thank all of them for that.

Without my guest writers, the Streak would have died long ago. A sincere thank you to Bryan Frye, who has always been willing to help and is a brilliant football mind. It’s incredible having people like Bryan, Brad Oremland, and Adam Harstad — three guys who know as much about football as anybody — constantly contributing to this site. There have been many great guest posts at Football Perspective over the years (yes, that link will let you see all of them), and I thank all of them for their hard work.

I’ve also been happy to see some of my former guest writers move on to bigger and better things, from working at larger sites to having success in other football industries to working in the league. What’s cooler than that?

Your contributions to Football Perspective is what makes this a website and not a diary. A special thanks to all of you. Every day, I consider myself lucky to be able to participate in a community where people willingly take time out of their busy lives to check this little site. But today, I consider myself just that much luckier.

{ 0 comments }

Are Interceptions More Or Less Damaging Now?

In the ’60s and ’70s, interceptions didn’t have nearly the negative stigma attached to them that they do now. Part of this was because interceptions were just an accepted part of the high variance strategy known as throwing the ball. Today, with offenses being more efficient, the opportunity cost of throwing an interception is greater. And, while I don’t have data to prove this claim, I am confident that interceptions on average happen closer to the line of scrimmage now than they used to, meaning the defense will be getting the ball in better field position. So it seems as though interceptions should be more highly correlated with losing than they used to be.

On the other hand, interceptions are pretty rare events now. Last year, a team threw zero interceptions in 46.3% of team games (counting each game as two individual games; one for the home team and one for the road team). That set a new record, breaking the old record of 45.7% set in… 2016. That broke the record of 44.0%, set back in… 2015. Okay, you get the point: teams are throwing fewer interceptions.

On the other hand, teams throwing zero interceptions won only 64% of games last season, which is the second-lowest mark (it was at 63% in 1994). By way of comparison, in 1981, teams threw zero interceptions in just 25.5% of games, but won 80% of those games. Of course, this is misleading in that it is not an apples-to-apples comparison. In 2017, when teams threw zero interceptions, their opponents averaged 0.92 interceptions per game, also the lowest mark ever. In 1981, teams that threw zero interceptions saw their opponents average 1.65 interceptions per game, so a zero interception game “should have” been more valuable back then because it meant you were winning the INT battle by +1.65 rather than just +0.92.

So perhaps we should look at net interceptions. Last year happened to be a pretty odd one. Teams that won the interception battle by exactly one interception won 65% of their games, which is pretty low. But over the ten prior years, teams that won the INT battle by 1 had a 72% winning percentage, up over the general historical average.

[continue reading…]

{ 1 comment }

Top 100 QBs: 61-80, By Brad Oremland

Brad Oremland is a longtime commenter and a fellow football historian. Brad is also a senior NFL writer at Sports Central. There are few who have given as much thought to the history of quarterbacks and quarterback ranking systems as Brad has over the years. What follows is Brad’s latest work on quarterback statistical production.


Top 100 QBs: 61-80

This is part two of a seven-part series. It is a supplement to my series on the greatest quarterbacks of all time, last year’s article on the top-ranked QBs in Total Statistical Production, and last month’s post about QB-TSP in the 2017 season and another way of using TSP. I strongly encourage you to read those pieces if you haven’t done so already. You might also be interested in part one of this series, published last week.

In this series, I’ll present the top 100 pro football quarterbacks as ranked by QB-TSP. This is a purely statistical ranking, with all the drawbacks that entails, and in many places it is not reflective of my subjective evaluations. Each week, we’ll examine 20 players, continuing this week with ranks 61-80. As a quick refresher/update, here are rough explanations of single-season TSP: [continue reading…]

{ 0 comments }