≡ Menu

What a spicy hot take of a headline, I know.  Continuing on yesterday’s theme, let’s talk more about at Joe Flacco’s career with the Ravens. He has a career Adjusted Net Yards per Attempt average of 5.64, which is not very good. In fact, it’s pretty bad: the average ANY/A over the last 10 years was 5.94, when you weight the average in each season by the percentage of Flacco’s career attempts that came in that season.  Flacco, therefore, has a career Relative ANY/A of -0.29 (difference due to rounding), which you can see below:

Here’s the other interesting thing about this: Flacco has 5,608 pass attempts/sacks with the Ravens, the 12th-most dropbacks of any quarterback with one team since 1970. And as you can probably guess, Flacco is the only one with a negative RANY/A. You have to go to Drew Bledsoe with the Patriots (4780 dropbacks, -0.02 RANY/A) to find the next quarterback with a negative RANY/A with one team and a lot of playing time. And after Bledsoe — who barely qualifies — you have to go down to Randall Cunningham with the Eagles, who had 3784 dropbacks and a -0.37 RANY/A. [continue reading…]

{ 0 comments }

Joe Flacco’s Career, A Revised Graphic Novel

My favorite measure of quarterback play is Adjusted Net Yards per Attempt. For new readers, ANY/A is simply yards per attempt, but it includes sacks (both in the denominator and with those yards lost deducted from the numerator) and adjustments for touchdowns (20-yard bonus) and interceptions (45-yard penalty).

Midway through the 2016 season, I looked at Joe Flacco’s ANY/A average in every game of his career.  I want to update that post today.  The graph below shows Flacco’s trailing ten game ANY/A over each ten-game block of his career (excluding the postseason).  His best stretch was from games 4 through 13 of the 2013 season, where his average ANY/A over those ten games (taking an average of the averages) was 7.92.   His worst T10G ANY/A was 3.74, covering the final three games of 2016 and the first seven games of 2017.

Perhaps most importantly, I included a black line representing the league average for each of these trailing ten games.  The black line represents the NFL average ANY/A for that season, but it combines averages when crossing seasons (so the T10G ANY/A at week 5 of 2017 is 50% of the NFL 2017 ANY/A average and 50% of the NFL 2016 ANY/A average).

Okay, that’s a lot of fine print.  In short: the purple line is how good Flacco’s been over a stretch of ten games; the black line is average.  He’s below-average a lot lately: [continue reading…]

{ 0 comments }

We don’t spend a lot of time looking at the bottom of leaderboard. When it comes to efficiency stats, you need to have a minimum threshold of quantity to qualify for such title. When it comes to passer rating, that minimum is 14 attempts per team game. Last year, DeShone Kizer had the worst passer rating in the NFL. In the last 11 years, the Jets have had three different quarterbacks with the worst passer rating in the NFL (Ryan Fitzpatrick, Geno Smith, and Kellen Clemens), while the entire NFC has just one (Jimmy Clausen).

The table below shows the quarterback with the worst passer rating in every year since the merger (along with their era-adjusted passer ratings), an update of this post from three years ago.

What you might notice in addition to a few Super Bowl winning quarterbacks on the list, is that Vinny Testaverde is the only one on there twice. [Editor’s note: Jeff Kemp actually finished with the worst passer rating of any QB in 1991.] Testaverde has 38 points of bad Gray Ink — i.e., if you assign 10 points to a last-place finish, 9 points to a second-to-last place finish, 8 points to a third-from-the-bottom spot, and so on. He ranked last in ’88 (10 points), second-to-last in ’91 (9 points), 5th-from-the-bottom in ’89 (+6), 7th from last in ’00 (+4), 8th from the bottom in ’04 and ’94 (+6), 9th from the bottom in ’92 (+2), and 10th from last in ’01 (+1), for a total of 39 points.

That’s the most of any quarterback since 1970, narrowly edging out well, a few other names that I doubt will surprise you.

What stands out to you?

{ 0 comments }

On Thursday, I posted a methodology to determine which wide receivers played on the most pass-happy teams, and yesterday, I posted another method of examining the same concept. Today, we will use the same approach to measure which receivers played in the most efficient passing offenses.

Efficiency is defined using Relative ANY/A, which is Team ANY/A minus League Average ANY/A. Let’s use Jerry Rice as an example. You will not be surprised to see that he generally played on very efficient passing offenses.  In 1995, Rice had 1,848 receiving yards, which was 8.1% of his career receiving yardage.  The 1995 49ers had a Relative ANY/A of +1.19 which means 8.1% of Rice’s career RANY/A grade is going to have a weight of +1.19.  Do this calculation for every season of his career, and you see that Rice had a career RANY/A of +1.57.

The table below shows the career RANY/A grades for all receivers with at least 5,000 receiving yards:

None of the Hall of Fame receivers have negative RANY/A grades, although Larry Fitzgerald and Calvin Johnson will probably change that.

Here’s a look at the 23 receivers with 8,000 career receiving yards and played on below-average passing teams:

You will not be surprised to see Joey Galloway on there at -0.45, at least not if you have been paying attention.

{ 1 comment }

Yesterday, I posted a methodology to determine which wide receivers played on the most pass-happy teams. For example, Calvin Johnson played on teams that averaged 39.5 pass attempts per game, when you place more weight on Johnson’s best seasons.  But as Bryan pointed out in the comments yesterday, another good way to look at the numbers is to see how pass-happy each team was relative to league average, something I did three years ago.  By way of comparison, Megatron’s teams passed 115.2% of league average during his career, again weighted for his best seasons.

This method will make most receivers appear to have played on more pass-happy teams, since most receivers have their best years on teams that pass the most (and this method gives more weight to best seasons).  But that should effect all receivers, so I’m not too worried about that.  Here is the same table as yesterday, but with percentage of league average as the key variable rather than pass attempts per game: [continue reading…]

{ 0 comments }

Which receivers played on the most pass-happy teams? It’s a bit tricky to measure that: if a receiver played on run-heavy teams most of his career, but plays a couple of final seasons for teams that throw for 600+ attempts while he is a reserve, that would skew his average. So we need to adjust for a player’s best seasons when measuring how pass-happy his teams were.

Let’s use Calvin Johnson as an example. He played for the Lions in each season of his career, and Detroit has been very pass-happy throughout his career.  In 2015, he had 1,214 receiving yards, which was 10.4% of his career receiving yards.  That year, the Lions threw 632 times, or 39.5 times per game.  So for Johnson’s career pass-happy grade, 10.4% of it will be based off of an average of 39.5 attempts per game.  In 2012, Johnson had 16.9% of his career receiving total, so 16.9% of his pass-happy grade will be based off of the 740 attempts the Lions had that year.  Perform that analysis for every season, and Johnson has an adjusted average of teams throwing 39.5 times per game, as per the table below.

I did this calculation for every receiver in NFL history with at least 5,000 pass attempts. The table below is fully sortable and searchable, but it is initially sorted by career receiving yards. [continue reading…]

{ 0 comments }

Top 100 QBs: 81-100, By Brad Oremland

Brad Oremland is a longtime commenter and a fellow football historian. Brad is also a senior NFL writer at Sports Central. There are few who have given as much thought to the history of quarterbacks and quarterback ranking systems as Brad has over the years. What follows is Brad’s latest work on quarterback statistical production.


This is part one of a seven-part series. It is a supplement to my 2015 series on the greatest quarterbacks of all time, last year’s article on the top-ranked QBs in Total Statistical Production, and last week’s post about QB-TSP in the 2017 season and another way of using TSP. I strongly encourage you to read those pieces if you haven’t done so previously.

In this series, I’ll present the top 100 pro football quarterbacks as ranked by QB-TSP. This is a purely statistical ranking, with all the drawbacks that entails, and in many places it is not reflective of my subjective evaluations. For each of the next five Wednesdays, we’ll examine 20 players, starting this week with ranks 81-100. For each player, you’ll find data presented in this form:

[rank]. Player Name — Adjusted TSP — Career Value — Top 10s – Top 10 Points – Year-Points

These statistical categories are explained in the links above; again, if you haven’t read them recently, I’d encourage you to do so. TSP and Career Value are calculated the same way as I indicated last year, except that I have indeed switched to a ^1.85 modifier, which reduces the impact of exceptional seasons and blunts the ranking of one-year wonders. As a quick refresher/update, here are rough explanations of single-season TSP: [continue reading…]

{ 0 comments }

Running Back Heat Maps – 2017 Season

Two years ago, I looked at running back heat maps for the 2015 season; that was a fun article, so let’s update those numbers for 2017. This builds off of yesterday’s post about yards per carry.

Last season, Steelers running back Le’Veon Bell led the NFL in rushing attempts.  How did Bell fare? Well, he had a slightly below-average 4.02 yards per carry average, but that was due to a lack of big plays.  You may be as shocked as I was to learn that Bell didn’t have a single rush go for even 30 yards; his long of the year was a 27-yard rush against the Chiefs.  It’s hard to stand out in yards per carry without big runs, and Bell is a good example of how you can still be an effective runner without big gains.

Bell rushed for positive yards on 85% of his carries; that’s very good, because the average among all running backs with at least 100 carries was 80%.  In fact, Bell was 5% or 6% above average at gaining at least 1, 2, or 3 yards on all of his carries last year, and he was above average at gaining at lest 4, 5, 6, 7, 8, 9, or 10 yards.  And Bell gained at least 15+ yards on 4% of his carries, matching the league average. But Bell gained at least 20 yards on only 1% of his carries (and, of course, at least 30+ yards on 0% of his carries), compared to the league average of 2%.  That’s the only reason Bell comes in with a below-average YPC number from 2017.

In the picture below, I’ve listed all running backs with at least 100 carries. I have then shown how they fared at rushing for at least 1 yard, at least 2 yards, at least 3 yards,… at least 10 yards, at least 15+ yards, and at least 20+ yards. A blue shading is good: that means a player gained yards at a higher clip than average. A red shading is bad, even though this is a heat map, since I think it makes more sense to associate red with bad (if you don’t like the way my brain works, you can let me know in the comments). [continue reading…]

{ 1 comment }

Three years ago, I wrote this post titled “Take Away His X Best Carries and He’s Average.”  I did the same thing last year, too. The idea was simple: Suppose you sort each running back’s carries in descending order by yards gained. How many carries would we need to take away from him to drop his production to at or below average?

There were 47 running backs last season who had at least 100 carries in 2017, those players averaged 4.08 yards per carry last season.  The best running back by yards per carry last season, by far, was Alvin Kamara, with a remarkable 6.07 average gain.  Kamara had just 120 carries last year, but he was remarkable at producing big runs. He had 13 carries of 15+ yards last season, an unfathomable (and unsustainable) rate of one 15+ yard run every 9.2 carries.  Kamara’s lofty YPC number wasn’t the result of one big run, which is often the case for a player with a high YPC average on a low number of runs: sure, Kamara had a 74-yard run, but no other run went for more than 25 yards.

In fact, if you removed Kamara’s 12 best runs, he would have still averaged 4.083 YPC, a hair above the 4.078 average among all running backs with 100+ carries.  So in order to bring Kamara’s YPC below-league average, you need to remove his 13 best runs of the season.

The next best player by this metric was Patriots RB Dion Lewis.  You might be surprised that Lewis — who had a 4.98 YPC on 180 carries — would be higher than Chiefs RB Kareem Hunt, who averaged 4.88 YPC on 272 carries.  All else being equal, this metric rewards players with higher averages on a larger number of carries. But that’s what made Lewis’s season so impressive: he averaged 4.98 YPC despite his longest run being just 44 yards, and his second-longest topping out at 31 yards.  Hunt had runs of 69, 58, and 53 yards.  Take away Lewis’s best 5 runs, and his YPC drops to 4.26; take away Hunt’s best five, and he drops below average to 4.04.

The table below shows for each RB how many of their best carries you need to take away to bring their 2017 YPC average below 4.08. [continue reading…]

{ 0 comments }

Yesterday, I noted that the rate of passing touchdowns has been relatively stable throughout NFL history. But that doesn’t mean the type of passing touchdown hasn’t changed.

In the post-World War II era, the average length of touchdown pass was occasionally over 30 yards! Today, the average length of each touchdown pass is below 20 yards, and it’s been
for every season since 2006. Most of the change came in the ’60s and early ’70s, as opposed to the many changes in passing statistics that are the result of the west coast offense.

The graph below shows the average length of touchdown passes in each professional football season (combining the AFL, AAFC, and NFL) since 1940. [continue reading…]

{ 0 comments }

Touchdowns per game, 1950-2017

You might be surprised to learn that despite the passing game becoming more productive than ever, the number of passing touchdowns hasn’t gone up very much. In the early 1950s, teams averaged between 1.3 and 1.5 touchdowns per game; that number has gone up and down a bit over the last 70 years, but last season, teams averaged 1.45 passing touchdowns per game, lower than in 1952.

Rushing touchdowns per game, on the other hand, have seen a more steady decline. The graph below shows the number of passing, rushing, defensive, and special teams touchdowns per team game across each NFL season since 1950. Defensive touchdowns have been pretty consistently around 0.15 per team game, while special teams touchdowns were at 0.05 TD/G. That last number, however, has been in a rapid decline: the last two years were at just 0.03 TD/G.

Here’s another way to look at the same data: the percentage of all passing/rushing/defensive/special teams touchdowns per season.

But if you want to know where the biggest change in NFL scoring has been, you have to look at field goals.

What do you think?

{ 0 comments }

Adam Steele is back for another guest post. You can view all of Adam’s posts here. As always, we thank him for contributing.


Surplus Yards 2017

In response to the Jared Goff post from earlier this month, I wanted to delve into the yardage a QB picks up on long plays. I theorized that Goff’s historical ANY/A leap in 2017 was in part fueled by an unsustainable number of long completions. To measure this, I created a stat called Surplus Passing Yards. Its calculation is quite simple – on any given completion, yardage in excess of 40 is deemed to be surplus. So a 67 yard pass play yields 27 surplus yards. I then add up the surplus yards for all applicable plays during a season. [1]You may be wondering why I choose 40 yards as the cutoff for a “normal” play. After digging through years of play-by-play and running some correlations, 40 yards seems to be the inflection point … Continue reading

Having established in the above footnote that surplus yards are random and not indicative of QB skill, let’s take a look at the qualifying quarterbacks from 2017. The chart below shows every  40+ yard completion from each QB along with his total surplus yardage. For example, Alex Smith had 13 long passes of 40+ yards; his longest pass went for 79 yards, his second-longest pass for 78 yards, his third-longest for 75 yards, etc. That means his longest pass had 39 Surplus Yards, his second-longest completion had 38 Surplus Yards, and so on; all told, he had 236 Surplus Yards last season, the most in the NFL. [continue reading…]

References

References
1 You may be wondering why I choose 40 yards as the cutoff for a “normal” play. After digging through years of play-by-play and running some correlations, 40 yards seems to be the inflection point where randomness takes over. The ability to complete passes in the 30-40 yard range is a repeatable skill, and is often the determining factor that separates the great QB’s from the average ones. But beyond 40 yards, the yardage picked up very long pass plays is almost entirely random from season to season. I calculated the surplus yards for all qualifying QB’s from 1994-2017, then compared all cases where a QB attempted 224+ passes in consecutive seasons. To avoid biasing the results by playing time, I converted the data into Surplus %, or the percentage of passing yards that came via surplus yards. Over a sample of 513 season pairs, the correlation of Year N to Year N+1 surplus % was a miniscule .04 with an R^2 of .002!
{ 1 comment }

Will Drew Brees Pull A Sammy Sosa In 2019?

If you were a baseball fan and alive in 1961, you probably remember where you were when Roger Maris broke Babe Ruth’s single-season home run record with his 61st home run of the season.

One of the most memorable sports moments of the ’90s was on September 8th, 1998, when Mark McGwire his hit 62nd home run of the season, breaking Maris’s record.

And there was no shortage of fan fare when Barry Bonds broke McGwire’s record, hitting his 71st home run of the season on October 6th, 2001.

But Ruth, Maris, McGwire, and Bonds aren’t the only players in the last century to hold the single-season home run record.  Because Sammy Sosa was once held the record for most home runs in a season, and he did it without any fanfare at all.  That’s because it happened on September 25th, 1998 in a game between the Cubs and Astros.. Sosa hit his 66th home run of the season that night, breaking McGwire’s record of 65 home runs. Of course, there were still a few games left, and McGwire had just broken the record with his 62nd home run… and his 63rd, and his 64th, and his 65th home runs. And 45 minutes later, in a Cardinals/Expos game, McGwire hit hit 65th home run of the season, and Sosa would never again stand alone as the single-season record holder but for those 45 minutes.

So why the baseball detour today? Because Tom Brady and Drew Brees may re-create the McGwire/Sosa race in a couple of years.  Two years ago, I noted that both Brady and Brees finished the 2015 season tied with 428 career touchdown passes. Now, both players are tied again with 488 career touchdown passes! So who will finish as the career record-holder?

Right now, Peyton Manning is the passing touchdown king with 539 touchdowns, so Brees and Brady need 52 more touchdown passes to set the mark. Brees will pass Manning as the all-time leader in career passing yards with his 1,496th passing yard of the 2018 season, but it is very unlikely that Brees or Brady challenges Manning’s touchdown mark until 2019.

So how did we get here? The graph below shows how many career touchdowns Brady (in dark blue) and Brees (in gold) had after each week of each season since 2001, the year they both threw their first touchdown pass. [continue reading…]

{ 0 comments }

Brad Oremland is a longtime commenter and a fellow football historian. Brad is also a senior NFL writer at Sports Central. There are few who have given as much thought to the history of quarterbacks and quarterback ranking systems as Brad has over the years. What follows is Brad’s latest work on quarterback statistical production.


Best Statistical QBs of 2017

This is the third time in the last four years that I’ve written about my preferred stat for evaluating NFL quarterbacks, QB-TSP. In this post, you’ll find scores from the 2017 season, plus another way of using TSP.

If you’re not already familiar with the stat, I’d encourage you to read about how it works, but if you’re in a hurry, it is a purely statistical ranking, not my opinion. TSP measures production above replacement level, with “replacement level” defined as the level of play you’d expect from an available free agent (not your top backup). A good example last season was Jay Cutler, lured from retirement to play for Miami after Ryan Tannehill got hurt. Robert Griffin and Johnny Manziel didn’t play last season, but either one would have been a replacement player, as would an undrafted college senior. Anyone who you’re not sure whether or not they were still on a roster, like Kellen Clemens or Kellen Moore, is probably right around replacement level.

Here are rough explanations of single-season TSP and how it translates to Career Value:

* Zero TSP (0 CV) indicates replacement-level performance, on the fringe of being playable. 2017 example: Trevor Siemian.

* 500 TSP (0.3 CV) is an inconsequential season, an ineffective starter or a good part-time player. 2017 examples: Jacoby Brissett, Aaron Rodgers.

* 1000 TSP (1 CV) is an average season. The player had some value to his team, but he wasn’t a Pro Bowl-quality performer. 2017 examples: Blake Bortles, Dak Prescott.

* 1500 TSP (2 CV) is a good season, a top-10 season, a borderline Pro Bowl season. This is a positive contribution to any player’s résumé. 2017 examples: Ben Roethlisberger, Matthew Stafford.

* 2000 TSP (3.5 CV) is a great season. It’s a top-5 performance, the player almost always makes the Pro Bowl, and he’ll usually generate some all-pro support. 2017 examples: Alex Smith, Tom Brady.

* 2500 TSP (5.5 CV) is an exceptional season. These only occur about twice every three years. Most of them were first-team All-Pro, and about half were named league MVP. 2017 example: none. Matt Ryan in 2016 scored at this level, though.

* 3000 TSP (7.5 CV) is a legendary season, and the player always wins MVP. There have only been seven, the most recent being Peyton Manning in 2013 and Tom Brady in 2007.

I’ll begin with raw data: QB-TSP for the top 40 in passing yards from the 2017 NFL season. The era-adjusted score, in the final column, is the one that aligns to the categories above. [continue reading…]

{ 1 comment }

Punting Value vs. Punting Skill, by Bryan Frye

Today’s post is from friend of the site Bryan Frye. You can view all of Bryan’s guest posts here, and follow him on twitter @LaverneusDingle. What follows are Bryan’s words, with minor editing from Chase.


Last month, I had a mini tweet storm about punting value versus punting skill, where I discussed punters, how to measure punting, and how to reconcile the apparent gap between value (as measure by expected points) and perceived skill. Today, I want to revisit some of my ideas, expand on them, and offer them for debate among the smart readers of this site. I know punting isn’t the most exciting topic, even for die hard football fans, but I used to punt in Pop Warner and have always been a bit of a punting aficionado.

Methodology

First, I gathered all punts from 2009-2017. Then, I removed those that came from non-punters. Next, I excluded blocked kicks, scoring plays, and turnovers, which are rare events that dramatically skew data and may not actually be indicative of a punter’s ability. I was left with 18,375 punts ripe for examination. [1]Ideally, we could include hang time in the equation to see if that proves to be a significant factor. Anecdotally, a team would prefer a 40 yard punt that spent 4.3 seconds in the air to a punt of … Continue reading

To try to assign expected value to punts from a given yard line, I looked at the Expected Points Added by all punts in the data set. [2]For EPA, I am using Ron Yurko’s version.  I then plotted yards from end zone (e.g., kicking from your own 20 is 80 yards from the end zone) against EPA and used a sextic function to find a best fit line for what our expectations should be for a punt from a particular yard line. [3]The function, for those interested: y = -0.000000000743805x6 + 0.000000263921778x5 – 0.000037400877394x4 + 0.00269765455x3 – 0.105061671689785x2 + 2.1744406183205x – 20.578738996142. … Continue reading

Punting Value Versus Punting Skill: In Theory

I tend to think of punters in two categories: coffin corner punters and distance punters. Coffin corner punters are known as technicians for their incredible ability to spot the ball seemingly wherever they want to. They are, based on my analysis pretty clearly the more skilled punters. Distance punters often put up big kicks because they play on bad teams that punt often from deep inside their own territory. They are seen as the brute force, unskilled bangers of the punting community. There are also guys like Johnny Hekker, who can do it all with aplomb, but special cases are exactly that – special. For most of my life, I have been on the side of the technicians and derided the big-legged guys who seem to lack control over their kicks. However, evidence suggests that, while the booming kicks may take less finesse, they may contribute more toward winning games.

Coffin corner kicks require a deft foot, but they also tend to produce less value from an EPA perspective. This is because the kicks often come from midfield or opponent territory, where EPA often advocates trying for a conversion or field goal. Punting sacrifices possession of the ball for field position, and because it is similar to a turnover, it is difficult to achieve a high EPA on any punt. This is especially true when teams opt to cede possession of the ball at the expense of a scoring opportunity. The red trend line on the chart below represents the expected point value of a punt from the corresponding yard line. Notice that the red line drops below zero inside of a team’s own 10 yard line and once a team reaches its own 45 yard line. This means EPA sees the idea of punting from within 55 yards from goal as an automatic negative, making it impossible for even the best punt to produce positive EPA in that situation. [4]With the exception of a muffed punt, but I haven’t seen any credible evidence suggesting forcing turnovers is a real punting skill and not just a product of chance. Also note that going for it from … Continue reading [continue reading…]

References

References
1 Ideally, we could include hang time in the equation to see if that proves to be a significant factor. Anecdotally, a team would prefer a 40 yard punt that spent 4.3 seconds in the air to a punt of equal distance that took only 3.6 seconds to land. It would be nice to test to see if that anecdote is founded in reality and not just a vague idea of “common sense” or whatever term people who prefer not to think too much call it. Unfortunately, I have only seen the Rams and Raiders consistently mention hang time in their game logs.
2 For EPA, I am using Ron Yurko’s version.
3 The function, for those interested: y = -0.000000000743805x6 + 0.000000263921778x5 – 0.000037400877394x4 + 0.00269765455x3 – 0.105061671689785x2 + 2.1744406183205x – 20.578738996142. Obviously, there’s no real reason to show this many significant digits, but I wanted to be sure to show clear differentiation in the small numbers. This function produced an R2 of 0.13.
4 With the exception of a muffed punt, but I haven’t seen any credible evidence suggesting forcing turnovers is a real punting skill and not just a product of chance. Also note that going for it from midfield can also be a negative EPA proposition, if the distance is long enough. In those cases, a team is left with picking the “less bad” option. So it’s not “never punt from inside the 50” as much as it is “think twice about punting from inside the 50.” In general, avoid nevers and alwayses. In the future, I plan to revisit this specific aspect of using EPA to judge punting and the coaching decision to punt.
{ 1 comment }

Memorial Day 2018

Pat Tillman

It is the soldier, not the reporter, who has given us freedom of the press. It is the soldier, not the poet, who has given us freedom of speech. It is the soldier, not the campus organizer, who has given us the freedom to demonstrate. It is the soldier, who salutes the flag, who serves beneath the flag, and whose coffin is draped by the flag, who allows the protester to burn the flag.
Father Dennis Edward O’Brien, USMC

Today is a day that we as Americans honor and remember those who lost their lives protecting our country. As my friend Joe Bryant says, it’s easy for the true meaning of this day to get lost in the excitement of summer and barbecues and picnics. But that quote helps me remember that the things I enjoy today are only possible because those before me made incredibly selfless sacrifices. That includes a number of football players who have lost their lives defending our country.

The most famous, of course, is Pat Tillman, the former Arizona Cardinals safety who chose to quit football to enlist in the United States army. On April 22, fourteen years ago, Tillman died in Afghanistan. Over thirty years earlier, we lost both Bob Kalsu and Don Steinbrunner in Vietnam. You can read their stories here. For some perspective, consider that Hall of Famers Roger Staubach, Ray Nitschke, and Charlie Joiner were three of the 29 NFL men who served in the military during that war.

An incredible 226 men with NFL ties served in the Korean War, including Night Train Lane and Don Shula. Most tragically, World War II claimed the lives of 21 former NFL players.

Jack Chevigny, former coach of the Cardinals, and John O’Keefe, an executive with the Eagles, were also World War II casualties. The Pro Football Hall of Fame has chronicled the stories of these 23 men, too. Lummus received the Medal of Honor for his bravery at Iwo Jima, and you can read more about his sacrifice here. In 2015, the Giants inducted him into the team’s Ring of Honor.

[continue reading…]

{ 0 comments }

Single-Season Era-Adjusted Passer Ratings

On Monday, I published updated (through 2017) career passer ratings that are adjusted for era. Last year, I published the single-season ratings, so I wanted to update that post today.

Passer rating is a bad stat, and era-adjusted passer ratings have all of those same flaws, too. But EA-PR is without question better than passer rating, and since passer rating is such a ubiquitous stat, I wanted to post all of the EA-PRs so you could have them at your disposal (the table below has over 7,700 rows!).

Below are the era-adjusted passer ratings for every player in every season since 1932.  Here’s how to read the table below, which is fully sortable and searchable.  Sid Luckman has the best single season, playing in the NFL for Chicago in 1943.  That season counted for 11.58% of his career pass attempts (useful if you want to calculate a player’s career passer rating), as he threw 202 passes, completed 110 of them for 2,194 yards with 28 TDs and 12 INTs.  That was enough attempts to qualify for the passer rating crown; his actual passer rating was 107.5, and his Era Adjusted Passer Rating was 135.0, the best ever. [continue reading…]

{ 0 comments }

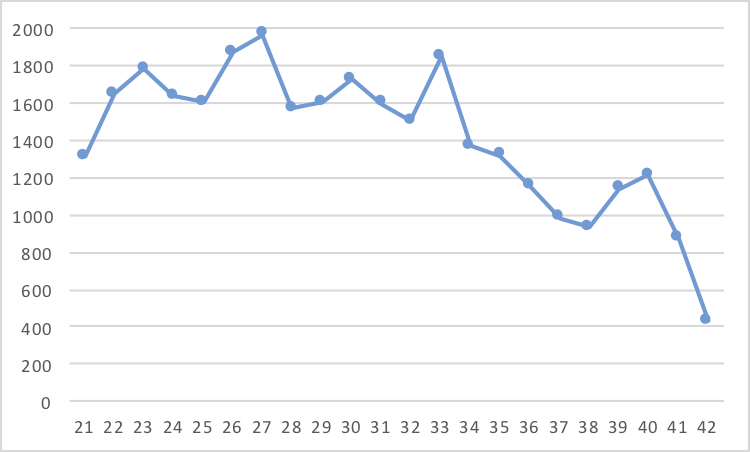
You probably know that Jerry Rice gained 1,139 receiving yards at age 39 with the Raiders in 2001, easily the most of any player at age 39. Only two other wide receivers (Charlie Joiner, 440 yards; Joey Galloway, 173 yards) gained any yards at all at age 39.

You probably know that the next year was Rice’s most remarkable feat. Nobody in NFL history other than Rice gained any yards at age 40 or later, but that year, Rice gained 1,211 yards in Oakland in 2002.

You probably also know that Rice didn’t stop there: he gained 869 yards in 2003 at the age of 41.

And you know that Rice also played at age 42, where he gained 429 yards.  By way of reference, Larry Fitzgerald will be 42 in 2025, by which point in time he may already have been in Canton for a year.

So yes, Rice gained more receiving yards at age 39, 40, 41, and 42 than anyone else in NFL history.  But you probably already knew that.  But did you know that three other times Rice gained more yards than anyone else at any age in NFL history?

Rice gained 1,499 yards in 1994 at age 32, the most in NFL history.  In fact, 1499 yards remains the most by by any player not named Rice at age 32 or older.

Rice then gained a whopping 1,848 receiving yards in 1995, at 33 years old, at the time an NFL record and still the most yards by any player older than 27 years of age.

Oh, and at 36, Rice picked up 1,157 receiving yards, the most of any player at that age, too.

So the single-season record holders in receiving yards at age 32, 33, 36, 39, 40, 41, and 42 are all Rice.

Only two other players hold the record for most receiving yards at age X for two different ages (no other player has done it for three).  Can you name them?  While you think about that, the graph below shows the receiving yards leaders by age:

[continue reading…]

{ 1 comment }

Best Passing Teams At Picking Up First Downs

Yesterday, I looked at passing first down data, with an emphasis on percentage of passing plays (including sacks) that went for first downs.

The 2016 Atlanta Falcons had an incredible offense.  Like, a really, really good offense that had lots of eye-popping statistics. Here’s another one: the Falcons picked up 239 passing first downs on 537 pass attempts plus 37 sacks. That means Matt Ryan and company picked up a first down on 41.6% of all passing plays.  That’s the fourth best rate in NFL history.

The best rate belongs to the 2004 Colts, at 44.0%.
The second-best rate belongs to the 2013 Broncos, at 42.2%.
The third-best rate belongs to the 2006 Colts, at 42.1%.

Any guesses what those three teams have in common?

The 2004 Colts had Peyton Manning and Marvin Harrison, Reggie Wayne, Dallas Clark, and Brandon Stokley.

The 2006 Colts had Manning, Harrison, Wayne, and Clark, too.

The 2013 Broncos? They had Manning, Demaryius Thomas, Eric Decker, Wes Welker, and Julius Thomas (Stokley was on the 2012 Broncos).

So maybe it was the quarterback.  The table below shows the top 100 teams in percentage of team passing plays that went for a first down. [continue reading…]

{ 0 comments }

Completion Percentage and First Downs

In the middle of the 2017 season, I wrote a bit about completion percentage and first downs. Here’s one of my favorite charts to explain the evolution of the passing game in the NFL: the blue line shows completion percentage for each season in the NFL since 1960, a number that is steadily rising. The orange line shows first downs gained on completed passes in the NFL since 1960, which has been steadily declining:

How about first downs per pass play (including sacks)? That’s a number that’s been pretty consistent: it’s been between 28% and 33% every year, and while it’s showing a slight increase over time, it’s pretty slight. [continue reading…]

{ 1 comment }

Additional Thoughts on Average Sack Yards Lost

Yesterday, I discussed the average amount of yards lost on sacks over NFL history.  The average has been stable at around 6.5 since 1993, although it was much higher (for reasons still to be determined) in older periods.  Today, though, I want to look at the relationship between sack yards lost per sack and other variables for individual quarterbacks.

I looked at all quarterbacks with at least 224 pass attempts since 2002. The graph below shows those 522 quarterbacks and how they fared in both sack rate (X-Axis) and yards per sack lost (Y-Axis):

As you can see, there is not much of a correlation there (-0.10), although there is a slight relationship that as sack rate increases, sack yards lost per sack goes down.

What about running quarterbacks — do they have longer average yards lost due to sacks? Anecdotally, it feels like no: Michael Vick was at 5.9, Randall Cunningham 7.3, Cam Newton is at 7.6, Steve Young 5.7, Steve McNair 6.2, Donovan McNabb 6.4, Russell Wilson 6.4, and Tyrod Taylor is at 5.4.  What about over a larger sample?

Here is the same graph again, but instead of sack rate on the Y-Axis, I’ve plotted a measure of rushing prowess.  What measure? I used rushing yards per pass attempt, which should give some measure of running quarterbacks.  For example, last year, the top three players by that metric were Newton (1.53), Wilson (1.06), and Taylor (1.02). The top two years go to Vick — 2.81 in ’04, and 2.68 in ’06.

The correlation coefficient here is -0.20, indicating a weak negative relationship: as rushing prowess goes up, yards per sack lost goes down ever so slightly.

How about sack yards lost and completion percentage? Well, there is no correlation there at all.

What would you like to see in Part III?

{ 0 comments }

Byron Leftwich and Average Length of Sack

Let me tell you something I bet you didn’t know about Byron Leftwich: he was sacked 92 times in his career. There were 44 quarterbacks from 2003 to 2012 with 1500+ passes; of that group, Leftwich ranked 17th in sack rate at 5.4%.  But here’s something I bet you didn’t know about Leftwich: on his sacks, he lost just 452 yards, and averaged just 4.91 yards lost per sack. That is the lowest average in NFL history (well, at least since the merger, but likely in history; see graph below) among quarterbacks with 1500+ attempts. [1]Note: From 2003 to 2012, Jeff Garcia averaged just 4.86 average sack yards lost, so Leftwich ranked second during this time. Leftwich’s career spanned this decade, but Garcia entered the league … Continue reading

We don’t spend much time looking at yards lost per sack, and perhaps with good reason.  Here are the 10 players with the lowest average yards lost per sack since 1970 among passers with 1500+ attempts, all of whom lost under 5.7 yards per sack:

That’s not exactly a who’s who list of the best quarterbacks in NFL history.  I’d like to spend more time looking at average sack yards lost and see what is there, so I’m going to open this up to the smart readers in the comments.  So let’s start with an interesting graph: here is the average yards lost per sack for each year in NFL history beginning in 1960: [continue reading…]

References

References
1 Note: From 2003 to 2012, Jeff Garcia averaged just 4.86 average sack yards lost, so Leftwich ranked second during this time. Leftwich’s career spanned this decade, but Garcia entered the league in 1999 and his average sack was 5.23 yards for his career.
{ 0 comments }

Background reading (Part I, Part II, Part III, Part IV, Part V: Career Era-Adjusted Passer Ratings Through 2016, 2017 Era-Adjusted Passer Ratings). You can also view the single-season era-adjusted passer ratings here.

The NFL’s passer rating formula can be broken down into the following.

A = (Cmp% – .30) * 5
B = (Y/A – 3.0) * .25
C = TD% * 20
D = 2.375 – Int% * 25

Passer Rating = 100 * (A + B + C + D) / 6

Let’s use Tom Brady as an example.  He has a completion percentage of 63.93 (making A = 1.696), a yards per attempt average of 7.514 (making B = 1.128), a TD percentage of 5.54% (making C = 1.108), and an INT percentage of 1.82% (making D = 1.921).  If you sum A, B, C, and D, multiply by 100, and divide by 6, you get 97.6, which is Brady’s career passer rating.

Last year, I derived the formula to create era-adjusted passer ratings.  This is necessary because the league averages in these variables — particularly completion percentage and interception rate — have changed dramatically over the last 50 years.  For example, when passer rating was created in the early 1970s, the average completion percentage was 50%.  So instead of taking each passer’s completion percentage and subtracting 0.30 (before multiplying by 5), we take each passer’s completion percentage and subtract from that the league average in a given season minus 0.20.  This makes a completion percentage of 60% in the 1970s equivalent to a completion percentage of 70% when the league average completion rate is 60%.

We can do that for all the four variables, and keep the same formula/structure largely in place.

Here are the new formulas for each of the four variables:

A = (Cmp% – (League_Avg_Cmp% – 0.20) ) * 5
B = ( Y/A – (League_Avg_Y/A – 4.0) ) * .25
C = TD% * 20 + (1 – 20 * LgAvgTD_Rate)
D = 2.375 – (Int% * 25 + (1.375 – 25 * LgAvgINT_Rate) )

Then we sum A through D, multiply by 100, and divide by 6.  The table below shows the career era-adjusted passer ratings for the 186 passers with at least 1,500 attempts. Here is how to read the table below. Otto Graham is the career leader in era adjusted passer rating (this analysis includes AAFC and AFL data — we are only adjusting for era in this analysis, not strength of league). He threw 2,626 passes in his career, began in 1946 and finished in 1955, had an actual passer rating of 86.6, and an era adjusted passer rating is 95.2. Graham, of course, is in the Hall of Fame. [continue reading…]

{ 0 comments }

2017 Era-Adjusted Passer Ratings

Last year, I wrote a six-part series on adjusting passer ratings for era.

Background reading:

Part I

Part II

Part III

Part IV

Part V (Career Passer Ratings)

Part VI (Single Season Ratings)

Passer rating is made up of four variables: completion percentage, yards per attempt, touchdown percentage, and interception percentage.  The reason passer rating needs to be adjusted for era? When it was derived, in order to get an average rating in each of the four variables, a passer needed to complete 50% of his passes, average 7.0 yards per pass, have a touchdown rate of 5%, and have an interception rate of 5.5% (yes, INT rates used to be higher than TD rates).  But those numbers — 50%, 7.0, 5%, 5.5% — were pegged in the 1970s and are not dynamic.  However, I came up with a formula that matches the intent of passer rating but just ties the variables to the league average in any given season. You can get the formulas and read more background in the linked posts.

Now, in 2017, the four averages were 62.1%, 7.02, 4.24%, and 2.46%.  One thing to keep in mind: these adjustments will not change the order of passer ratings in a given season.  So Alex Smith, Drew Brees, Tom Brady, Carson Wentz, and Jared Goff remain the top five; the way the formula works, it just subtracts a fixed amount from each passer’s actual passer rating.  In 2017, that amount was 20.26 during a poor passing season; it was 22.59 lower than actual in 2016. [continue reading…]

{ 0 comments }

Weekend Trivia: Leaders in Pass Attempts

In 2017, Tom Brady led the NFL in pass attempts while playing for the 13-3 (0.813) Patriots. Since 1950, there have been just three quarterbacks to lead the league (combining the AFL and NFL) in pass attempts while playing for a team with a winning percentage of 0.813 or better. Can you name them?

Trivia hint 1 Show


Trivia hint 2 Show


Trivia hint 3 Show
[continue reading…]

{ 0 comments }

It has become part of conventional wisdom, I think, to suggest that teams are using running backs as receivers more than ever before. But that continues to not be supported by the evidence. Last year, I looked at the average receiving yards gained in each season by “running backs” in the NFL. Yes, I put running backs in quotes because I didn’t actually look at running backs because, well, positional designations can be a bit tricky the farther back in NFL history you go.

But here is what I did do, and let’s use 2017 as an example. Last year, Kareem Hunt led all players in rushing yards with 1,327. That represented 2.4% of all rushing yards in the NFL last season by all players who gained at least one rushing yard. Hunt was also a good receiver, adding 455 yards through the air. So when figuring out how many receiving yards the “average running backs” gained, 2.4% of that figure will be assigned 455 yards. Todd Gurley rushed for 2.3% of all NFL rushing yards and had 788 receiving yards; therefore, 2.3% of the “average running back” will be credited with 788 receiving yards. Le’Veon Bell was at 2.3% and 655 yards. Add those three together, and 7.0% of the receiving yards by the average running back will be based on an average of 633 receiving yards.

That’s a lot, but there were also eleven running backs with 750+ rushing yards and less than 250 receiving yards: LeGarrette Blount, Latavius Murray, Jordan Howard, Marshawn Lynch, Jay Ajayi, Bilal Powell, Isaiah Crowell, Alex Collins, Dion Lewis, C.J. Anderson, and Frank Gore. In 2016, the “average running back” had 228 receiving yards; in 2017, that number jumped to… 231 receiving yards. By comparison, in 2002, it was 292 receiving yards. [continue reading…]

{ 1 comment }

Jameis Winston Had An Unusual 2017 Season

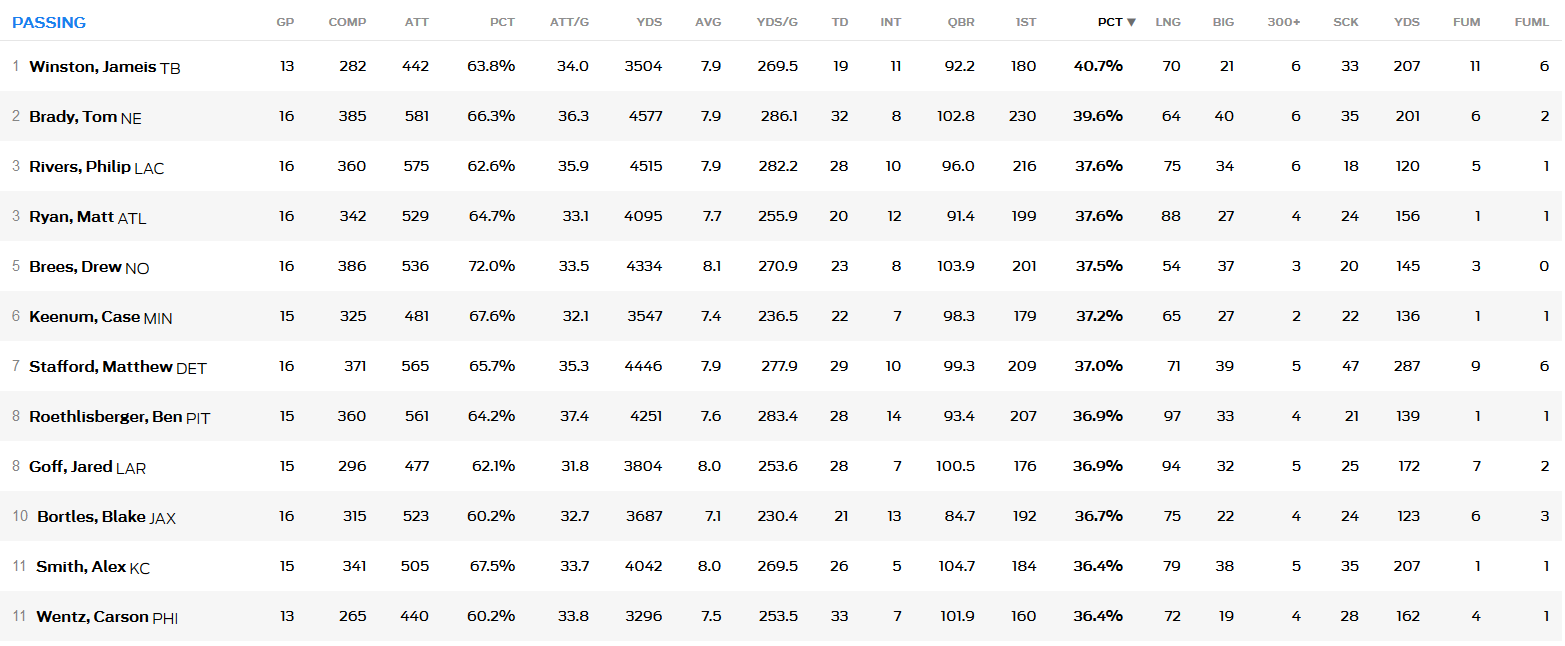
Statistically, Jameis Winston had a strong 2017 season. Winston was above-average in completion percentage, yards per attempt, net yards per attempt, passer rating, and Adjusted Net Yards per Attempt. Overall, Winston ranked 11th in ANY/A and 14th in passer rating, but that might undersell him. That’s because Winston was also the game’s preeminent downfield thrower in 2017. His average pass traveled 10.62 yards in the air, by far the longest in the NFL (Carson Wentz was second at 9.91, followed by Russell Wilson at 9.75, Carson Palmer at 9.36, and Tom Brady at 9.09). Winston also led the NFL in average air yards on completions, at 7.97 (Wentz was seond at 7.79, followed by Palmer at 7.53.)

Winston was throwing longer passes, which hurt his passer rating and completion percentage, but helped his team. Winston picked up a first down on over 40% of his pass attempts, the highest rate in the NFL last season:

And Winston was excellent on third downs, which is a pretty key component of producing an efficient offense. In fact, he ranked 2nd among starting quarterbacks:

So why were the Bucs so bad in 2017? Was it a case of Winston having very good stats but not playing well? I don’t think so. To start, Tampa Bay had the worst defense in the NFL according to DVOA. And the Bucs had very bad special teams, including a disastrous kicking game. Finally, while Tampa Bay ranked 9th in pass DVOA, the Bucs ranked 25th in rush DVOA. The Bucs ranked 30th in rushing yards by running backs (1168) and 29th in rushing yards per carry by running backs (3.53). [continue reading…]

{ 2 comments }

All football historians know about the 1978 rules changes. Here’s an except I wrote about how those changes changed the NFL forever:

There were two key rules changes enacted in 1978. The first prohibited bumping, chucking, or otherwise making anything other than incidental contact with a receiver beyond five yards from the line of scrimmage. The second allowed offensive lineman to be able to extend their arms, and push with open hands, allowing for better blocking and fewer holding penalties. With those rules in place, quarterbacks needed fewer blockers and receivers needed to be less skilled to get open. As a result, three and four wide receiver sets become more common, and the fullback was phased out…. From 1970 to 1977, non-starting wide receivers consistently produced just under 10% of the team’s total receiving yards; by 1990, that number had doubled, and has shown no signs of subsiding.

So what was the impetus for those changes? The 1977 season, which was a passing nightmare. In 1976, teams averaged 4.07 Adjusted Net Yards per Attempt, defined as (Gross Passing Yards + 20 * TDs – 45 * INTs) divided by (Pass Attempts – Sack Yards Lost). Now a 4.07 league average ANY/A wasn’t high – the ’60s NFL saw an average ANY/A of 4.59 — but it wasn’t notably low, either. In fact, 1976 was a slightly better passing environment than the trailing five year average of 4.01. Then, 1977 happened: teams averaged just 3.55 ANY/A, the lowest mark in the NFL since 1953. This was a dramatic decline in passing production of 0.52 Adjusted Net Yards per Attempt.

Fast forward 40 years. In 2016, the league-wide ANY/A average was 6.22, a shade off of the 6.26 ANY/A average in 2015. In fact, 2014 (6.14 ANY/A), 2015 (6.26), and 2016 (6.22) are the three best passing seasons in NFL history. There was little reason to expect 2017 to be any different, but it was: the NFL average ANY/A dropped to 5.91 last season, a decline of 0.31 ANY/A. That was the single largest year-over-year decline since 1976-1977. [continue reading…]

{ 1 comment }

Former 49ers and Chiefs quarterback Alex Smith has a well-earned reputation for being overly conservative. Smith was known as a low-risk, low-reward passer for years: he avoided interceptions but took a ton of sacks and threw a lot of short, safe passes. In 2011 with the 49ers, he ranked 30th in average pass length; he didn’t have enough passes in 2012 to qualify, but in 2013 with the Chiefs, he ranked 36th in how far his average pass traveled. In 2014, he ranked 33rd, and he repeated that ranking in 2015. In 2016 he ranked 29th, before vaulting to 22nd last year.

From 2011 to 2017, Smith threw 43 interceptions but took an incredible 260 sacks! That means over the last seven seasons, Smith has been sacked over 6 times as often as he’d thrown an interception (6.05 to be precise). Among the 32 quarterbacks who have thrown the most passes since 2011, only three others have even a 4:1 sack:interception ratio. Two of them are two of the best quarterbacks in the NFL in Russell Wilson (4.4 to 1) and Aaron Rodgers (5.20 to 1).  And there are some extenuating circumstances in both cases.

Wilson has played behind terrible offensive lines and scrambles often, which inflates his sack rate. Rodgers has been arguably the best quarterback in the NFL over the last seven years and has a tiny interception rate, although taking too many sacks is a legitimate criticism of his game. But neither passer is a dink-and-dunk type: both rank in the top 8 in yards per completion since 2011 (Rodgers averaged 12.0 yards per completion, Wilson 12.2) while Smith ranked in the bottom 8 with an 11.2 average.

The fourth quarterback is Smith’s old teammate, Colin Kaepernick (5.70 to 1). Even as a young player, Kaepernick always took a lot of sacks, and like Wilson, his scrambling inflated his sack rate a bit. Kaepernick averaged 5.3 sacks for every interception in 2012, then 4.9 in 2013, 5.2 in 2014, 5.6 in 2015, before catapulting to 9.0 in 2016, a year that may have been influenced by his political stance. But even still, Kaepernick wasn’t really a great match for Smith because he averaged 12.1 yards per completion, the 6th-highest rate since 2012.

So over the last 7 years, it’s pretty clear that no quarterback embodied the risk-averse style of player quite like Smith. With a ton of sacks, not many interceptions, and a low yards per completion average, Smith was the most conservative passer in football.

But over the last three years, Tyrod Taylor has taken the crown. In fact, Taylor is more Alex Smith than even Alex Smith! I looked at the 32 quarterbacks with the most pass attempts since the start of the 2015 season. Among that group, Taylor ranks 2nd in interception rate at just 1.29%, but he also ranks last in sack rate at 9.1%! The scramble factor is an issue here — by scrambling when a play breaks down instead of throwing it away, Taylor’s sack rate isn’t quite as bad as it appears — but only two of the other 32 quarterbacks have a sack rate within even two percent of Taylor’s. [continue reading…]

{ 1 comment }

Yesterday, I posted the implied SRS ratings from the Vegas lines released this weekend covering the first 240 games of the season. This is one of my favorite exercises of the year — the Vegas ratings are a great tool to use a starting point for all sorts of projections — so I’ve decided to turn this into a two-part post.

Vegas does not include week 17 point spreads, but we can generate them based on the ratings we have now generated. And we can also perform a much more substantive strength of schedule calculation than the one you typically see. This year, the Arizona Cardinals have the toughest schedule in the league. The table below shows each team’s SOS for all 16 games in 2018:

Arizona’s road schedule is particularly brutal: the Cardinals are 6.5 point underdogs (yes, in large part because the Cardinals are expected to be bad) in every game on the road this year. [1]Aand while there’s no line out for the week 17 game in Seattle, the implied ratings tell us that the spread would probably be Seattle -6.5 or Seattle -7. In addition to tough road games against the Seahawks, Rams, and 49ers, Arizona has to visit the Chargers, Chiefs, Falcons, Packers, and Vikings!

Meanwhile, the Texans and Patriots have the two easiest schedules in the NFL. Both teams get the Jets, Dolphins, Bills, and Colts — six for New England, four for Houston of course — while the Texans also get home games against the Browns and Giants. In addition, the Patriots have just five games against top-14 teams, while the Texans have just four games against top-12 teams.

Oh, and don’t pay any attention to articles that claim that the Packers have the hardest schedule in the NFL in 2018. Yes, Green Bay’s opponents this year won 138 games in 2017, the most of any slate of opponents. But that includes games a bunch of games against teams who are expected to be worse than their 2017 record, like the 8-8 Cardinals, the 9-7 Bills, the 7-9 Redskins, and two games each against the 9-7 Lions (21st in the SRS) and 13-3 Vikings (3rd in the SRS). Green Bay’s schedule is actually easier than average — the Packers are road dogs to the Patriots, Rams, and Vikings, but are otherwise favored in every other game (it helps, of course, that the Packers are expected to be very good). Only six of the team’s 16 games are against teams with a positive SRS. [continue reading…]

References

References
1 Aand while there’s no line out for the week 17 game in Seattle, the implied ratings tell us that the spread would probably be Seattle -6.5 or Seattle -7.
{ 4 comments }