≡ Menu

Over the last week, the Browns have made four trades, putting a small dent in the team’s historic draft capital. Cleveland traded away the first pick in the third round, #65 overall, to Buffalo for QB Tyrod Taylor, and sent the 123rd pick (Carolina’s 4th round pick, acquired two years ago for punter Andy Lee) and a 2019 7th rounder to Miami for WR Jarvis Landry. Cleveland also sent rookie QB DeShone Kizer — fresh off the third 15-loss season in NFL history — to the Packers for CB Damarious Randall, while swapping 4th and 5th round picks (Cleveland sent the first picks in the 4th and 5th rounds, #101 and #138, in exchange for #114 and #150). And finally, the Browns sent DT Danny Shelton and the 159th pick (Kansas City’s 5th round pick, acquired when Cleveland sent the Chiefs OL Cameron Erving) to the Patriots for a 2019 3rd round choice.

Cleveland still holds the first pick in rounds 1, 2, 6, and 7 of the 2018 Draft, along with the Texans first round pick (#4 overall, courtesy of the Deshaun Watson trade), Texans second round pick (#35 overall, from the Brock Osweiler trade), the Eagles second round pick (#64, Carson Wentz), and lower picks in the fourth and fifth round after the Green Bay trade. [continue reading…]

{ 2 comments }

From 1994 to 2013, there were 37 quarterbacks drafted in the first round of the NFL draft who were *not* selected with the first overall pick. Why am I looking at those quarterbacks? Well, passers selected with the first overall pick are a special case, distinct from all other quarterbacks. The odds of success are much higher there than elsewhere, as you will soon find out.

And why those years? Well, it’s too early to grade the recent draft classes, and that arguably includes the 2014 class. But if we were to include the 2014 class, I suspect we would have three picks that go down as bad ones: Blake Bortles at #3, Johnny Manziel at #22, and Teddy Bridgewater at #32. We know that Manziel was a terrible pick, and the balance of the evidence suggests that Bortles (21-40 career record) and Bridgewater (28 starts in four years) have failed to live up to expectations. But to avoid debating those guys, I decided to look at the 20-year period ending just before the class of 2014.

How did those 37 quarterbacks fare?  A whopping 16 of them won fewer than 20 games in the NFL:

Jim Druckenmiller
Akili Smith
Cade McNown
Ryan Leaf
Brady Quinn
Brandon Weeden
EJ Manuel
Heath Shuler
Matt Leinart
Tim Tebow
Jake Locker
J.P. Losman
Patrick Ramsey
Blaine Gabbert
Christian Ponder
Robert Griffin

Another three — Joey Harrington, 26-50 (-24), Jason Campbell, 32-47 (-15), and Josh Freeman, 25-36 (-11) — lost at least ten more games than they won and never made a Pro Bowl. Another three — Vince Young, Kyle Boller, and Rex Grossman — had more interceptions than touchdowns and started for four or fewer seasons. Those three were busts, too, giving us 22 out of 37 picks that go down as clearly disappointing (59%).

There are seven quarterbacks (19%) who were clear hits, winning 20 more games than they lost:

Ben Roethlisberger, 135-63 (72)
Aaron Rodgers, 94-48 (46)
Donovan McNabb, 98-62 (36)
Matt Ryan, 95-63 (32)
Joe Flacco, 92-62 (30)
Steve McNair, 91-62 (29)
Philip Rivers, 106-86 (20)

That leaves eight quarterbacks. Byron Leftwich, Mark Sanchez, and Trent Dilfer could charitably be described as better than your average first round (non-first overall) quarterback, although Leftwich was a starter for just 3 seasons and Sanchez and Dilfer own two of the worst era-adjusted passer ratings of all time. If you include those three as disappointments, that brings the miss rate to just over two-thirds of all passers (25 out of 37).

So with 25 disappointments and 7 hits, that leaves a middle ground of 5 passers. Chad Pennington is your #8 quarterback: he’s the best of the rest, although he finished with a 44-37 record that keeps him far short of the +20 win club. After that, it’s dealer’s choice how you want to rank Ryan Tannehill, Daunte Culpepper, Kerry Collins, and Jay Cutler. But just know that two of those guys are in the top 10 of the 37 non-first overall first round quarterbacks from this 20-year sample.  The median expectation might be a guy like Campbell, while even the 67th percentile result could land you a Tannehill.

In short: if the quarterback isn’t the first overall pick, the odds are still pretty poor of landing a star.   The hit rate is about 20%.

{ 21 comments }

Postseason Rushing Leaders, By Year

Do you know who the leader in rushing yards in a single postseason?

Click Show for Answer Show


What about the rushing leader among players who played in only three postseason games?

Click Show for Answer Show


What about the rushing leader in the last 10 years in a postseason?

Click Show for Answer Show

[continue reading…]

{ 3 comments }

Over his four-year career, Jarvis Landry has a whopping 400 receptions, the most in NFL history for any player in his first four years. Now a member of the Browns after yesterday’s trade, what can we expect from him? Cleveland, of course, went 0-16 last year, which might actually be a good thing for Landry’s numbers. You see, over the course of his career, Landry has been much better in losses than wins.

Landry has averaged 69.4 receiving yards per game in losses, but that number drops by 13.4 yards per game in wins to just 56 yards per game. That’s a sizable discount, especially when most receivers average about five more yards per game in wins than losses.

The table below looks at all receivers over the last four seasons to average at least 50 receiving yards per game over more than 32 games, and with a sizable amount of games in both wins and losses (so no Patriots or Jaguars here). Take a look: [continue reading…]

{ 6 comments }

2017 Contest: 38 Questions in Review, Part II

Back in August, I asked you 38 questions that served as prop bets for the 2017 NFL season. Thanks to the tireless work of Jeremy De Shelter, who helped compile all the results. A couple of weeks ago, I looked at Part I. Let’s move on to Part II, beginning with the projected best and worst teams in the NFL…

Number of double digit wins by the Patriots
Number of double digit losses by the Browns

Cleveland lost 9 games by double digits in 2017, a year after losing 10 such games in 2016. It is still the 4th-most double digit losses by a Browns team since 1999. Meanwhile, New England won “only” 8 games by double digits last year, after winning 10 such games in 2016.

This was a lopsided bet in favor of the Patriots. 82% of you took the New England side, making this a big win for the minority.

Margin of victory for the Texans biggest win
Number of TD passes by the Texans TD passing leader

You might think that Deshaun Watson runs away with this if he stays healthy, as he led the team with 19 touchdown passes in 7 games. But he also led the team to a 43-point blowout of the Titans, so the margin of victory side easily won here. This was a close race, but 55% of you picked the Texans biggest win side.

Yards from scrimmage from the the leader of this group: Mike Gillislee, James White, Rex Burkhead, Dion Lewis
Yards from scrimmage from David Johnson in Arizona wins

Well, Johnson missed 15 games in 2017 due to injury, recording 91 yards from scrimmage in his lone win. The majority of you (57%) picked the Johnson side, but the Patriots side obviously won, as Lewis had 1,110 yards from scrimmage. If you knew that Lewis would lead with such a high number you might not have picked Johnson (who had less than 1,000 yards in Cardinals wins in 2016), so maybe this wasn’t just an easy win for the minority side.

Number of Receiving TDs by the player with the MOST in this group: Odell Beckham, A.J. Green, Jarvis Landry and Antonio Brown
Number of Receiving TDs combined by Pierre Garcon, Randall Cobb, and Adam Thielen

Another one of my favorite style of bets. A few months ago, you might have been shocked to learn that it was Landry (along with Brown) who led the first group in receiving touchdowns at 9 scores. On the other side, Garcon had a goose egg despite having 500 receiving yards, Cobb caught four touchdowns, and Thielen had a monster year with 1,216 yards but also had just four touchdowns. Make this question about receiving yards and it’s an easy win for the combined group, but when it comes to touchdowns, the Landry/Brown side pulled out the win.

That was an upset, as only 27% of you picked the first side.

Yards from scrimmage for Jordan Howard
Number of receiving yards by the Bears receiving yards leader, times two

Howard had 1,611 yards from scrimmage in 2016, and that dropped to 1,247 last year. The Bears had terrible receivers and finished last in the NFL in passing yards, though, which made this one of the closest races. Kendall Wright finished as Chicago’s leading receiver with 614 yards, so Group B loses this bet, 1247-1228. In the pre-season, 63% of you said that Group B would win, and I can’t blame you. But this was another upset win even with a down year from Howard.

Lowest Yards per reception by any of Tavon Austin, Danny Amendola and Larry Fitzgerald, times two
Highest Yards per reception from this group: DeSean Jackson, Kenny Stills, Martavis Bryant, Ted Ginn Jr., J.J. Nelson [No minimum]

Fitzgerald averaged 10.6 yards per reception, Amendola 10.8, and Austin 3.6! So the number to beat here was just 7.2 because of Austin. Nelson was at 17.5 all by himself, making this another win for the majority. A whopping 80% of you picked Group B, which would have been a loser if not for Austin’s 13-catch, 47-yard season. I’m not too sure how I feel about this one. The next one? That was a pretty interesting line that built in the idea of an injury that actually happened.

Number of wins by the Packers, -1.5
Number of interceptions thrown by Aaron Rodgers

From 2014-2016, Rodgers played in 48 games and averaged 7.3 interceptions per season while the Packers averaged 10.7 wins per year. So we had to subtract some wins from Green Bay to make this line interesting. Two thirds of you picked the Packers line in the preseason, thinking the 1.5-win hook wasn’t enough.

Rodgers was limited to 7 games and threw 6 interceptions. Green Bay went 7-9, which means Option A finished with 5.5 and Option B finished with 6. Score a nailbiter for the minority vote.

Lower number will be Tom Brady rank in passer rating, +1.5 [If Brady fails to throw 224 passes, this side loses]
Lower number will be Antonio Brown rank in receiving yards

Another fun line with two Hall of Famers. Brown led the NFL in receiving yards, while Brady ranked 3rd in passer rating. The lower number wins here, because Brady was the favorite. Even without the hook, Brown won this contest.

In the preseason, 63% picked the Brown side. Well done.

TDs scored (passing, rushing and receiving combined) by the player with the 4th most TDs among players in the NFC South, +4
TDs scored (passing, rushing and receiving combined) by the player with the 2nd most TDs among players from teams in California

This was as close as it got in the preseason, meaning this was a great line. The California side got 51% of the vote, with Philip Rivers or Derek Carr the likely runner up. As it turns out, Rivers had 28 TDs but he was the runner up because Jared Goff scored 29 (28 passing, 1 rushing); Carr finished with 22. In the NFC South, the question here was whether all four QBs would have big good enough years to win this with the 4 TD edge. Cam Newton had 28 TDs, Drew Brees had 25, and Matt Ryan and Jameis Winston each had 20. If Goff didn’t have a breakout season, the NFC South wins because of the +4 TD edge. Score one for California over the NFC South.

Games started by rookie quarterbacks, +0.5
Games started by QBs who will be 38 years old during this season (i.e., Brees, Palmer, McCown)

I loved this line in the pre-season. Brees had 16 starts, McCown 13, and Palmer 7, combining for 36 starts. But the rookies did well, at least when it came to starts: DeShone Kizer started 15 games, Mitch Trubisky started 12, and Deshaun Watson 6. That combines for 33 starts, which allowed C.J. Beathard (5) and Nathan Peterman (2) put the rookies over the edge. In the preseason, 76% of you picked the 38-year old quarterbacks, likely not counting on Kizer to start 15 games.

And the last one of the day…

Number of rushing TDs by the QB with the most rushing touchdowns
Number of 100-yard rushing games by Ezekiel Elliott, +0.5

Elliott had 5 games with 100 rushing yards, and the tiebreaker goes to Elliott. But alas, Cam rushed for 6 touchdowns, giving Option A the win. In the preseason, 59% of you picked the rushing TD side, knowing there was a chance that an Elliott suspension would tip the scales.

What stands out to you?

{ 4 comments }

There were three teams last season that overwhelmingly relied on one running back, and all three made the playoffs: the Chiefs with Kareem Hunt, the Steelers with Le’Veon Bell, and the Rams with Todd Gurley. Given the success the Jaguars had after drafting Leonard Fournette on the heels of the Cowboys revival after drafting Ezekiel Elliott, you might think that — combined with the sentence above — relying on one running back is trendy again.

But that’s the difference between anecdotes and data. The Bears were the fourth most “rely on one RB” team, and Chicago went 5-11. The Browns went 0-16 and were very Isaiah Crowell-heavy. And the Colts were the same with Frank Gore and it brought them a 4-12 record.

On the other side, both the Eagles and Patriots had three running backs finish with between 60 and 180 carries, and those teams met in the Super Bowl. The Seahawks didn’t exactly have a rushing game that you would envy, but no Seattle running back had even 70 carries and the team had a winning record.

Last year, I discussed the idea of rushing concentration indices. Let’s use Hunt as an example. He rushed for 1,327 yards, and all Chiefs running backs rushed for 1,462 yards. So Hunt rushed for 91% of all rushing yards produced by Kansas City running backs. To get the Chiefs RB rushing concentration index, we have to square that number, perform the same calculus for all Chiefs running backs, and sum the totals. For Hunt, squaring his percentage gets you 82%, and the tiny amount for all other Kansas City rushers brings us up to 83%.

On the other hand, we have Philadelphia. LeGarrette Blount had 43% of all Eagles rushing yards (square of that is 18%), Jay Ajayi had 23% (5%), Corey Clement had 18% (3%), Wendell Smallwood had 10% (1%), and Darren Sproles and Kenjon Barner each had three percent (0%). That gave the Eagles a RB rushing concentration index of 28%. That was the second lowest rate in the league. [continue reading…]

{ 8 comments }

Frank Gore is already #5 on the career rushing list, while Adrian Peterson is currently in 12th place (but two years younger). In recent months, I’ve compared Gore and Peterson, as their careers which have been both very similar and very different.  Both had severe knee injuries and might be the two best running backs to ever recover from ACL surgery, and both players are going to wind up very high on the career rushing list. Gore is now the favorite — surprisingly — to finish with more career rushing yards.  On the other hand, Gore is much more of a compiler and Peterson a shining star.  Gore ranks 34th in career rushing yards per game, while Peterson ranks 4th in that category.

So who do you prefer? The guy who ranks 5th in career rushing yards or 4th in career rushing yards per game?  Or, if you like, there’s LeSean McCoy. Gore and Peterson already have crossed the 12,000-yard mark, and McCoy is likely to do so as well; either way, they are the three active players with the most rushing yards, making them a natural source of comparison. And assuming McCoy gets there, they will also be the only three players from this era (not including Tomlinson or younger players) to hit the 12,000-yard mark.

McCoy’s highs weren’t as high as Peterson, but they were a little higher (two first-team All-Pro seasons, a third season as a top-three fantasy running back, six Pro Bowls in the last seven years) than Gore.  And his career volume probably won’t match Gore, but it will probably be higher than Peterson.  McCoy is currently 29th in career rushing yards and 22nd in career rushing yards per game.

Let’s compare the three players year-by-year, starting at age 21. [continue reading…]

{ 9 comments }

In one of the first posts at Football Perspective, back before the start of the 2012 season, I asked the question: who will lead the NFL in rushing from 2012 to 2021? At the time, the last seven running backs to lead the league in rushing over a 10-year period were LaDainian Tomlinson, Edgerrin James, Curtis Martin, Emmitt Smith, Barry Sanders, Eric Dickerson, and Walter Payton. That’s a pretty good list of the top running backs over the last 30 years, reinforcing how impressive it is to lead the league in rushing for a decade.

How did our predictions go? Well, see for yourself:

LeSean McCoy, Beanie Wells and DeMarco Murray all are entering their age 24 season, making them perhaps the best hope among the young runners with NFL experience. On the other hand, along with Richardson, Doug Martin, David Wilson, Ronnie Hillman and Lamar Miller made the 2012 draft strong at the position. In the NFC West, Isaiah Pead and Kendall Hunter (or LaMichael James) could be the future for their teams for the next decade. As always, it’s too early to say.

In the collegiate ranks, South Carolina’s Marcus Lattimore is expected to be the cream of the 2013 class, with Auburn transfer Michael Dyer and Wisconsin’s Montee Ball also in the mix. And based on past history, we can’t count out sophomores Malcolm Brown or De’Anthony Thomas. If you had to pick which player will lead the league in rushing yards from 2012 to 2021, Trent Richardson is the obvious choice. After him, I’d probably be pretty evenly split among McCoy, Martin and Lattimore.

Let’s just say that with the obvious exception of McCoy, those predictions don’t hold up super well in hindsight.  Which, by the way, is one of the main points of this post.  It’s really hard to figure out which running backs will turn into stars and which will wind up having nondescript careers.  Players like Hillman or Pead or Hunter  had flashes where you could squint and see a long career of success, while Martin had two seasons with 1400+ yards and (to date) no other seasons with even 500+ rushing yards.

Here are the actual leaders in rushing yards from 2012-to-2017; in other words, this is with 60% of the period done. [continue reading…]

{ 11 comments }

Where Will Kirk Cousins Sign?

A month ago, I took a look at the quarterback situation in the NFL. Most teams already have either a franchise-type quarterback or a quarterback on a cheap rookie contract. There are another five teams — the Dolphins, Giants, Bengals, Jaguars, and Ravens — that don’t really stand out as natural Cousins fits, either because of the cap hit of their current quarterback or that Cousins wouldn’t provide much of an upgrade, if any.

That leaves six teams — the Bills, Broncos, Browns, Jets, Vikings, and Cardinals — that are really looking for quarterbacks. Cleveland and New York have both a ton of cap space and a premium draft pick, which cuts both ways: either team can offer Cousins whatever money they want, or decide to not even enter the Cousins sweepstakes. The Cardinals don’t have much in the way of cap space or premium draft picks, making them the team wanting to add a franchise quarterback but without many resources. The Bills and Broncos have solid draft capital (Buffalo has two first round picks, Denver owns the fifth pick) but not a ton of salary cap room.

That leaves Minnesota as perhaps the team best positioned to add a quarterback just via free agency. The Vikings don’t have much draft capital but have enough salary cap space to offer Cousins a premium contract. Oh, but there’s just one problem: Minnesota had three quality quarterbacks in the locker room last year (Case Keenum, Teddy Bridgewater, and Sam Bradford), each of whom the team could justify building around in 2019.

So, where will Cousins go? Here are my thoughts.

Cleveland

Despite the most cap room of any team in football, this feels like a longshot. The Browns are not a win-now team and own the first and fourth picks in the draft. This should set Cleveland up to draft a quarterback to build for the future, rather than find a strong veteran passer (or find a veteran passer who isn’t Cousins).

Perhaps more importantly, what would cause Cousins to pick the Browns? Unless the money is significantly more than what other teams are offering, or there is an ability for Cousins to leave Cleveland after only a year or two, it doesn’t make much sense for the quarterback with the most leverage since Peyton Manning to have his choice of suitors and pick an 0-16 team. And given Cousins’ concerns with ownership in Washington, I wouldn’t be surprised if ownership in Cleveland was enough to write the team off his short list.

Buffalo

The Bills don’t have much to offer in the way of, well, much. Whether it’s cap space, skill position talent on offense, or location, Buffalo is going to rank close to last on the list for Cousins. If this turns into a beauty pageant, it’s hard to see Cousins choosing western New York. And I would suspect that the way the organization has treated Tyrod Taylor — who has had a similar Total QBR over the last three years to Cousins — won’t help the team’s cause.

Arizona

The Cardinals don’t have much cap space, but offer an upgrade in skill position talent (David Johnson, Larry Fitzgerald) and weather relative to Buffalo.  The Cardinals have a new coaching staff in place, with offensive coordinator Mike McCoy now working under new head coach Steve Wilks (formerly defensive coordinator in Carolina).  Arizona has the 15th pick and not much cap space, which means the team might be a more natural fit for drafting a quarterback.  We would presume that every team on this list (with the possible exception of the Bills) would offer more money to Cousins, but Arizona is a solid fit for Cousins if you, ya know, ignore money. [continue reading…]

{ 19 comments }

From ages 21 to 25, Larry Fitzgerald was remarkable. In NFL history, only Randy Moss had more receiving yards over a player’s first five years in his 20s, and only Moss averaged more yards per game (minimum 50 games). Fitzgerald had three seasons with 1400+ yards before turning 26; Moss had two, and nobody else has had more than one.

But then, Fitzgerald’s career declined during his prime years, making him somewhat like the wide receiver version of Ken Anderson. In the post-Kurt Warner/pre-Carson Palmer era, Fitzgerald’s numbers tanked save for one outlier season in 2011 due to remarkable yards after the catch numbers. During the six seasons from ages 26 to 31 — the prime seasons for most wide receivers — Fitzgerald hit the 1,200 yard mark just once, during that 2011 season.

Thought of another way, of Fitzgerald’s six best seasons by receiving yards, five of them came outside of the 26-31 window.  I looked at the 42 players with 10,000 receiving yards who have already played through their age 34 seasons.  I then calculated their average production in each year from age 21 to 34 (whether they played in the NFL or not), to set a baseline average for each season.  Then, I calculated their percentage of receiving yards at age X vs. their average level.  That is in black below.  I also included Fitzgerald’s production relative to his baseline in red and yellow.

As you can see, Fitzgerald was way more productive than even the average elite wide receiver in his early 20s. But at age 26 and 27 he was below-average, and then he was well below average at ages 29, 30, and 31. His production the last three years has been back in line with that of the average elite wide receiver, meaning he’s been right around his career average.

Here’s another way to think of it: Fitzgerald gained 6,176 receiving yards during his “prime years” from ages 26 to 31, and 7,180 in the three years before and after those prime years. From ‘2009 to 2014, Arizona ranked 26th in Net Yards per Attempt; meanwhile, from ’06 to ’08 the Cardinals ranked 6th in NY/A and then 12th over the last three years.

In some ways, this makes him similar to Charlie Joiner, who struggled during his prime years but etched out a Hall of Fame career. Fitzgerald is a better receiver than Joiner was, but if you start with a higher baseline, you can squint and see the career parallels.

The table below shows, for the 42 receivers identified above, their total receiving yards in their six prime seasons from age 26-31, their total receiving yards in the six surrounding seasons (SSS) from ages 23-25 and 32-34, and the difference. Only Joiner has a larger negative (i.e., better outside of his prime years) than Fitzgerald:

PlayerPrimeSSSDiff
Charlie Joiner+35354864-1329
Larry Fitzgerald61767180-1004
Anquan Boldin58426564-722
Isaac Bruce62556849-594
Irving Fryar46985249-551
Andre Reed+54405743-303
Joey Galloway41004401-301
Harold Jackson46394938-299
Jerry Rice+8201817625
Don Maynard+53555018337
Tony Gonzalez59245550374
Steve Largent+63065675631
Antonio Gates53294685644
Shannon Sharpe+49274264663
Art Monk+58415143698
Randy Moss+64585674784
Hines Ward61785278900
Stanley Morgan54364473963
Jason Witten581647451071
Andre Rison525841271131
James Lofton+623049151315
Steve Smith668853551333
Terrell Owens+721958511368
Cris Carter+650451001404
Henry Ellard666852271441
Andre Johnson730158231478
Lance Alworth+580342371566
Keyshawn Johnson612944421687
Gary Clark630345531750
Reggie Wayne749455691925
Donald Driver557634742102
Santana Moss614239852157
Muhsin Muhammad608638482238
Tim Brown+703643112725
Torry Holt807853042774
Keenan McCardell639333623031
Marvin Harrison+837053273043
Derrick Mason657934823097
Chad Johnson710239573145
Rod Smith660431683436
Jimmy Smith688732053682
Michael Irvin+771235384174
Average620549201285

Fitzgerald actually gained fewer receiving yards during the six prime seasons than the average receiver on this list, but he had the second-most receiving yards during the six surrounding seasons. Football Perspective favorite Joey Galloway also makes an appearance near the top of the list, which won’t surprise regular readers.

What stands out to you?

{ 5 comments }

From 2012 to 2014, Larry Fitzgerald averaged 55.1 receiving yards per game.  This period covered his age 29 to 31 seasons, and were the worst three seasons of his career since his rookie season.  It was reasonable, I think, to assume Fitzgerald was on the decline and possibly near the end of his career.   After all, he ranked 40th in the NFL in receiving yards per game during this period, and was about to enter his age 32 season.

During this same period, Randall Cobb averaged 72.3 receiving yards per game despite being just 22, 23, and 24 years old.  His career trajectory was seemed limitless: he averaged 64 receiving yards per game at age 22, 72 at age 23, and 80 receiving yards per game at age 24.

So from 2012 to 2014, an about-to-be-32-year-old-Fitzgerald averaged 55.1 receiving yards per game, and an about-to-be-25-year-old-Cobb averaged 72.3 receiving yards per game.  Cobb was about to enter his prime years, while Fitzgerald had just left his behind.  If there were odds on who would gain more receiving yards over the next three seasons, they would be heavily weighed in Cobb’s favor.

And yet, from 2015 to 2017, Fitzgerald ranked 12th in receiving yards per game at 70.7, while Cobb ranked 55th at 47.5 receiving yards per game. [continue reading…]

{ 1 comment }

Median Length of Rushing Touchdown (2017)

In 2017, Leonard Fournette rushed for 9 touchdowns this season, covering a total of 179 yards. His average rushing total, therefore, covered 19.9 yards. However, Fournette’s median length of rushing touchdown? That was just 2.0 yards. Fournette’s touchdown runs came from 90, 75, 5, 3, 2, 1, 1, 1, and 1 yard away.

Among players with at least 4 rushing touchdowns, Derrick Henry led the way with a median length of 17 yards; LeSean McCoy wasn’t too far behind at 14 yards.

The full data set below:

Total RkPlayerTDsYardsAvgMedianMedian Rk
1Leonard Fournette917919.9283
2Derrick Henry517134.21717.5
3Kareem Hunt817021.34.555.5
4Alvin Kamara814718.47.537
5Mark Ingram1213911.6370
6Bilal Powell513627.2283
7Melvin Gordon811414.31.591
8Kenyan Drake310936.3425
9LeSean McCoy610818.01421
10Marshawn Lynch710414.9370
11Todd Gurley131027.8283
12Orleans Darkwa510120.21108.5
13Cordarrelle Patterson29045.0454
14.5Jordan Howard9889.8833
14.5DeMarco Murray68814.72.577.5
16Aaron Jones47518.813.523
17Elijah McGuire16969.0691
18Chris Thompson26834.0347
19Jonathan Stewart66711.21.591
20Corey Grant26432.0328
21Matt Breida26331.531.59
22.5Marcus Mariota56212.4929
22.5Jerick McKinnon36220.7370
24.5T.J. Yeldon25929.529.510
24.5Alex Collins6599.87.537
26Austin Ekeler25628.02812
27Jalen Richard15252.0522
28Ezekiel Elliott7517.3283
29Deshaun Watson25025.02514
30Dak Prescott6498.21026
31Jay Ajayi14646.0463
32Latavius Murray8455.61.591
33Ty Montgomery34414.7646
34Devonta Freeman7436.11108.5
35Trey Edmunds14141.0416
36Cam Newton6386.3552.5
37D'Onta Foreman23718.518.515
38Le'Veon Bell9364.0370
39.5Charcandrick West23417.01717.5
39.5Duke Johnson4348.5740.5
42Isaiah Crowell23216.01619
42Corey Clement4328.07.537
42Dion Lewis6325.3646
44C.J. Anderson33110.3552.5
45Darrius Heyward-Bey12929.02911
46Adrian Peterson22814.01421
47Tavon Austin12727.02713
48.5Joe Mixon4266.5646
48.5Marlon Mack3268.7370
50.5Tevin Coleman5255.0370
50.5Carlos Hyde8253.11.591
52Theo Riddick3248.0460
53Frank Gore3237.7552.5
55Jacoby Brissett4225.5646
55Ameer Abdullah4225.55.549.5
55Kirk Cousins4225.54.555.5
57.5Javorius Allen4215.3552.5
57.5Rex Burkhead5214.2283
59Rod Smith4194.81.591
60.5Brock Osweiler11818.01816
60.5Blake Bortles2189.0929
62.5Tarik Cohen2168.0833
62.5C.J. Beathard3165.3460
64.5Brett Hundley2157.57.537
64.5Matt Forte2157.57.537
67Eli Manning11414.01421
67Giovani Bernard2147.0740.5
67Josh McCown5142.81108.5
70LeGarrette Blount2136.56.542.5
70DeAndre Washington2136.56.542.5
70Tyrod Taylor4133.31.591
72.5Jamaal Charles11212.01224.5
72.5Cameron Artis-Payne11212.01224.5
74Tion Green2115.55.549.5
76.5Brian Hoyer199.0929
76.5Jared Goff199.0929
76.5Case Keenum199.0929
76.5Lamar Miller393.0370
81Lance Dunbar188.0833
81Drew Brees284.0460
81Christian McCaffrey284.0460
81Mitchell Trubisky284.0460
81Mike Gillislee581.6283
84.5Jamaal Williams471.81108.5
84.5DeShone Kizer571.41108.5
87Devontae Booker166.0646
87Dalvin Cook263.0370
87Terrance West263.0370
89Elijhaa Penny252.52.577.5
91Kenjon Barner144.0460
91Stevan Ridley144.0460
91Peyton Barber341.31108.5
96Kerwynn Williams133.0370
96Malcolm Brown133.0370
96Jalston Fowler133.0370
96Wendell Smallwood133.0370
96Russell Wilson231.51.591
96Doug Martin331.01108.5
96Rob Kelley331.01108.5
101.5Vince Mayle122.0283
101.5Joe Flacco122.0283
101.5Alfred Blue122.0283
101.5Tommy Bohanon221.01108.5
113Mike Tolbert111.01108.5
113Trevor Siemian111.01108.5
113C.J. Ham111.01108.5
113Delanie Walker111.01108.5
113Jacquizz Rodgers111.01108.5
113Alex Smith111.01108.5
113Zach Zenner111.01108.5
113Chris Ivory111.01108.5
113Jamize Olawale111.01108.5
113Andre Ellington111.01108.5
113Samaje Perine111.01108.5
113Alfred Morris111.01108.5
113Andy Janovich111.01108.5
113Roosevelt Nix111.01108.5
113Jimmy Garoppolo111.01108.5
113Kyle Williams111.01108.5
113Anthony Sherman111.01108.5
113David Fales111.01108.5
113Jameis Winston111.01108.5

What do you think?

{ 2 comments }

Matt Forte, Bilal Powell, and Special Teams Yards

Matt Forte retired yesterday, but we will leave those thoughts for another post. Today, I want to look at what I’ve referred to before as special teams yards. What are those?

All yards gained on special teams are done outside of the context of the series (down and distance) environment that defines most games. A kickoff return from to the 30 or to the 40 represents a difference of 10 yards, but those 10 yards are not as valuable as the difference between a gain of 5 yards and 15 yards on 3rd-and-10. The former are, quite literally, special teams yards. They don’t provide any value in gaining any additional first downs, or keeping a drive alive.

Special teams yards, while obviously valuable, are — just as obviously — the least valuable yards possible.

On a 3rd-and-10, a 15-yard pass provides a significant amount of value by providing a first down. But let’s get a bit more precise: the first 10 of those yards were really valuable. The last 5? Well, those were special teams yards. The difference between gaining 10 yards and gaining 15 yards on 3rd-and-10 isn’t that significant: well, it’s about as significant as returning a kickoff for 30 yards or 35 yards. Those last 5 yards don’t help a team move the chains.

So all yards gained by a player after already picking up a first down are what I’m referring to as special teams yards. And you know what other yards are less meaningful? All yards on third down or fourth down (special teams yards can come on any down) that don’t pick up a first down. A 9-yard run on 3rd-and-15 are just like special teams yards, too.

So let’s call all yards gained after gaining a first down “Post-1D Yards” and all yards on 3rd or 4th down that don’t go for a first down “3D Fail Yards.” To be clear, I’m not saying that Post-1D Yards or 3D Fail Yards are meaningless, but they are akin to special teams yards because they don’t help move the chains. They are yards gained outside of the context of the goal of acquiring a new set of downs.

Now, let’s talk about Forte, who rushed 103 times for 381 yards last year, which equates to 3.70 YPC. His backfield teammate, Bilal Powell, rushed 139 times for 754 yards, a 4.34 YPC average. But Forte had almost no “special teams” yards: he had just 35 yards picked up after gaining a first down, and only 4 yards gained on failed third/fourth down rushes. If you eliminate those, his “net” yards per carry was 3.32.

As for Powell? He had runs of 41, 51, 57, and 75 yards, along with five other runs of at least 20 yards. Those contributed to the 267 Post-1D Yards that Powell had, which comprised a whopping 40% of his total rushing yards. That was the third highest percentage in the NFL (minimum 100 carries) behind only Kenyan Drake (41%) and Cam Newton (43%). Meanwhile, Forte had just 9% of his rushing yards come as Post-1D Yards, the lowest in the league (Jamaal Williams was second at 12%, followed by Doug Martin at 15%). And in addition, Powell had 4% of his yards come as 3D Fail Yards, compared to just 1% for Forte.

Add it up, and Powell’s “net” yards per carry after removing “special teams” yards was just 2.44, quite a bit behind Forte. The table below shows the full data set for all rushers with 100 carries in 2017:

RkPlayerTeamRshRshYdYPCYPC RkPost-1D YdsP1D Y/CP1DY / RYd3D Fail Yd3DF Y/CNet YPCDiff
1Alvin KamaraNOR1207286.0712572.1435.3%50.043.883.48
2Alfred MorrisDAL1165494.7371311.1323.9%10.013.593.19
3Dion LewisNWE1808964.9832521.4028.1%40.023.563.15
4Wayne GallmanNYG1114764.2917820.7417.2%40.043.513.11
5Matt BreidaSFO1054654.4310910.8719.6%140.133.433.03
6Matt ForteNYJ1033813.7036350.349.2%40.043.322.92
7Kareem HuntKAN27213284.8854421.6333.3%40.013.242.84
8Giovani BernardCIN1064594.3315950.9020.7%270.253.182.78
9Ezekiel ElliottDAL2429834.06222140.8821.8%80.033.142.74
10Le'Veon bellPIT32112904.02252720.8521.1%110.033.142.74
11Todd GurleyRAM27913034.6783921.4130.1%360.133.142.74
12Jamaal WilliamsGNB1535563.6339680.4412.2%120.083.112.71
13Christian McCaffreyCAR1174363.7334700.6016.1%50.043.092.68
14Alex CollinsRAV2129734.5993091.4631.8%100.053.082.68
15Lamar MillerHTX2398893.72351560.6517.5%40.023.052.65
16Marshawn LynchRAI2078904.30162561.2428.8%60.033.032.63
17C.J. AndersonDEN24510074.11212521.0325%130.053.032.63
18Peyton BarberTAM1084233.9227960.8922.7%00.003.032.63
19Devonta FreemanATL1968634.40122521.2929.2%180.093.032.62
20Mark IngramNOR23011244.8944041.7635.9%250.113.022.62
21Frank GoreCLT2499153.67381560.6317%70.033.022.62
22LeGarrette BlountPHI1737654.42112321.3430.3%130.083.012.60
23Mike GillisleeNWE1043833.6837690.6618%60.062.962.56
24Orleans DarkwaNYG1717514.39132441.4332.5%10.012.962.56
25Isaiah CrowellCLE2068534.14202361.1527.7%80.042.962.56
26Kerwynn WilliamsCRD1204263.5541720.6016.9%00.002.952.55
27Cam NewtonCAR1397545.4223222.3242.7%310.222.882.48
28Kenyan DrakeMIA1336484.8762672.0141.2%50.042.832.43
29Jay Ajayi2TM2088724.19192671.2830.6%170.082.832.43
30Leonard FournetteJAX26810413.88312851.0627.4%100.042.782.38
31Samaje PerineWAS1756043.45431140.6518.9%30.022.782.38
32Latavius MurrayMIN2168423.90282441.1329%50.022.752.34
33Joe MixonCIN1776243.53421310.7421%80.052.742.34
34Melvin GordonSDG28411053.89293121.1028.2%160.062.742.33
35Jordan HowardCHI27611204.06233541.2831.6%110.042.742.33
36Adrian Peterson2TM1565293.39451050.6719.8%00.002.722.32
37Carlos HydeSFO2399293.89302541.0627.3%280.122.712.31
38Javorius AllenRAV1545923.84321350.8822.8%410.272.702.30
39DeMarco MurrayOTI1846593.58401560.8523.7%90.052.682.28
40Derrick HenryOTI1767444.23182691.5336.2%30.022.682.28
41Jerick McKinnonMIN1515703.77331330.8823.3%370.252.652.25
42Tevin ColemanATL1566304.04242081.3333%130.082.622.22
43Jonathan StewartCAR1986803.43441620.8223.8%70.042.582.18
44Chris IvoryJAX1143823.3546730.6419.1%180.162.552.15
45LeSean McCoyBUF28711393.97263981.3934.9%210.072.512.11
46Doug MartinTAM1384062.9448600.4314.8%00.002.512.11
47Bilal PowellNYJ1787724.34143071.7239.8%310.172.442.04
48Ameer AbdullahDET1655523.35471580.9628.6%50.032.361.96

What stands out to you?

Two notes. The correlation coefficient between Net YPC and actual YPC is 0.61, which is pretty low considering about one-third of actual YPC comes from the elements we leave out of Net YPC (i.e., Post-1D Yds and 3D Fail Yards make up about 33% of total rushing yards). The correlation coefficient between yards per carry and Post-1st Down Yards is 0.66, which is a good reason why, in my opinion, yards per carry isn’t all that helpful in understanding team success.

{ 32 comments }

2017 Contest: 38 Questions in Review, Part I

Back in August, I asked you 38 questions that served as prop bets for the 2017 NFL season. Thanks to the tireless work of Jeremy De Shelter, who helped compile all the results, I am going to present the results over the rest of this week.

On average, the favorite for each question picked up 65% of the votes, which is in the ballpark of a good question (I think you want the split to be pretty close to 50/50, but with some exceptions to encourage risk-seeking behavior). Today: the first 13 questions.

Let’s begin.

Number of wins by the Saints
Number of wins by the Broncos

63% of you picked New Orleans to win this one. Football Perspective readers are pretty smart! The two teams each had 8 wins as the line set by Vegas, and the teams did in fact combine for 16 wins. But Denver went 5-11, while the Saints surprisingly went 11-5. Score this one for the majority.

Number of wins by the Ravens
Number of wins by the Lions

Baltimore received only 43% of the vote, despite having an over/under of 8.5 wins from Vegas compared to 7.5 for Detroit. So Football Perspective readers were pretty down on Baltimore or pretty high on the Lions. That insight turned out to be — well, correct, but not necessarily helpful. Both teams finished 9-7, in part because of a 44-20 victory in Baltimore by the Ravens over the Lions. The Ravens famously lost in the final minute of the regular season, but no matter: by contest rules, ties go to the team receiving fewer votes, so the 43% who backed Baltimore had this one clinched after week 16. [continue reading…]

{ 7 comments }

Rushing Yards over 50: 2017 Editon

A few years ago, I looked at the career leaders in rushing yards over 50 yards in a game. I like doing this because it helps remove less material games and places more of an emphasis on dominance. A player with 16 games of 70 rushing yards has 1,120 rushing yards but only 320 rushing yards over 50 yards per game. On the other hand, a player with 8 games of 25 rushing yards and 8 games of 95 rushing yards maybe was a backup for half the season; he would have only 960 rushing yards but 360 rushing yards over 50 yards per game.

One player who excels in this metric is Ezekiel Elliott, who obviously missed six games due to suspension and therefore ranked only 10th in rushing yards. But Elliott hit 80 or more yards in 9 of 10 games — in fact, he’s rushed for at least 80 yards in a remarkable 23 of 25 career games (and also did it in his sole playoff game) — which means he fares very well in this formulation. In fact, he ranks 4th by this metric, and was the only rusher in 2016 to have over half of his rushing yards come after already rushing for 50 yards in a game.

On the other side of things, you have players like Lamar Miller and Frank Gore. Miller ranked 16th in rushing yards with a respectable 888-yard season, but his season high was just 75 yards. He was a consistent player — in 11 of 16 games he rushed for between 50 and 65 yards — but in no way was he a dominant one. Gore had 961 rushing yards, good enough for 12th place, but he ranked only 23rd in rushing yards over 50. Gore had two big games in December to boost his numbers: but in the first 12 games of the season, Gore finished with between 34 and 62 rushing yards in 11 games. A very consistent runner, yes, but a dominant runner? No.

The full results below: [continue reading…]

{ 1 comment }

Analyzing Third Down Passes From 1997 to 2017

How has the NFL evolved when it comes to third down passing? Using the PFR Play Index, I looked at all passes on third downs in each season from 1997 to 2017 that met the following criteria:

  • The play came during the regular season.
  • The pass happened in the first three quarters of the game to minimize the effects of game situation, as 4th quarter passes may be different than passes earlier in the game (although that’s worth investigating, too!).
  • The team on offense was down by no more than 14 points or up by no more than 14 points, to again minimize the effects of game situation.
  • The distance was between 5 and 10 yards to go, to isolate obvious passing situations but not hopeless ones.

What were the results? What do you *think* the results would be? [continue reading…]

{ 12 comments }

The Cleveland Browns own the #1 and #4 selections in the 2017 Draft. Assuming the Browns don’t trade down, it means the franchise would be the first team to own two top-5 picks in the Draft since…. well, do you know?

Trivia hint 1 Show


Trivia hint 2 Show


Trivia hint 3 Show
[continue reading…]

{ 0 comments }

2017 Fantasy Rankings: Team Defense

This week at Football Perspective: an analysis of the 2017 fantasy results. For team defenses, I used the following formula:

  • Fumble recoveries and interceptions are each worth +3.
  • Sacks are worth +1.
  • Safeties are worth +5.
  • Defensive/Special Teams TDs are worth +6.

For points allowed and yards allowed, I used the following:

Points Allowed 0-0 15
Points Allowed 1-7 10
Points Allowed 8-14 5
Points Allowed 15-21 1
Points Allowed 31-99 -5

Yards Allowed 0-199 15
Yards Allowed 200-299 7
Yards Allowed 300-499 0
Yards Allowed 500-999 -5

Below are the fantasy rankings for team defenses in 2017. Note that these results exclude week 17, so the per-game numbers are over 15 games. [continue reading…]

{ 0 comments }

2017 Fantasy Rankings: Tight Ends

Gronk was the top TE of 2017.

This week at Football Perspective: an analysis of the 2017 fantasy results. I will be using the same methodology throughout this series.

  • To calculate fantasy points, I will be using the following system: 1 point per 20 yards passing, 5 points per passing TD, -2 points per INT, 1 point per 10 yards rushing/receiving, 6 points per rushing/receiving touchdown, and 0.5 points per reception.
  • To measure fantasy production, I will be using VBD, which stands for Value Based Drafting. For players who play a full 16-game schedule, the formula is easy: you begin with each player’s fantasy points, and then subtract from that number the baseline at that position. For QBs and TEs, the baseline is the player with the 12th most fantasy points at the position. For RBs, it’s RB24, and for WRs, the baseline is WR30. For players who missed time, I give them some credit for those missed games under the assumption that a fantasy player would put another player into their lineup if that player was out. So for every game a QB/TE misses, he gets the FP/G of QB18 or TE18, as applicable; for RBs, I used RB30 as replacement, and for WRs, I used WR36. If a player missed more than 10 games, he was excluded entirely, but if he played in at least 6 games, he was included.
  • For players who finish below the baseline (i.e., would have negative VBD), I’m ranking them based on fantasy points per game. I’m not too concerned by this, and if you have another preference, that’s perfectly fine. I thought it would simply be the easiest way to present the data.

Below are the fantasy rankings for tight ends in 2017. [continue reading…]

{ 1 comment }

2017 Fantasy Rankings: Wide Receivers

Brown was the top wide receiver of 2017.

This week at Football Perspective: an analysis of the 2017 fantasy results. I will be using the same methodology throughout this series.

  • To calculate fantasy points, I will be using the following system: 1 point per 20 yards passing, 5 points per passing TD, -2 points per INT, 1 point per 10 yards rushing/receiving, 6 points per rushing/receiving touchdown, and 0.5 points per reception.
  • To measure fantasy production, I will be using VBD, which stands for Value Based Drafting. For players who play a full 16-game schedule, the formula is easy: you begin with each player’s fantasy points, and then subtract from that number the baseline at that position. For QBs and TEs, the baseline is the player with the 12th most fantasy points at the position. For RBs, it’s RB24, and for WRs, the baseline is WR30. For players who missed time, I give them some credit for those missed games under the assumption that a fantasy player would put another player into their lineup if that player was out. So for every game a QB/TE misses, he gets the FP/G of QB18 or TE18, as applicable; for RBs, I used RB30 as replacement, and for WRs, I used WR36. If a player missed more than 10 games, he was excluded entirely, but if he played in at least 6 games, he was included.
  • For players who finish below the baseline (i.e., would have negative VBD), I’m ranking them based on fantasy points per game. I’m not too concerned by this, and if you have another preference, that’s perfectly fine. I thought it would simply be the easiest way to present the data.

Below are the fantasy rankings for wide receivers in 2017. [continue reading…]

{ 0 comments }

2017 Fantasy Rankings: Running Backs

Kamara was the surprise star at running back in 2017.

This week at Football Perspective: an analysis of the 2017 fantasy results. I will be using the same methodology throughout this series.

  • To calculate fantasy points, I will be using the following system: 1 point per 20 yards passing, 5 points per passing TD, -2 points per INT, 1 point per 10 yards rushing/receiving, 6 points per rushing/receiving touchdown, and 0.5 points per reception.
  • To measure fantasy production, I will be using VBD, which stands for Value Based Drafting. For players who play a full 16-game schedule, the formula is easy: you begin with each player’s fantasy points, and then subtract from that number the baseline at that position. For QBs and TEs, the baseline is the player with the 12th most fantasy points at the position. For RBs, it’s RB24, and for WRs, the baseline is WR30. For players who missed time, I give them some credit for those missed games under the assumption that a fantasy player would put another player into their lineup if that player was out. So for every game a QB/TE misses, he gets the FP/G of QB18 or TE18, as applicable; for RBs, I used RB30 as replacement, and for WRs, I used WR36. If a player missed more than 10 games, he was excluded entirely, but if he played in at least 6 games, he was included.
  • For players who finish below the baseline (i.e., would have negative VBD), I’m ranking them based on fantasy points per game. I’m not too concerned by this, and if you have another preference, that’s perfectly fine. I thought it would simply be the easiest way to present the data.

Below are the fantasy rankings for running backs in 2017. [continue reading…]

{ 4 comments }

2017 Fantasy Rankings: Quarterbacks

Wilson was #1 in 2017.

This week at Football Perspective: an analysis of the 2017 fantasy results. I will be using the same methodology throughout this series.

  • To calculate fantasy points, I will be using the following system: 1 point per 20 yards passing, 5 points per passing TD, -2 points per INT, 1 point per 10 yards rushing/receiving, 6 points per rushing/receiving touchdown, and 0.5 points per reception.
  • To measure fantasy production, I will be using VBD, which stands for Value Based Drafting. For players who play a full 16-game schedule, the formula is easy: you begin with each player’s fantasy points, and then subtract from that number the baseline at that position. For QBs and TEs, the baseline is the player with the 12th most fantasy points at the position. For RBs, it’s RB24, and for WRs, the baseline is WR30. For players who missed time, I give them some credit for those missed games under the assumption that a fantasy player would put another player into their lineup if that player was out. So for every game a QB/TE misses, he gets the FP/G of QB18 or TE18, as applicable; for RBs, I used RB30 as replacement, and for WRs, I used WR36. If a player missed more than 10 games, he was excluded entirely, but if he played in at least 6 games, he was included.
  • For players who finish below the baseline (i.e., would have negative VBD), I’m ranking them based on fantasy points per game. I’m not too concerned by this, and if you have another preference, that’s perfectly fine. I thought it would simply be the easiest way to present the data.

Below are the fantasy rankings for quarterbacks in 2017. [continue reading…]

{ 3 comments }

Today’s guest post comes from Miles Wray, a long-time reader of the site. He’s written an interesting post on special teams today, but you may know him as the host of the daily NBA podcast The 82 Review. You can also find him on Twitter @mileswray. What follows are Miles’ words: as always, we thank our guest writers for their contributions.


As Chase noted in December, the Seahawks’ Russell Wilson had an opportunity to be just the fifth quarterback to lead his NFL team in rushing yards — an accomplishment that even Michael Vick can’t claim. In the final weeks of the season, Wilson absolutely coasted home with this dubious title belt: he racked up 586 rushing yards, the second-highest total in his career.

That historically rare achievement may mask the historically unprecedented scenario in Seattle’s running backs room. Since the NFL schedule expanded to 16 games in 1978, there had only been six previous times when, at the end of the regular season, a team’s leading running back or fullback finished with less than 350 total yards. [1]Excluding strike-shortened seasons. But in all six of those other cases, that leading rusher still managed to top 300 yards on the season. Well, nobody in Seattle got past 250 this year:

[continue reading…]

References

References
1 Excluding strike-shortened seasons.
{ 5 comments }

13 Points > 14 Points, Part IV

Over the last three days, I have been writing about the fact that points scored isn’t linearly correlated with winning percentage.  In fact, there are a few bumps, and it relates to field goals vs. touchdowns.  As we’ve learned:

  • Not only is scoring 13 points better than scoring 14 points, but scoring 9 points is better than 14 points.
  • This works for increments on 7, too: 16 is better than 21, 23 is better than 28, and 30 is better than 35, too.

What I thought was the next natural question: do yards and yards allowed follow a similar pattern?

The graph below shows, in blue, the average number of yards gained for teams based on their points scored (on the X-Axis).  In addition, in orange, I’ve shown the average number of yards allowed.  As before, I put a red dot (on the blue line) for 7, 14, 21, 28, 35, 42, 48, and 56 points.  And wouldn’t you know: there is, in fact, a small dip in yards gained at these levels: teams that score 13 points gain more yards than teams that score 14 points, and that holds true at 20/21, 27/28, 34/35, and 41/42. [continue reading…]

{ 2 comments }

13 Points > 14 Points, Part III

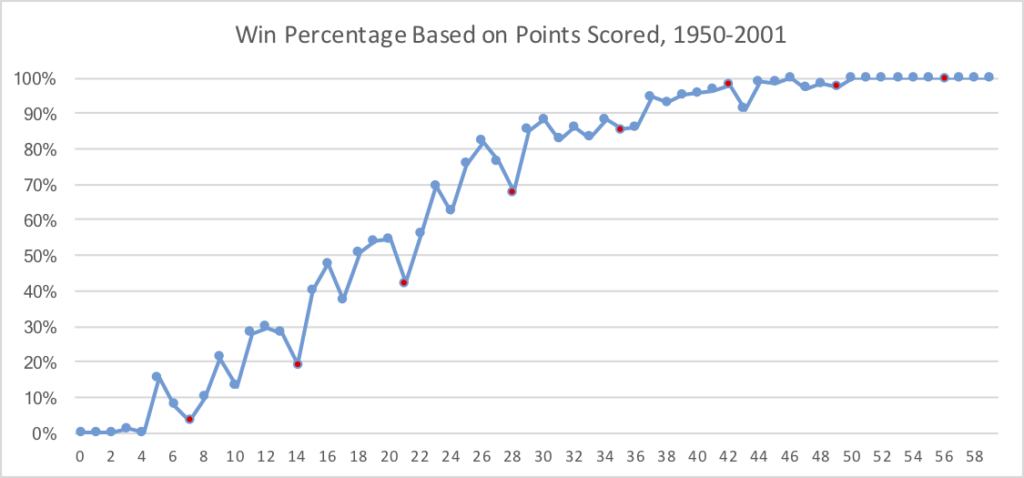
Over the last two days, I’ve looked at the football oddity that teams that score 13 points had a better winning percentage than teams that scored 14 points.  Today, let’s look at the winning percentage for all points scored.

That’s what the graph below shows: the winning percentage, based on points scored, for all points scored totals from zero to sixty.  To make it a little easier to follow, I’ve colored in red the multiples of 7; as you can see, those numbers (7, 14, 21, and 28) also represent dips in the graph.  What’s interesting is that three field goals is better than two touchdowns across a number of multiples. For example, scoring 9 points is better than scoring 14 points, scoring 16 points is better than 21 points, scoring 23 points is even better than scoring 28 points, and scoring 30 points is better than 35 points.  Take a look:

[continue reading…]

{ 8 comments }

13 Points > 14 Points, Part II

Yesterday, I wrote about the peculiar bit of trivia that teams scoring exactly 13 points win more frequently than teams scoring exactly 14 points. There were some great comments in those posts, and today, I want to get a little more granular with the data.

From 1999 to 2016, there were 462 games where a team scored exactly 13 points by two field goals and one touchdown, and 382 games where a team scored exactly 14 points by two touchdowns and two extra points. Note: the data set in today’s post is limited to 13-point games with 2 FG + 1 TD and 14-point games with 2 TDs (and 2 XPs); all other avenues to 13 or 14 points were discarded. In the 13-point games, teams won 26.2% of the time and allowed 19.7 points; in the 14 point games, teams won 14.1% of the time and allowed 24.8 points.

So the 13-point scoring teams allowed 5 fewer points per game than the 14-point scoring teams, which of course explains why they have a better record.  What about when those scores occurred? On average, the 13-point scoring teams produced their three scores at 15.6 minutes, 31.7 minutes, and 47.4 minutes of game play — in other words, early 2nd quarter, early 3rd quarter, and early 4th quarter. Meanwhile, the 14-point scoring teams scored at the 22-minute mark and the 43-minute mark, or midway through the 2nd quarter and at the end of the 3rd quarter.

Does that mean anything? I’m not so sure.  So instead, let’s break things into 5-minute buckets.  How early into the game did these teams first score?

The 13-point teams produced their first score in the first quarter in 53% of games; conversely, the 14-point teams only scored in the 1st quarter in 36% of games.  In 83% of games, the 13-point scoring teams had scored by the 25-minute mark, compared to just 60% of 14-point scoring teams.  Of course, the 13-point scoring teams are often scoring field goals, while the 14-point scoring teams are only scoring touchdowns.

What about their second scores?  For 13-point scoring teams, a whopping one-third of teams scored for the second time in the final 5 minutes of the first half.   For the 14-point scoring teams, 41% of those teams were at 7 points until the final 10 minutes of the game, with 25% stuck at 7 until the final 5 minutes.

Teams that scored 14 points but had their second touchdown come in the final 10 minutes went 20-136, for a 12.8% winning percentage. That dropped to 10.5% — a 10-85 record — when the second score came in the final 5 minutes.

Finally, what about the field goal kicking teams? When did their third score occur?

There were also 9 games where the 13-point scoring team scored in overtime, which were all wins.  But teams also won 35.8% of games where the third field goal came in the final five minutes of regulation, for a 49-88 record.

There’s some evidence that time of possession plays a factor in the 13 vs. 14 phenomenon, and it’s possible (although I am not particularly persuaded) that scoring on three drives may have some marginal benefit above scoring on two drives. But for the most part, I think this phenomenon is the result of survivorship bias.  Teams that score a field goal late are often going to win games, even (especially!) if they don’t score a lot of points overall.

{ 4 comments }

Back in November 2006 (I have been writing on the internet for too long!), I wrote that teams that scored 13 points had a better winning percentage than teams that had scored 14 points. That post was in response to an insightful eye from regular commenter Bill M., who first noticed the discrepancy. A few days later, Doug expounded on the topic, and came up with a couple of possible explanations.

As it turns out, this phenomenon still hold. From 1970 to 2017 (postseason included), teams that scored exactly 13 points in a game have a 308-871-10 record, for a winning percentage of .263. Over that same period, teams that scored 14 points went just 221-991-4, which translates to a .183 winning percentage.

Are you wondering if this is a relic of an older era? Well, over the last 10 seasons, teams that scored exactly 13 points went 44-206-2 (.179), while teams that scored 14 points went 26-181-0 (.126). In addition, since 2008, teams that scored 20 points (13 + a touchdown) have a 147-221 record (.399), which is a lot better than teams that scored exactly 21 points (14 + a touchdown), who have an ugly 50-117 mark (.299). The same rule holds even more strongly for 27 points (228-80-2, for a .739 winning percentage) vs. 28 points (88-58, or .603).

So, what gives? Let’s stick to the 13 and 14 point situations and begin with an experiment. There have been 138 games from 1970 to 2017 that ended in a score of 13-10. Knowing that, how many games do you think had a final score of 14-10?

I’ll give you the answer in moment, but let’s start with the obvious note: despite the small number of games that end in a 14-13 score, we know that teams that score exactly 13 points win more games than teams that score exactly 14 points. This means, of course, that teams that score 13 points must hold opponents to under 13 points at a higher rate than teams that score 14 points hold opponents to under 14 points, because #math. It’s true that, on average, teams that score 13 points allow fewer points – for whatever reason – than teams that score 14 points. Does that help inform your guess?

As it turns out, just 52 games have ended in a 14-10 final score. Such a result is so rare that in the last 5 years, it’s happened just once: in a Dolphins/Rams game that was 10-0 with 5 minutes left and 10-7 with one minute remaining. So while it’s a tautology, what’s driving this weird result is that teams score 13 points allow fewer points than teams that score 14 points.

Is there something special about 13 points relative to 14 points that’s driving that result? If so, presumably it’s related to 13 points being most often resulting from a touchdown and two field goals, while 14 points typically coming from two touchdowns. Therefore, I looked at all games where teams scored exactly 13 or 14 points by only one way for each score: two field goals, one touchdown, and an extra point, or two touchdowns with two extra points.

In those cases, from 1970-2016 (I don’t have 2017 data incorporated yet), teams that have kicked two field goals and scored one touchdown (with one extra point) are 291-722-10 in 1,023 games, for a 0.289 winning percentage. Meanwhile, teams that scored two touchdowns and two extra points and nothing else went 213-942-4 in 1,159 games, for a 0.186 winning percentage.

The graph below shows the points allowed by teams in these situations on a percentage basis. For example, when teams score 13 points by one touchdown and two field goals, they have allowed just 10 points about 13% of the time; conversely, teams that score 14 points from 7+7 allow only 10 points about 4% of the time.

Teams that score 13 points are much more likely to allow just 3, 7, or 10 points.

So what’s going on here? Part of it, I think, is that teams down 31-7, they aren’t going to kick a field goal late in the game, but if the score is 10-10, they will attempt a field goal.

What do you think? What other studies would you want to run?

{ 27 comments }

A pair of Valentine’s Day babies

There have been 45 quarterbacks in NFL history to throw for at least 30,000 yards. I write about this nearly every year, as not much changes. Three of them — Drew Bledsoe (born February 14, 1972), Jim Kelly (2/14/1960), and Steve McNair (2/14/1973) — were all born on February 14th.

If we drop the cut-off to 16,000 yards, we jump to 139 quarterbacks but get to include David Garrard, another Valentine’s Day baby (1978). But wait, there’s more: If we drop the threshold to 3,500 passing yards, we get to include Patrick Ramsey and Anthony Wright. Those guys may not impress you, but consider that only 337 players have thrown for 3,500 yards. That means dozens of days have zero quarterbacks with 3,500 yards — including New Year’s Day, another February holiday (Groundhog Day), Cinco De Mayo, Halloween, and Christmas Eve — so slotting in Ramsey and Wright as QB5 and QB6 on your birthday dream team is pretty damn good. [continue reading…]

{ 5 comments }

Yesterday, I looked at coordinators who immediately left Super Bowl champions to become head coaches. Today, I expand on that study by looking at the 50 offensive/defensive coordinators on the 25 Super Bowl champions from 1992 to 2016 and tracking the remainder of their tenures.  Let’s leave Josh McDaniels (2014/2016 Patriots offensive coordinator) out of the mix, since it appears as though he’s doing to be in New England for the foreseeable future.  What about the other 48? When did they finally leave?

Left Immediately (7)

Charlie Weis (2004 NWE OC)
Romeo Crennel (2004 NWE DC)
Mike Martz (1999 STL OC)
Mike Shanahan (1994 SFO OC)
Ray Rhodes (1994 SFO DC)
Norv Turner (1993 DAL OC)
Dave Wannstedt (1992 DAL DC)

In this group, 5 left to become head coaches of other NFL teams, Martz was promoted to Rams HC, and Weis left to become the Notre Dame head coach.

Left After One Additional Year (14)

Matt Patricia (2016 NWE DC)
Rick Dennison (2015 DEN OC)
Wade Phillips (2015 DEN DC)
Dan Quinn (2013 SEA DC)
Jim Caldwell (2012 BAL OC)
Joe Philbin (2010 GNB OC)
Steve Spagnuolo (2007 NYG DC)
Ken Whisenhunt (2005 PIT OC)
Charlie Weis (2003 NWE OC)
Romeo Crennel (2003 NWE DC)
Marvin Lewis (2000 BAL DC)
Peter Giunta (1999 STL DC)
Butch Davis (1993 DAL DC)
Norv Turner (1992 DAL OC)

Eight of these coordinators left to become head coaches after one more season as a coordinator (Patricia, Quinn, Caldwell, Philbin, Spagnuolo, Whisenhunt, Crennel, and Turner). What about the other 6?

  • Dennison and Phillips were both let go as part of the coaching change from Gary Kubiak (retired) to Vance Joseph a year after winning the Super Bowl. Both resurfaced on playoff teams in 2017 (Bills and Rams).
  • Weis, as mentioned above, left to join the Fighting Irish.
  • Lewis had his contract expire with the Ravens after 2001, as everyone assumed he would leave to get a head coaching job; that didn’t happen, so he had a one-year pit stop as the Redskins defensive coordinator before becoming the Bengals coach indefinitely.
  • Giunta was fired after the Rams defense collapsed in 2000.
  • Davis left to become the Miami Hurricanes head coach, and later, the Cleveland Browns head coach.

Left After Two Years (6)

Going all the way to the Super Bowl can sometimes work against a coach, as it may have with Lewis, or McDaniels or Patricia in the past. Returning to the same team is the norm, but if you are still on the same team two years later, you may not be head coaching material. None of these six left to become head coaches in the NFL:

Kevin Gilbride (2011 NYG OC)
Gregg Williams (2009 NOR DC)
Ron Meeks (2006 IND DC)
Greg Robinson (1998 DEN DC)
Fritz Shurmur (1996 GNB DC)
Ernie Zampese (1995 DAL OC)

  • Gilbride was retired/fired after the Giants offense declined after the Super Bowl run.
  • Williams had his contract “expire” after the Saints defense collapsed, amid other issues; he resurfaced as the Rams DC for about a month before being suspended for his role in BountyGate (i.e., the other issues).
  • Meeks “resigned” — noticing a trend here? — with the Colts after the ’08 season, but was hired as the Panthers defensive coordinator one week later.
  • Robinson was fired after the Broncos defense bottomed out in 2000. He went to the Chiefs in 2001, who would not become known for their defense.
  • Shurmur, who had a reputation as a defensive genius, left the Packers after the ’98 season to join Mike Holmgren in Seattle. Tragically, Shurmur never coached a game with the Seahawks, passing away of liver cancer that August.
  • Zampese was fired along with Barry Switzer after the 1997 season to make room for offensive-minded head coach Chan Gailey.

Three More Years (8)

Matt Patricia (2014 NWE DC)
Perry Fewell (2011 NYG DC)
Bruce Arians (2008 PIT OC)
Tom Moore (2006 IND OC)
Charlie Weis (2001 NWE OC)
Romeo Crennel (2001 NWE DC)
Greg Robinson (1997 DEN DC)
Sherman Lewis (1996 GNB OC)

Patricia, Crennel, and Weis stayed with the Patriots after winning the Super Bowl, winning another Super Bowl two years later, and making a third Super Bowl the next season, before ultimately all leaving for head coaching jobs. The other five?

  • Fewell lasted just one more year than Gilbride, as the Giants defense continued to disappoint year after year under Fewell.
  • Arians was retired/fired by the Steelers after 2011, and that’s when his career took off.  He joined the Colts as offensive coordinator but became head coach after Chuck Pagano stepped aside to battle a cancer diagnosis.  Arians would go on to win two AP Coach of the Year awards, in both 2012 and 2014.
  • Moore slowly transitioned from OC to senior offensive consultant with the Colts.  After the 2009 season, the 71-year-old Moore gave up those duties to Clyde Christensen, and Moore left the Colts after 2010 (he worked with the Jets in 2011, the Titans in 2012, and the Cardinals from 2014 to 2017, so he wasn’t question ready to retire).
  • Robinson, as mentioned above was fired three years after the ’97 Broncos won the title (and two years after the ’98 Broncos).
  • After Holmgren left the Packers in ’98, Ray Rhodes was brought in to replace him.  Lewis, the offensive coordinator, stuck around under the defensive-minded Rhodes, but both were gone when Green Bay brought in Mike Sherman (who was Holmgren’s OC in Seattle in ’99) as head coach in 2000. Lewis went on to the Vikings, but lasted just two years in Minnesota.

Four More Years (3)

Darrell Bevell (2013 SEA OC)
Matt Cavanaugh (2000 BAL OC)
Dave Campo (1995 DAL DC)

Bevell made it back to another Super Bowl with the Seahawks in 2014, but a questionable playcall at the end of that game — do you remember it? — has haunted his tenure ever since.  He was finally relieved of his offensive coordinator duties at the end of the 2017 season, and remains a free agent.

Cavanaugh was the offensive coordinator for one of the worst offenses to ever win a Super Bowl. Baltimore’s offense didn’t do any better from ’01 to ’04, and eventually, Cavanaugh was fired by the Ravens.  After the season, he got a job as offensive coordinator from the Pittsburgh Panthers under Wannstedt, giving the ’05 to ’08 Pitt Panthers two men who won Super Bowl rings as coordinators.  In their first year, Wannstedt and Cavanaugh announced that sophomore Tyler Palko had won the starting quarterback job, causing the backup quarterback to transfer.  The Ravens couldn’t have picked a better time to fire Cavanugh, as that backup quarterback was Joe Flacco.

Campo is the big outlier here.  He won the Super Bowl as the Cowboys defensive coordinator in ’95, stayed on post-Switzer under the offensive-minded Gailey, and then was named the Dallas head coach for the ’00 season as a way to try to return to the glory days in Texas. The Cowboys went 5-11 in each of his three seasons as head coach.

Five More Years (1)

Dean Pees (2012 BAL DC)

Pees lasted for five more seasons with the Ravens, but was retired/fired.  He came out of a month long retirement a couple of weeks ago to become the 2018 Titans defensive coordinator.

Six More Years (4)

Dick LeBeau (2008 PIT DC)
Kevin Gilbride (2007 NYG OC)
Bill Muir (2002 TAM OC)
Monte Kiffin (2002 TAM DC)

LeBeau lasted forever in Pittsburgh, but after winning his second Super Bowl with the Steelers in 2008, the defense gradually began to decline.  By 2014, Pittsburgh ranked 18th in both points and yards allowed, and LeBeau resigned after the season (and joined the Titans one month later).

Gilbride got a reprieve by winning another Super Bowl with the Giants in 2011, but as noted above, the offensive decline by 2013 eventually did him in.

Muir and Kiffin lasted as long as Jon Gruden did in Tampa Bay, lasting through the collapse at the end of the 2008 season.  But if their post-Gruden career was the same, their pre-Gruden career couldn’t have been any different.  Kiffin was the famed defensive coordinator who was 62 when Gruden arrived: he was extraordinarily well-respected but never given a serious look at a head coaching job because of his age (he would later join the Cowboys as defensive coordinator at 73 years old in 2013). Muir? Well, he had an even more unusual history.

Seven More Years (2)

Dom Capers (2010 GNB DC)
Gary Kubiak (1998 DEN OC)

Capers and the Packers won the Super Bowl in 2010 with a defense that ranked in the top 5 in both points allowed and yards allowed. The Packers never again ranked in the top 10 under Capers, and after the pass defense ranked in the bottom five in NY/A in both 2016 and 2017, Capers was finally fired on New Years day, 2018.

Kubiak left to become a head coach, which only happened after the Broncos finally won a playoff game again in 2005. Under Kubiak, Denver won the Super Bowl in ’97 and ’98, ranking in the top 3 in both points and yards both years. The Broncos did that in 2000, too, but Kubiak wasn’t able to land a head coaching job.  In fact, after the ’00 season, he interviewed with the expansion Houston Texans, but didn’t get the offer. The Broncos offense regresesd in ’01, but he had four more strong years under Shanahan from ’02 to ’05. But after not winning a postseason game from ’99 to ’04, Denver and Kubiak rebounded in ’05, going 13-3 and earning the 2 seed in the AFC.  After the season, he interviewed for the Texans job — and this time, he got it.

Eight (2)

Gary Kubiak (1997 DEN OC)
Pete Carmichael (2009 NOR OC)

Kubiak, of course, is on here because he won titles in both ’97 and ’98.

Carmichael? Well, he’s soon about to join the next list: all indications are that he will be back in 2018, which would make for 9 straight years as the Saints offensive coordinator after winning the Super Bowl.  Perhaps, like Kubiak, working for a head coach with a reputation as an offensive guru has hurt Carmichael, along with the whole Hall of Fame quarterback thing, too.  One could argue that Weis and Bill O’Brien with Brady, Joe Philbin with Rodgers, and Adam Gase with Manning haven’t helped his cause in that regard, as none have had magic touches at quarterback after getting jobs with new teams. But Carmichael is about to enter his 10th season with the Saints, and in his first nine, the Saints rank 1st in yards, 1st in yards per play, and 2nd in points. He’s always been talked about, but never given a serious look, perhaps because he’s viewed as the #3 man on the Saints offense.

It’s unprecedented for a coordinator to win a Super Bowl, and oversee a unit that’s this good for this long without getting a head coaching job.

Nine (1)

Dick LeBeau (2005 PIT DC)

And finally we have LeBeau ’05, who will soon be joined my Carmichael ’09. The difference here is that LeBeau already a job as a head coach with the Bengals and was in his seventies starting in 2007; Carmichael is just 46 years old.

{ 5 comments }

The ultimate backup

Frank Reich is the ultimate backup.  In 1984, Reich helped lead the largest comeback in college football history.  With Maryland trailing Miami 31-0, Reich came off the bench to replace Stan Gelbaugh and led the Terrapins to a 42-40 victory.  It remained the biggest comeback in college football for over thirty years.

Eight years later, with an injured Jim Kelly on the sidelines, Reich led the greatest comeback in NFL history, leading the Bills to a 41-38 playoff win over Houston after trailing 35-3 early in the third quarter.

And in 2017, Reich was the Eagles offensive coordinator when MVP favorite Carson Wentz tore his ACL, ending his season.  Reich helped design an offense that turned Philadelphia backup and Rams castoff Nick Foles into the Super Bowl MVP. After leading two miraculous comebacks as a backup quarterback, Reich was the man pulling the strings as the Eagles backup quarterback did something even Reich couldn’t do: win the Super Bowl.

And now? Reich is once again coming in off the bench. For most of January, Patriots offensive coordinator Josh McDaniels was expected to become the next Colts head coach.  But McDaniels ultimately changed his mind and decided to return to New England, leaving the Colts at the altar at the last minute.  In an embarrassing bind, Indianapolis has turned to the ultimate backup, tapping Reich as the team’s newest head coach.

Reich, after winning the Super Bowl as an offensive coordinator, is immediately becoming an NFL head coach. In addition to the two coordinators who were promoted by their franchises after winning the Super Bowl after their head coaches retired, Reich will become the 10th coordinator to win a Super Bowl and then become head coach with another team. [continue reading…]

{ 16 comments }