≡ Menu

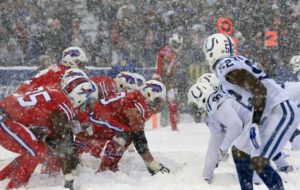
Week 14 Game Scripts: Bills and Colts Run In The Snow

A beautiful day for a photographer

There have been 208 games so far this season. Prior to week 14, the Chicago Bears, in a 27-24 win over Baltimore, had the lowest pass ratio of any team in a game at 27.6% (21 passes, 55 runs). Playing in the snow in Buffalo, the Bills rushed 51 times against 16 pass plays, for a 23.9% pass ratio. That’s the lowest pass ratio since a Monday Night Football game in 2014, when the Jets went back to Geno Smith as quarterback and basically didn’t let him throw the ball unless he had to. In modern times, teams just don’t run on 76% of their plays: the only other game since 2010 where that happened involved Tim Tebow, of course.

But wait, there’s more. The Colts ran on two-thirds of their plays, easily the lowest pass ratio of any team that lost its game this year; no other team had passed on fewer than 47 percent of its plays and lost. This was the most run-heavy game of the year and it wasn’t particularly close.

In fact, this was the most run-heavy game since the 2006 game between the Falcons and Panthers where Carolina rolled out a Wildcat offense with Jake Delhomme sidelined and starting QB Chris Weinke playing with a bum shoulder, the Panthers and Falcons combined for 71 rushing attempts and just 27 passes (plus six sacks). But the combined 97 runs for the Bills and Colts (helped by 15 overtime runs) was the most in a game since 1981 between the Chiefs and Bears that also went to overtime and was played in cold and wet conditions. The full week 14 Game Scripts, below: [continue reading…]

{ 5 comments }

Four years ago, I wrote an article about the — at the time — young and improving Seattle pass defense. It’s hard to compare modern defenses to what we saw in the ’70s, as the game has changed significantly in the favor of more impressive passing numbers.

But what we can do is compare each pass defense in each season to each other pass defense. In 2013, the Seahawks allowed 3.19 Adjusted Net Yards per Attempt, while the league average was 5.98. That’s a difference of 2.79 ANY/A, and the standard deviation among the 32 pass defenses was 0.95 ANY/A. In other words, the Seahawks were 2.93 standard deviations better than average (2.79 divided by 0.95).

This year, the Jaguars are allowing 3.52 ANY/A, and the league average is an almost identical 6.01. So Jacksonville is 2.49 ANY/A better than average, and given the standard deviation of 0.94, it means the Jaguars pass defense has a Z-Score of 2.65.

That would rank as the 6th best since 1950, behind the ’02 Bucs, ’88 Vikings, ’70 VIkings, ’13 Seahawks, and ’82 Dolphins. The 3.52 ANY/A average is the lowest since the 2013 Seahawks, and the second lowest since the 2009 Jets (who played in a less friendly passing environment; the league average was 5.74 ANY/A).

If you look at the NFL passing statistics through 13 games (well, 12 for the Dolphins and Patriots), it’s easy to see why the Jaguars pass defense is so good. It’s because they’re great at literally everything. The table below shows the team’s rank in every major category: top-5 finishes are in pink, and #1 finishes are in red with white font. [continue reading…]

{ 6 comments }

Case Keenum, Adam Thielen, and Undrafted Passing Games

All 32 teams passed on Keenum and Thielen many times.

The Minnesota Vikings have a pretty good passing game: through 14 weeks, the Vikings rank in the top 10 in both ANY/A and passer rating. What makes it really weird is that the top two members of the passing game — the quarterback and leading receiver — were both undrafted free agents. Case Keenum went undrafted in 2012 after a stellar career at the University of Houston. The Vikings leading receiver is Adam Thielen, who went undrafted in 2013 out of Minnesota State–Mankato. Together, they are the driving force behind the 2017 Vikings efficient passing attack.

The Vikings will become just the 7th team since 1970 with their top passer and top receiver both having gone undrafted.

  • The 2014 Browns had Brian Hoyer and Andrew Hawkins, although unlike the Vikings, this team wasn’t very good. Cleveland went 7-9 (which is of course, very good for Cleveland) and ranked 23rd in ANY/A.
  • The 2009 and 2010 Cowboys make the list, too, thanks to Miles Austin and a pair of quarterbacks. In 2009, Tony Romo and the Cowboys ranked 4th in ANY/A and went 11-5; the next year, with Romo hurt, Jon Kitna led Dallas in passing but the team went 6-10 and ranked 12th in ANY/A.
  • In 2004, the Titans passing attack was led by Billy Volek and Drew Bennett. For a short run, the combination was outstanding, but overall, the Titans finished 19th in ANY/A and 5-11.
  • In 2000, Jay Fiedler and Orande Gadsen were the key components in a mediocre Miami passing attack. Those Dolphins teams were defined by their defense, and the Dolphins went 11-5 despite ranking 19th in ANY/A.
  • In 1992, Dave Krieg joined the Chiefs as a 34-year-old veteran. He was undrafted, as was Willie Davis, who had zero NFL catches to his name prior to the season. Davis wound up leading the Chiefs in receiving, and together, Krieg and Davis helped the Chiefs rank 8th in ANY/A and finish 10-6.

The table below shows all teams since 1970 where neither the quarterback nor the leading receiver (in receiving yards) were drafted within the first 200 picks. It is sorted by ANY/A rank that season:

TeamYearQBQB DraftWRTop WR DraftANY/A RkWn%
KAN1990Steve DeBerg275Stephone Paigeudfa10.688
MIN1988Wade Wilson210Anthony Carter33440.688
DAL2009Tony RomoudfaMiles Austinudfa40.688
HOU1989Warren MoonudfaDrew Hill32860.563
CLE1978Brian Sipe330Reggie Ruckerudfa60.500
HOU1992Warren MoonudfaCurtis Duncan25870.625
HOU1988Warren MoonudfaDrew Hill32870.625
CLE1976Brian Sipe330Reggie Ruckerudfa80.643
KAN1992Dave KriegudfaWillie Davisudfa80.625
HOU1987Warren MoonudfaDrew Hill32890.600
KAN1985Bill Kenney333Stephone Paigeudfa110.375
NWE2008Matt Cassel230Wes Welkerudfa120.688
DAL2010Jon KitnaudfaMiles Austinudfa120.375
TAM2003Brad Johnson227Keenan McCardell326130.438
KAN1989Steve DeBerg275Stephone Paigeudfa140.531
MIN1989Wade Wilson210Anthony Carter334150.625
SFO1980Steve DeBerg275Dwight Clark249150.375
NOR1971Ed Hargett397Danny Abramowicz420160.357
TAM1987Steve DeBerg275Gerald Carter240170.267
KAN1986Bill Kenney333Stephone Paigeudfa190.625
TEN2004Billy VolekudfaDrew Bennettudfa190.313
MIA2000Jay FiedlerudfaOronde Gadsdenudfa190.688
BUF2011Ryan Fitzpatrick250Steve Johnson224200.375
CLE1977Brian Sipe330Reggie Ruckerudfa200.429
ATL1986David ArcherudfaCharlie Brown201210.469
BUF2012Ryan Fitzpatrick250Steve Johnson224210.375
KAN1988Steve DeBerg275Stephone Paigeudfa220.281
HOU1985Warren MoonudfaDrew Hill328220.313
KAN1981Bill Kenney333J.T. Smithudfa220.563
CLE2014Brian HoyerudfaAndrew Hawkinsudfa230.438
MIN1987Wade Wilson210Anthony Carter334240.533
HOU1986Warren MoonudfaDrew Hill328240.313
NYG1978Joe PisarcikudfaJim Robinson367240.375
BUF2010Ryan Fitzpatrick250Steve Johnson224250.250
DET1989Bob Gagliano319Richard Johnsonudfa250.438
DEN1982Steve DeBerg275Steve Watsonudfa260.222
ATL1985David ArcherudfaBilly Johnson365270.250
NYG1977Joe PisarcikudfaJim Robinson367270.357
SFO2004Tim Rattay212Eric Johnson224290.125
NYJ2016Ryan Fitzpatrick250Quincy Enunwa209300.313
CIN2008Ryan Fitzpatrick250T.J. Houshmandzadeh204310.281

There are, unsurprisingly, a few combinations that show up multiple times on the list. Warren Moon and Drew Hill were the key parts of the Oilers passing game for five straight years in the back half of the ’80s. Wade Wilson and Anthony Carter made the list for their work with the Vikings in ’87, ’88, and ’89. Steve DeBerg and Stephone Paige did it with the Chiefs from ’88 to ’90. Ryan Fitzpatrick and Steve Johnson led the Bills in passing and receiving, respectively, in 2010, 2011, and 2012. And Brian Sipe and Reggie Rucker led the Browns in ’76, ’77, and ’78.

What stands out to you?

{ 6 comments }

Are The 2017 Jaguars The Next 1986 Bears Or 2009 Jets?

The Jacksonville Jaguars currently lead the NFL in three categories that correlate strongly with winning: rushing yards, Adjusted Net Yards per Attempt Allowed, and points allowed. It’s pretty freakin’ rare for a team to lead the NFL in all three of those categories; since 1950, it’s only happened six times.

In 2009, the Mark Sanchez/Thomas Jones/Darrelle Revis Jets pulled off that feat. New York ranked 27th in ANY/A and underachieved significantly relative to its Pythagorean record. The Jets snuck into the playoffs but then lost in the AFC Championship Game.

In 1985 and 1986, the Chicago Bears did it in consecutive years. We all know about the 15-1 team from 1985, and Jim McMahon and the offense ranked 6th in ANY/A and won the Super Bowl. In ’86, the Bears ranked 17th in ANY/A, McMahon was injured, and Doug Flutie was the quarterback in the team’s lone playoff game, a home loss to Washington where the team did take a 13-7 lead into the locker room.

In 1972, the Dolphins led the NFL in a host of categories, including that 14-0 regular season record. And while Miami led the NFL in rushing yards, ANY/A allowed, and points allowed, but also in ANY/A.

In 1969, the AFL’s Chiefs pulled off the trick and ranked 4th in ANY/A in the 10-team AFL. Like the ’72 Dolphins and ’85 Bears, this team won the Super Bowl.

In 1962, the Packers — you know, maybe the greatest team of all-time — were the first team since the 1949 Eagles to lead the NFL in ANY/A allowed, points allowed, and rushing. The Packers, of course, won it all, too.

Nobody is going to confuse Blake Bortles with Bart Starr, Len Dawson, or Bob Griese, or even Jim McMahon or Earl Morrall. But can Bortles be Mark Sanchez good, or just a little bit better? The Jaguars currently rank 17th in ANY/A and Bortles ranks 17th in Total QBR. So how have previous Jaguars-esque teams fared? [continue reading…]

{ 3 comments }

In week 13, the Cowboys, Packers, and Jets were run-happy teams, finishing with the three most run-oriented play ratios of the week. After accounting for Game Script, the Jets were really run-heavy: New York finished with a negative Game Script but finished with 49 runs! The Jets finished tied for the most rushing attempts since 1983 in a game (excluding OT) where the opponent scored 30+ points. The other time? The remarkable Jerome Harrison/Josh Cribbs game against the Chiefs from 2009, which I wrote about at the time.

The Cowboys finished with 23 pass plays and 42 runs in a blowout win over the Redskins. Dallas led most of the way against Washington, and the Cowboys are happy to institute a run-heavy plan whenever the Game Script allows.

The Packers led early against the Bucs, but Tampa Bay took a 4th quarter lead and the game went deep into overtime. Brett Hundley had 24 dropbacks, while Packers running backs had 22 carries and Hundley himself had 7 carries. The main reason for the run-heavy game plan? Hundley was a disaster throwing the ball, gaining 77 net yards on those 24 dropbacks with an interception. Since 1979, the Packers have won just one other game with so few passing yards: this disaster of a game in 1991 against the 1-10 Colts.

The full week 13 Game Scripts below: [continue reading…]

{ 1 comment }

Running back Duke Johnson, a 3rd round pick from the University of Miami in 2015, currently leads the Browns in receiving yards.

No. Player Age Pos G GS Tgt Rec Yds
Y/R TD R/G Y/G Ctch%
29 Duke Johnson 24 12 0 69 52 456 8.8 2 4.3 38.0 75.4%
87 Seth Devalve 24 te 12 4 46 26 335 12.9 1 2.2 27.9 56.5%
85 David Njoku 21 te 12 2 49 28 332 11.9 4 2.3 27.7 57.1%
80 Ricardo Louis 23 WR 12 9 57 26 322 12.4 0 2.2 26.8 45.6%
18 Kenny Britt 29 wr 9 4 38 18 233 12.9 2 2.0 25.9 47.4%
81 Rashard Higgins 23 wr 11 3 40 20 214 10.7 0 1.8 19.5 50.0%
19 Corey Coleman 23 rt/wr 6 6 36 15 206 13.7 1 2.5 34.3 41.7%
34 Isaiah Crowell 24 RB 12 12 30 20 180 9.0 0 1.7 15.0 66.7%
12 Josh Gordon 26 wr 1 1 11 4 85 21.3 0 4.0 85.0 36.4%
82 Kasen Williams 25 wr 7 2 18 9 84 9.3 0 1.3 12.0 50.0%
11 Bryce Treggs 23 wr 6 1 18 5 79 15.8 0 0.8 13.2 27.8%
10 Sammie Coates 24 wr 8 1 10 5 62 12.4 0 0.6 7.8 50.0%
27 Matthew Dayes 23 12 0 5 4 29 7.3 0 0.3 2.4 80.0%
11 Jordan Leslie 26 2 0 1 1 26 26.0 0 0.5 13.0 100.0%
86 Randall Telfer 25 TE 12 11 2 2 24 12.0 0 0.2 2.0 100.0%
40 Dan Vitale 24 fb 12 4 4 2 18 9.0 0 0.2 1.5 50.0%
70 Kevin Zeitler 27 RG 12 12 1 1 -4 -4.0 0 0.1 -0.3 100.0%
Team Total 24.6 12 435 238 2681 11.3 10 19.8 223.4
Opp Total 12 262 2764 10.5 23 21.8 230.3

Suffice it to say, that’s not a good thing, at least in this case. The Browns rank last in ANY/A at 3.5 and last in passer rating at 59.8; Cleveland has the worst passing attack in the NFL, and the fact that Johnson is the team’s leading receiver probably speaks to that.

It’s also pretty rare. Excluding guys like Eric Metcalf or who played running back at times but wasn’t a running back in say, the 1995 Falcons, it’s only happened twice since 2000. Two years ago, with Keenan Allen limited to 8 games and Antonio Gates to 11, Danny Woodhead led the Chargers in receiving yards. And for the 2013 Chiefs, Jamaal Charles somehow led the team in rushing and receiving yards (something neither Johnson nor Woodhead did) as Dwayne Bowe and Donnie Avery fought for table scraps.

The table below shows every running back to lead his team in receiving yards since 1970: [continue reading…]

{ 8 comments }

Here’s a look at the 2017 rushing leaders for the Seattle Seahawks:

No. Player Age Pos G GS Att Yds
TD Lng Y/A Y/G A/G
3 Russell Wilson 29 QB 12 12 71 432 3 29 6.1 36.0 5.9
32 Chris Carson 23 rb 4 3 49 208 0 30 4.2 52.0 12.3
27 Eddie Lacy 26 rb 9 3 69 179 0 19 2.6 19.9 7.7
21 J.D. McKissic 24 rb 9 1 33 143 1 30 4.3 15.9 3.7
34 Thomas Rawls 24 rb 9 3 50 129 0 23 2.6 14.3 5.6
39 Mike Davis 25 rb 2 2 22 82 0 22 3.7 41.0 11.0
16 Tyler Lockett 25 WR 12 7 8 46 0 22 5.8 3.8 0.7
22 C.J. Prosise 23  rb 5 0 11 23 0 8 2.1 4.6 2.2
Team Total 26.3 12 316 1233 4 30 3.9 102.8 26.3

You might have noticed that quarterback Russell Wilson actually leads the team in rushing yards.  Which is… pretty unusual.  Excluding situations when players who didn’t enter the NFL as a running back but played that position (like Ty Montgomery or Denard Robinson), only twice in the last 20 years has a non-RB led his team in rushing yards.  Do you know who and when?

Show


Before them, the last player was Randall Cunningham – who did it for the 1987, 1988, 1989, and 1990 Eagles. The only other time since the merger that a non-RB has led his team in rushing yards was Bears quarterback Bobby Douglass in 1972.

And before Douglass, you have to go back to 1960, when Lenny Moore led the Colts in rushing yards the year after moving to wide receiver (he still actually led the team in carries, too, but Alan Ameche was the fullback and Alex Hawkins was the running back; Moore finished with 936 receiving yards and 374 rushing yards). Also that year, Jets (well, Titans) quarterback Al Dorow led the expansion franchise in rushing yards.

Positional designations get a little tricky pre-1960, but a few other quarterbacks pulled off the feat in the ’50s. Tobin Rote led the Lions in rushing in 1958, and the Packers in rushing in 1951, 1952, and 1956. Charley Trippi led the Cardinals in rushing in 1951 and 1952, although the 1952 Cardinals had the greatest four-way race for a franchise rushing title you’ll ever see.

This is a long way of saying it’s going to be pretty noteworthy if Wilson leads the Seahawks in rushing, which seems very likely to happen.

{ 9 comments }

Regular readers know that I like measuring wide receivers using some nontraditional methods. One metric I like to track is the comparison of how good a team’s passing offense is and what percentage of the team’s receiving pie went to the top receiver. Do you remember Gary Clark in 1991? That season was remarkable because he had 36% of all Redskins receiving yards and a third of the Washington passing touchdowns while playing for one of the best passing attacks of that era.

This year, Antonio Brown, Adam Thielen, and Julio Jones stand out as the best receivers by these metrics. Brown has picked up a whopping 39.5% of all Steelers receiving yards, the highest ratio of any player in the league. Pittsburgh also ranks 12th in Adjusted Net Yards per Attempt, so Brown gets a lot of credit for being an enormous part of an above-average passing offense.

Thielen has 34.3% of all Vikings receiving yards, the third highest share of a team’s receiving game so far this season. And, as surprising as this may be, Minnesota ranks 5th in ANY/A. So Thielen is playing for a top-5 passing attack while being in the top 5 in percentage of his team’s passing attack. That’s a great season. Jones is in a similar position: he has 34.2% of Falcons receiving yards and Atlanta ranks 8th in ANY/A.

The graph below shows each team’s leader in receiving yards. For most teams, this is a wide receiver; for the Browns, it’s a running back, which says a lot about the Browns; the Titans, Raideres, Giants, and Bills are all led by a tight end. The Y-Axis shows that team’s Relative ANY/A, or ANY/A above/below average. The X-Axis shows the percentage of team receiving yards by that player. You want to be up and to the right on this graph, like Brown, Jones, and Thielen. [continue reading…]

{ 5 comments }

The Jacksonville Jaguars have what appears to be a historically dominant defense this year (more on this later in the week). But here’s a simple way to look at it: Jacksonville is allowing just 8.0 points per game in wins this season, and has won just one game where it allowed more than 10 points. The Ravens have had a similar run of success (3 of the team’s 7 wins have come in shutouts) and the Giants have won just two games (but the defense played well in both); the other teams have all allowed an average of 13 points per game or more in wins. You can see how many points each team has allowed in wins and losses this season here.

But I think we are all a bit surprised to see a Blake Bortles led team sport an 8-4 record, and it would hardly be surprising to see the Jaguars win 10 or 11 games this year (Houston and San Francisco are still on the schedule). So when we look back and say how the heck did this happen, well, obviously the defense dominating in wins played a huge role. How huge?

Among quarterbacks since 1950 to win at least 6 games in a season, only 58 played on teams that allowed fewer than 10 points per game in wins. Of those 58, 13 played between 1950 and 1969, another 16 played from 1970 to 1977, and another 9 played from 1978 to 1989.

That means just 20 played from 1990 to 2016, and only 8 from 2002 to 2016. That’s about one every two years, and right now, Bortles and Joe Flacco are poised to join the list. When you look back and see that Kyle Orton once won 10 games, or Mark Sanchez had a winning record, or a 37-year-old Jeff Garcia went 8-5, well, this list helps clarify things. [continue reading…]

{ 9 comments }

With the conference championship games in the books, it’s time to look at the final regular season results. The 4 playoff teams — Clemson, Oklahoma, Georgia, and Alabama — rank in the top 7 of the final ratings. The other 3 teams? They’re all in the Big 10, a conference that sent zero teams. [continue reading…]

{ 3 comments }

Yesterday, I noted that in 2017, teams that outrush their opponents have won 71% of games this season.  That’s higher than the rate last season, but it’s generally in line with winning percentages over the last few years.  In fact, for just about all of pro football history, teams have won around 73% of their games, plus or minus 5%.  But if you look closely enough, you can see a bit of a decline over time. Take a look: [continue reading…]

{ 5 comments }

This year, teams are 126-51 when outrushing their opponents, for a 0.712 winning percentage. In the abstract, that doesn’t mean much, and I’ll take a historical look at this data tomorrow. But what about teams this year?

The 10-1 Eagles rank 2nd in rushing yards and 1st in rushing yards allowed, thanks to a dominant run defense and an offense that is usually playing with the lead. The Eagles have outrushed their opponents in 9 straight games, but in week 1 the Eagles beat Washington despite being outrushed 64-58, and in week 2, the Eagles lost to the Chiefs and were outrushed 112-107. The table below shows how often each team has outrushed its opponents this year: [continue reading…]

{ 1 comment }

Joe Flacco is currently averaging just 8.2 yards per completion this year. That would be the lowest in NFL history among players with at least 100 completions. Flacco, who once had a reputation as one of the game’s best deep throwers, is now completing passes for less yards than anyone ever has.

The Ravens rank 18th in the NFL in completions and yet 32nd in passing yards. The Ravens rank 8th in completion percentage and but 32nd in yards per attempt! That is remarkable. Since 1970, here are the teams that ranked at least 18 slots slower in yards per attempt than completion percentage: [continue reading…]

{ 3 comments }

Week 12 Game Scripts: Goff, Wentz, Pass To Victory

The Eagles and the Rams were the two most pass-happy teams of week 12. For Philadelphia, Carson Wentz (and Nick Foles) still had 40 dropbacks in a blowout against the Bears; Eagles running backs combined for only 24 carries despite the game being out of reach for most of the day. Philadelphia had the largest Game Script of the week and also the 5th most pass-happy performance among the 16 winning teams.

In Los Angeles, Jared Goff and the Rams had the most pass attempts and the highest pass ratio of any winning team in week 12; this despite a +7.0 Game Script. This was likely because Goff and the passing attack was very successful, in part because the Saints were down their starting two cornerbacks.

The full week 12 Game Scripts below: [continue reading…]

{ 0 comments }

As it turns out, having Ben Roethlisberger, Philip Rivers, and Tom Brady causes teams to be pretty pass-happy.

In week 11, the Steelers, Chargers, and Patriots all were very pass-happy. Pittsburgh passed on 70 of its plays despite blowing out the Titans, winning by 23 points with a +8.8 Game Script. The Chargers had the biggest Game Script of the week at +20.1, but still passed more often than they ran. There have only been 22 games in history where a team led by 28 points after 2 quarters and after 3 quarters and passed more often than they ran; the last 11 prior to this game all featured Hall of Fame quarterbacks. Speaking of Hall of Fame quarterbacks, the Patriots just became the 4th team to pass on over 65% of plays despite leading by 14+ at halftime and 28+ after three quarters, and one of those teams was the 1999 Panthers in week 17 who kept passing to attempt to run up the score to make the playoffs.

The full week 11 Game Scripts below: [continue reading…]

{ 2 comments }

Carson Wentz and Winning It All On Your First Try

Carson Wentz and the Eagles are 10-1, and are the frontrunners to earn the #1 seed in the NFC and win the conference. Once we get to the playoffs, though, you can imagine what a common refrain will be:

Yes, Wentz and the Eagles are good, but they are unproven in the playoffs!

So, is that a meaningful criticism? Let’s leave out that the quarterbacks of the other two best teams in the NFC are Case Keenum (or Teddy Bridgewater) and Jared Goff, as the NFC playoff field will still likely see Drew Brees and a combination of Cam Newton, Matt Ryan, Russell Wilson, and Matthew Stafford. Here’s the real question: how likely is a QB to win a Super Bowl his first time making the playoffs?

You may be surprised to learn that ten quarterbacks have won the Super Bowl in their year they started their first playoff game (and another ten made it to the Super Bowl and lost).

The list, hidden in spoiler tags for those who want some trivia:


To be fair, only a few of those would count as young funs. Plunkett and Theismann were both 33, Staubach and Hostetler were 29, and Warner was 28. McMahon and Aikman were both 26 but in their 4th year (and Aikman played in a playoff game in reserve in his third year), but Brady, Montana, and Namath certainly qualify as “Wentz-like” when it comes to age and experience.

But what about the hosts of young stud quarterbacks that haven’t won a Super Bowl? In other words, if Brady/Montana/Namath are the 3 positive examples, how many negatives ones are there? There are only 9 quarterbacks who started their first playoff game at the age of 25 of younger and also were on the team that won (or tied for) the most games in their conference. In reverse order…

  • Dak Prescott, as a 23-year-old rookie led the #1 seed Cowboys into the playoffs in 2016, but Dallas lost after the bye to the Packers. Prescott played well in that game, however.
  • A.J. McCarron technically makes the list, as he started a playoff game in place of Andy Dalton. The Bengals lost that game to the Steelers (which was arguably not McCarron’s fault), but given that he was a backup, he doesn’t feel like a great comparison.
  • In 2004, another Pennsylvania young gun took the country by storm: Ben Roethlisberger and the Steelers went 15-1 that year in Roethlisberger’s rookie season at age 22. Roethlisberger struggled in two playoff games, particularly in the loss to the Patriots in the first half of the AFC Championship Game (two first half interceptions, including a pick six, as the Steelers were held to 3 points).
  • In 1986, Doug Flutie started his first playoff game for the Bears in a McCarron-esque situation (he started just one game in the regular season).
  • In 1983, a rookie Dan Marino made the postseason for the 12-4 Dolphins at the age of 22. He lost his first playoff game, although he played pretty well and had a 3-point lead late in the 4th quarter.
  • In 1981, Montana made the playoffs with the 49ers, who had the #1 seed. San Francisco won all three games.
  • In 1975, Ron Jaworski started a playoff game for the Rams in another McCarron/Flutie-esque situation; starter James Harris was injured in the second-to-last regular season game. Jaworski won his only start, although he played most of the NFC Championship Game against the Cowboys, which was a bloodbath.
  • Finally, we have Bob Lee for the 1971 Vikings.  This was another McCarron/Flutie/Jaworski situation: Lee went 3-1 as the Vikings starter due to injuries in 1971, got the start in the playoff game against the Cowboys, and imploded.

So if you are an Eagles fan, yes it’s pretty rare for a young quarterback to win the Super Bowl.  But it’s also pretty rare for a young quarterback to guide his team to the best record in his conference: only Prescott, Rivers, Roethlisberger, Marino, and Montana have done that.  Of that bunch, none of them played badly except for Roethlisberger, with some bad luck (including facing an all-time great QB and/or blowing a fourth quarter lead) ending the seasons for Prescott, Rivers, and Marino.

In the last 20 years, Cam Newton, Matt Ryan, Daunte Culpepper, Donovan McNabb, and Peyton Manning have been young quarterbacks who first led their team to the playoffs in a year where their team finished one game behind the conference leader in wins.  Those stories aren’t quite as impressive.   In general, though, being on the best team in a conference is a pretty good place to start.

{ 9 comments }

The Philadelphia Eagles are 10-1 for the fourth time in franchise history. The Eagles have never started a season 11-0, so this season makes the short list for best start in franchise history.

In 1948, behind head coach Greasy Neale, QB Tommy Thompson, and future HOFers RB Steve Van Buren and WR Pete Pihos, and RB Bosh Pritchard, the Eagles went 9-2-1 and won the NFL title.  In 1949, the Eagles brought back Neale, Thompson, Van Buren, Pihos, and Pritchard, and had similar success.  The team lost to the Bears in week 4 but finished the regular season with a sparkling 11-1 record. Philadelphia repeated as champions, defeating the Rams 14-0 in the NFL title game.

In 1980, the Eagles lost to the Cardinals in week 4, but started the season 11-1 before finishing 12-4 and winning the NFC.  The head coach was Dick Vermeil, the QB was Ron Jaworski, and while RB Wilbert Montgomery and WR Harold Carmichael were the stars on offense, Philadelphia sported a dominant defense that ranked 1st in points allowed, and 2nd in rushing yards allowed, net yards per pass attempt allowed, and rushing yards allowed.  Alas, despite being 3-point favorites, the Eagles lost in the Super Bowl to the Raiders.

The 2004 Eagles was the best Philadelphia team of the modern era.  The team began the season 13-1, with the only loss coming to the 15-1 Steelers in Pittsburgh.  Philadelphia clinched the NFC East after week twelve. The Packers were the 2nd best team in the NFC, and the Eagles bludgeoned them in December 47-3 before a pair of garbage time touchdowns. Philadelphia had a great defense, but the offense centered around Donovan McNabb, Brian Westbrook, and Terrell Owens was unstoppable. In the 14th game, however, Owens broke his fibula and injured his ankle; expected to miss the rest of the year, Owens returned for the Super Bowl, but it was not enough: Philadelphia fell to the Patriots.

If you are an Eagles fan, that’s some pretty good company: all three teams made it to the championship game.

This year’s team seems worthy of being in that discussion. Philadelphia leads the NFL with a 31.9 points per game average, thanks in part to an otherwordly (and unsustainable) red zone success rate of 73.3%.  The Eagles rank 8th in points per game allowed (17.4), and rank in the top 10 in just about every major defensive category.  The Eagles rank 1st in the NFL in points differential, at 14.5 per game.  That’s also the 3rd best in Eagles history through 11 games, behind the ’49 team (+19.6), ’48 team (17.8), and ahead of the 1980 team (+14.3). [continue reading…]

{ 6 comments }

Penn State, at 10-2 and a runner-up in the Big Ten East, is not in the college football playoff discussion. But that doesn’t mean the Nittany Lions haven’t been as good as any team this season. After all, had Penn State had played Ohio State at home and won by 1 point instead of losing on the road the Buckeyes by 1 point, the Nittany Lions wouldn’t be any “better” than they are now, while their record would be much better. An 11-1 Penn State with wins over Ohio State, Iowa, Michigan, and Northwestern, and be a lock to make the college football playoff with a win over Wisconsin in the Big 10 Championship Game.

Penn State ranks 7th in points scored and 7th in points allowed among the 130 teams in the FBS. The Nittany Lions are the only team in the top 10 in both categories, and Alabama (1st in points allowed, 12th in points scored) is the only other team in the top 15 in both; Washington (18th in scoring, 6th in points allowed) is the only other team to rank in the top 20 in both. Penn State has outscored opponents by 26.1 points per game, second to only Alabama (27.6) despite a harder schedule. Penn State lost two games on the road by a total of 4 points; but, even though the Nittany Lions rank 1st in the SRS, the loss to Ohio State — which goes down as the best loss of the season (edging Utah’s 3-point road loss in Washington) — is enough to eliminate them from contention.

As always thanks to Dr. Peter R. Wolfe for providing the weekly game logs. The full week 13 NCAA SRS ratings below: [continue reading…]

{ 0 comments }

When the Los Angeles Chargers started the season 0-4, it was tempting to think that the season was over. But, as I cautioned, not all 0-4 teams are created equally. And while only one team had ever gone from 0-4 to the playoffs (ironically, the Chargers in 1992), that was a little misleading. Most 0-4 teams don’t make the playoffs because of the 0-4 start *and* because they are bad teams. But if the team is a good team, an 0-4 start is not necessarily a death sentence.

Los Angeles is proving that to be the case. Right now, the Chargers rank 7th in the NFL in Adjusted Net Yards per Attempt, and 4th in Adjusted Net Yards per Attempt allowed. The Chargers rank 3rd in the NFL in ANY/A Differential — the difference between those two statistics — and rank 1st in the AFC in that category. Take a look: Take a look: the Y-Axis shows each team’s winning percentage, while the X-Axis displays ANY/A differential.
[continue reading…]

{ 1 comment }

One of the very first trivia questions posted at Football Perspective was about the first quarterback to lose 100 games as a starter. You might have thought that the answer was Archie Manning (35-101-3 career record), but he only had the worst record of all-time; he wasn’t the first to get to 100 losses (answer in the original post). (Actually, that post now appears to have been wrong. At some point since 2012, PFR has updated the career record of Norm Snead from 52-99-7 to 52-100-7. The extra start came in 1965, specifically this game against the Browns; five years ago, PFR had King Hill starting that game; now it had Snead — who went 0/1 — as the starter.

Well, last night, Archie’s son set another record. With the Giants loss to the Redskins on Thanksgiving, Eli Manning became the first quarterback in NFL history to lose 100 starts with a single team. The table below shows all quarterbacks with at least 70 losses with one team, through November 24, 2017: [continue reading…]

{ 4 comments }

Yesterday, I appeared on the Wharton Moneyball Podcast on Sirius XM. It is available on SoundCloud here:

https://soundcloud.com/user-780849378/112217-wharton-moneyball

My segment starts at 31:25.

{ 0 comments }

Every year, I look at the least-conforming games in the NFL. What do I mean by least-conforming? Well, let’s use the Titans trip to Jacksonville in week 2 this season as an example. Tennessee has an SRS of -5.1 this year, while the Jaguars have an SRS of +9.3. Given that the game was in Jacksonville, we would expect the Titans to lose by 17.4 points, assuming 3 points for the home team. In reality, the Titans won by 21 points, a swing of 38.4 points! That was the “weirdest” game of the year.

The Titans were also in the second least-conforming game of the season. Facing a Deshaun Watson Texans team, the Titans traveled to Houston and lost by a whopping 43 points. The Texans — thanks in part, of course, to several non-Watson games — have an SRS of -0.4. So at home against Tennessee, we would have expected the aveage Texans team to win b 7.8 points, not 43 points. That difference of 35.2 was one of just three games where the difference between the actual result and expected result exceeded 30 points. [continue reading…]

{ 0 comments }

Rams kicker Greg Zuerlein has been outstanding this year. Consider:

  • He is 4/4 on kicks from 50+ yards this year. Kickers have made 72% of field goal attempts from that range this season, so the average kicker would have made 2.9 such field goals. As a result, Zuerlein has made 1.1 more 50+ yard kicks than the average kicker.
  • He is 9/9 on kicks from 40-49 yards. Kickers have made 79% of kicks from that range this season, so the average kicker would have made 7.1 of those 9 attempts. Therefore, he made 1.9 more field goals than an average kicker from that range.
  • He is 9/10 on kicks from 30-39 yards. Kickers have made 84% of such kicks this year, so an average kicker would have made 8.4 of his 9 attempts. As a result, Zuerlein has made 0.6 more field goals fro 30-39 yards than the average kicker.
  • From 0-19 yards he was 1/1, and from 20-29 yards, he is 5/5. All kickers have made all attempts form under 20 yards, so he gets no credit for that. And kickers have made 99% of kicks from 20-29 this season, so he gets credit for being .1 field goals made above average here.
  • Kickers have made 94.5% of extra points this year, while the Rams star is 31 of 31. Since the average kicker would have made 29.3 of 31 kicks, it means Zuerlein has made 1.7 more extra points than the average kicker.

Add it up, and Zuerlein has made 3.7 more field goals than the average kicker — worth 11.2 points — and 1.7 more extra points. That translates to 13.0 points above average, the most of any kicker in the NFL. In fact, other than Kansas City’s Harrison Butker, Zuerlein has added twice as much value as all other kickers this year. [continue reading…]

{ 3 comments }

The SRS ratings this week didn’t change much, with very few meaningful games among top teams.

Penn State, Notre Dame, Washington, and Iowa State fell a bit in close wins over bad teams, while Oklahoma State and Iowa suffered losses. The only other top-25 teams (by the SRS) to lose lost to even better teams: Michigan lost to Wisconsin, and N.C. State losing to Wake Forest.

Right now, three Big 10 teams crack the top four, with Georgia and Auburn combining with #1 Alabama to give the SEC three top-10 teams. The full week 12 SRS ratings are below. As always thanks to Dr. Peter R. Wolfe for providing the weekly game logs. [continue reading…]

{ 0 comments }

Over the first two weeks of the season, the Saints had the worst pass defense in the NFL. New Orleans was torched by Sam Bradford and then Tom Brady — which admittedly looks less embarrassing in hindsight — as those two quarterbacks produced arguably the best two performances of the NFL those weeks.

Since then? New Orleans has had the best pass defense in the NFL by a considerable margin. The table below shows passing stats for each defense from weeks 3 through 10. Here’s how to read the Saints line. New Orleans has the best pass defense over that time period, and has won 100% of the team’s games. Opponents have completed only 121 of 226 pass attempts for a 53.5% completion rate, and are averaging only 9.8 yards per completion. The Saints have allowed just 1,036 passing yards (this is net of sacks), 5 TDs, and 10 INTs, while producing 22 sacks. Opponents have a 57.4 passer rating and have thrown for just 54 first downs. Finally, opponents are averaging just 2.77 ANY/A, and 4.54 Adj YPA (which includes a bonus for first downs), and have allowed a whopping 1,005 fewer adjusted yards than average, easily the best in the league. [continue reading…]

{ 5 comments }

In 2006, playing for the Detroit Lions, quarterback Jon Kitna was responsible for every pass attempt by the team. He wound up throwing for 4,208 yards, and ran for another 156 yards. The Lions, being a terrible 3-13 team, finished 32nd in rushing attempts (because they were always losing) and 2nd in pass attempts (because they were always losing).

So you won’t be surprised to see that the Lions threw for a lot of yards (7th most in the NFL) and ran for not many yards (last). And since Kitna took every passing attempt, well, Kitna was responsible for most of the Lions total yards. In fact, the 4,364 yards he totaled wound up representing 81.7% of the Lions 5,337 team yards from scrimmage. That is the most in a single season by any player in NFL history… until, maybe, now.

Here’s a good tip: if you see a stat that says Superstar X has the most Y in history, and it doesn’t tell you who currently has the most Y in history, there’s a good chance it’s a player who isn’t very good. (Also, and this is a more rare rule: if a stat says since X date, it usually means another player had a better season before X date. That’s not the case here; the “in the Super Bowl era” modifier was not necessary.)

Wilson has all 2,543 passing yards thrown by the Seahawks this year, and he also leads the team in rushing. Wilson has 290 rushing yards, so he’s accounted for 2,833 yards for Seattle this year, or 82.1% of the team’s 3,443 yards through ten weeks.

Below are the current list of single-season leaders in percentage of team yards: [continue reading…]

{ 12 comments }

Adjusted Completion Percentage, Part 2

Last summer, I discussed that while completion percentage is a bad statistic, there’s one simple way to improve the metric: include sacks in the denominator.

If a quarterback takes a sack, that is *worse* than an incomplete pass, but it is *better* for the quarterback’s completion percentage. That is Just Plain Wrong.

As it turns out, this really impacts Peyton Manning and, to a lesser extent, Drew Brees. In 2003, Manning led the NFL in both completion percentage (67.0%) and adjusted completion percentage (64.9%). Technically, Manning didn’t win any other completion percentage crowns, although PFR gives him a tie in 2012. [1]Technically, he lost it to Matt Ryan that year once you go out to two decimal places, 68.62% to 68.61% (although if you include sacks in the denominator but keep the minimum at 224 passing plays, … Continue reading However, he won the adjusted completion percentage crown a whopping five more times in his career: 2004, 2006, 2008, 2012, and 2013.

Brees has three completion percentage crowns (a fourth may come this season), but two more adjusted completion percentage titles. From 2003 to 2016, Manning won six AC% titles, Brees won give, and the rest of the league (Cousins, Brady, Palmer) won just three. In fact, from the six-year period covering 2008 to 2013, Manning and Brees won all of the adjusted completion percentage crowns.

The full list of leaders in each year since the merger are presented below, along with where that quarterback ranked in raw completion percentage (using a minimum of 224 passing plays per 16 team games for both metrics): [continue reading…]

References

References
1 Technically, he lost it to Matt Ryan that year once you go out to two decimal places, 68.62% to 68.61% (although if you include sacks in the denominator but keep the minimum at 224 passing plays, Alex Smith was the completion percentage champion in 2012).
{ 2 comments }

Week 10 Game Scripts: Saints Stick To the Ground Game

The Broncos, Saints, Packers, and Steelers were your run-happy teams of week 10.

Denver made the quarterback switch to Brock Osweiler, which is a good reason why they decided to be run-happy. Osweiler had 33 pass attempts, while Broncos running backs had 27 carries… in a game Denver trailed 27-9 at halftime. Consider that New England had a +14.5 Game Script… and finished with a higher pass ratio than Denver!

New Orleans called a running play on 24 straight plays, and passed on fewer than 35% of their plays, the first time that’s happened for the Saints since 2001. Even with a +16.6 Game Script, that’s still incredibly run-heavy.

Green Bay was in a tight game throughout with the Bears, but Jamaal Williams had 20 carries and Green Bay rushed 37 times against the Bears, compared to just 28 pass plays for Brett Hundley (who also had only two rushing attempts).

Finally, Pittsburgh trailed most of the day against the Colts, but Le’Veon Bell still had 26 carries. The Steelers had a nearly 50/50 pass/run ratio, remarkable for a team playing with a -4.7 Game Script.

The full week 10 Game Scripts below: [continue reading…]

{ 0 comments }

Let’s get to the week 9 Game scripts! Yes, these are a week late: my apologies, as well, other topics wound up being covered last week.

The biggest stories of week 9 were the blowout wins by Los Angeles, Philadelphia, and New Orleans. The Rams and Saints followed that up with another pair of blowout wins in week 10, while the Eagles were on bye. But before turning to week 10, let’s review some of the biggest outliers from week nine.

In week 9, the Jets and Panthers were very run-heavy. Lest you forget, the Jets beat the Bills on Thursday night in week 9, and while quarterback Josh McCown did have 5 carries, the running backs combined for 36 carries, while McCown had just 21 attempts. The Jets blew out Buffalo, but consider that the Lions had a similar Game Script and passes on 50% of plays.

Carolina beat Atlanta in a close game where the Panthers trailed for most of the first half. Still, behind Cam Newton and his 9 carries, Carolina wound up passing just 25 times while running 38 times! That’s really run-heavy.

The full Game Scripts data below: [continue reading…]

{ 0 comments }

Note: The data in today’s post is current through week 10 but excluding the Monday Night game between Carolina and Miami.

The Jets, behind Josh McCown, rank 3rd in the NFL in completion percentage this season, with a nominally impressive 69.1% rate. However, as noted last month, that was pretty misleading — and it still is.

The Jets are one of just four teams that have picked up first downs on fewer than half of their completed passes, and the other three teams are a who’s who of ugly quarterback play this year (Ravens, Dolphins, and Giants). The Bears and Browns round out the bottom six, while the Texans (RIP Deshaun Watson) lead the NFL in this metric.

But if first downs per completed pass is akin to yards per completion — an interesting statistic but better used to describe style than competency — than first downs per pass play (including sacks) is the more useful metric (this is similar to Net Yards per Attempt). After all, on a dropback, if a quarterback throws for a first down, it’s a good pass play; if a first down is not picked up, it usually wasn’t a good pass play.

So first downs per pass play (again, including sacks) is a good measure of an offense’s success rate. And you probably won’t be too surprised to see that the Patriots and Saints lead the NFL in that metric this year. Apparently, Tom Brady and Drew Brees are pretty good at keeping their offenses on schedule. The Chiefs, Falcons, and Rams rank in the top 5 in this metric as well.

Let’s use the Patriots line to explain how to read the table below. New England has completed 234 of 346 passes, a 67.6% completion rate that ranks 4th in the NFL. The Patriots have taken 22 sacks but picked up 142 first downs. New England has picked up a 1st down on 60.7% of its completed passes, and 38.6% of its pass plays. That ranks 1st in the NFL, and is the metric by which the table below is sorted. [continue reading…]

{ 3 comments }