≡ Menu

Yesterday, I wrote that NFL rookies were screwed by the CBA negotiated in 2011. Today, some more data on that point.

Using the Approximate Value metric created by PFR, we can calculate what percentage of league-wide AV belongs to each class of players. For example, rookies typically provide just over 10% of all AV in any given season; before the new CBA, that number was just under 10%. And when you combine rookies with 2nd, 3rd, and 4th year players, those players are responsible for just about half of all NFL value. Given that some 5th year players are also on their rookie contracts, it’s safe to say that about half (if not more) of all AV is provided by players on their rookie contracts.

The graph below shows, in a blue line, the percent of AV provided by players in their first four seasons.  The orange line shows the percent of league-wide AV provided by rookies.

We don’t see an enormous switch post-2011 from vetearns to rookies, just a slight one. Players in their first three seasons produced 33% of all AV from 2006-2010, which jumped to 36% over the last five years. But the bigger point is just that football is, and has always been, a young man’s game.

{ 8 comments }

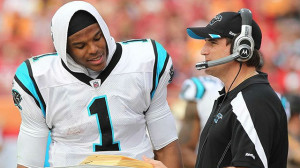
Rookie contract Cam sees how little he is making.

On July 28, 2011, proven NFL veteran Kevin Kolb was traded from Philadelphia to Arizona, and signed a five-year contract worth a maximum of $63.5 millon, with $21 million guaranteed. He was cut after two seasons, but still received $30M from the Cardinals.

The next day, unproven rookie Cameron Jerrell Newton signed a completely fair 4-year, $22M contract, with a team option for a fifth year at a cost-controlled rate. No really, it was completely fair, at least according to Pro Football Talk: [continue reading…]

{ 8 comments }

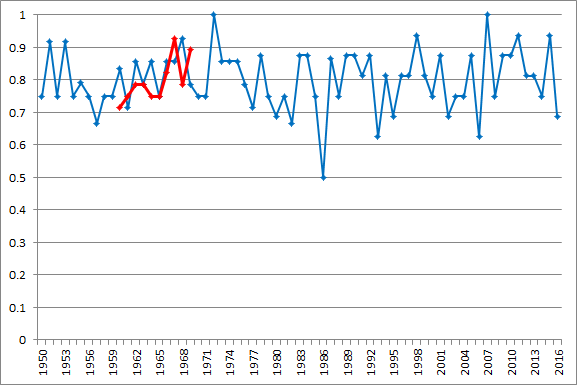
Yesterday, I looked at Hall of Fame quarterbacks and All-Pro voting. In that post, I looked at all All-Pro nominations, but today I will limit this to just Associated Press first-team selections. The graph below shows the team winning percentage for AP 1AP quarterback’s team in each year since 1950. In red, I have also included the AFL AP 1AP team’s winning percentage:

[continue reading…]

{ 18 comments }

Eli Manning and the HOF, Part 2

The common argument for why Manning should make the Hall of Fame is that he and the Giants won two Super Bowls, knocking off the legendary Patriots both times. And in the modern era (i.e., ignoring Tobin Rote), only Jim Plunkett has won two Super Bowls and not made the Hall of Fame.  That’s true, but it’s also a wildly misleading way of looking at things.  If you want to argue that Manning should make the Hall of Fame, that’s a good way to frame your argument, but that’s thinking more like a defense attorney and less like a judge.

Here’s another way to think about it: every single quarterback in the Hall of Fame has been named a first-team All-Pro at least once in their career, except for one quarterback.  And that one quarterback was a no doubt Hall of Famer who also won an MVP trophy.

Two years ago, I wrote about how — statistically speakingEli Manning’s Hall of Fame case falls far short. Today, let’s look not at statistics, but at how sportswriters (i.e., those people who vote for things like the Hall of Fame) viewed these quarterbacks during their careers.  If you include Tom Brady, Aaron Rodgers, Drew Brees and Peyton Manning, there are 29 Hall of Fame quarterbacks who entered the NFL in the last 70 years.

Of that group, 16 have been named an MVP by the Associated Press: Peyton Manning (5 times); Johnny Unitas (3); Brett Favre (3); Joe Montana (2); Steve Young (2); Tom Brady (2); Aaron Rodgers (2); Kurt Warner (2); Dan Marino (1); Fran Tarkenton (1); Y.A. Tittle (1); Ken Stabler (1); Bart Starr (1); John Elway (1); Norm Van Brocklin (1); and Terry Bradshaw (1). [continue reading…]

{ 129 comments }

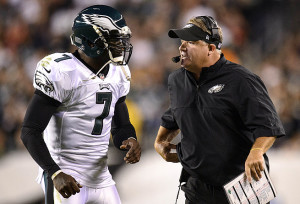
The most talented quarterback Kelly got to work with was a 33-year-old Vick

During Chip Kelly’s up-and-down NFL tenure, he started six quarterbacks across four seasons and two teams.  Nick Foles started 18 games for Kelly’s Eagles, the most of any quarterback; Sam Bradford started 13, Colin Kaepernick 11, Mark Sanchez 10, Michael Vick 6, and Blaine Gabbert 5. If that doesn’t sound like the greatest collection of quarterbacks to you, well, you’re right. Gabbert and Foles were terrible when not coached by Kelly, and Bradford has a career 0.408 winning percentage in games without Kelly.

The other three have winning records without Kelly, but there are other circumstances to consider. Sanchez won 53.2% of his games with the Jets, but his winning percentage in non-Kelly games were heavily inflated by the Jets supporting cast. Vick was 33 years old by the time Kelly came to Philadelphia, with his best days behind him. And Kaepernick? Well, he was on a significant decline before Kelly arrived in San Francisco, and his political stance may have impacted his style of play in 2016.
[continue reading…]

{ 8 comments }

Adam On Depression

Regular readers know Adam Harstad, a longtime friend and co-writer of mine at Footballguys.com. Adam, who is known as the second-best trivia expert on the FBG staff, is a frequent guest poster here and a good follow on @AdamHarstad.

If you’re curious about a look behind the Football Perspective posting curtain, I write most of my articles in the morning. I spend an hour between waking up and going to the gym where I catch up on life things and also draft an article for this site.

Today, I didn’t have time to do that. That’s because I was busy reading Adam’s article (posted on his own site) about depression.  It’s a long article (here’s the executive summary) but that’s a feature, not a bug.  Adam put together a very revealing and thoughtful bit of writing about a really serious and important topic. I am no expert on mental health, but I know depression is bad for at least two reasons: a lot of people suffer from it, and it has an enormous impact on those suffering from it.

It’s not easy to expose yourself to the world the way Adam has, and I commend him for it. Even more impressive: Adam admits and acknowledges that he hasn’t won, but that posting this article is part of his process in trying to overcome depression.  He said that public shame is a powerful motivator, and posting this would perhaps help him in this battle.  So if me posting this helps him help himself, hey, I’m happy to.

I also wanted to post it here to show Adam that we all support him, even if he knows that already.  And I’m sure there are other FP readers  dealing with depression in all of its stages and depths, so  I think reading Adam’s story can be helpful. If you have the time, I encourage you to read Adam’s article in full. And if you don’t have the time, I really encourage you to read his article in full. Again, I’m no mental health expert, but I think people dealing with depression find comfort in knowing that they’re not a lone, and that lots of people deal with depression.  And if you’ve come this far and are still wondering, yes, today’s post was really just a ploy to remind Adam that I’m better than him at trivia.

So today, maybe leave a nice note for Adam in the comments or on his twitter feed.  Or maybe you have some knowledge to share on mental health and depression. I trust you guys to help each other out.


{ 11 comments }

Today’s guest post comes from hscer, a frequent commenter here at Football Perspective. Hscer is starting a project on his website, MVPQB.Blogspot.com, where he is working on his most valuable quarterback for each season since 1951. Here’s a sample chapter today: as always, we thank our guest posters for their contributions.


“When Fifth is First” – Maybe fifth is unkind to Gannon’s 2000 season, but he certainly wasn’t the best or even top three.

The Stats

Let’s begin with a look at the stats from six of the top quarterbacks from 2000: Rich Gannon, Peyton Manning, Daunte Culpepper, Kurt Warner, Jeff Garcia, and Brian Griese.

QuarterbackCmp-Att-(%)-YdY/ATDINTPassRtSk-SkYdANY/AW-L4Q/GWRshYd-Rsh-YPC-TDFumDYARDVOA
Gannon (AP1)284-473-(60.0%)-34307.25281192.428-1246.7312-43/4529-89-5.9-49105221.4
Manning (MVQB)357-571-(62.5%)-44137.73331594.720-1317.2210-62/3116-37-3.1-15188838.3
Culpepper297-474-(62.7%)-39378.3133169834-1817.2811-53/4470-89-5.3-711135230.1
Warner235-347-(67.7%)-34299.88211898.320-1157.978-31/217-18-0.9-0492328.0
Garcia355-561-(63.3%)-42787.63311097.624-1557.346-100/0414-72-5.8-47164231.8
Griese216-336-(64.3%)-26888194102.917-1397.797-30/1102-29-3.5-15106234.7

The Argument

Gannon’s win here is baffling when you look at the stats in this context: he ranks 5th in DYAR, and 6th in Y/A, ANY/A, Passer Rating, and DVOA. So why did the Associated Press, along with Pro Football Weekly / Pro Football Writers of America and The Sporting News select Gannon as their first-team All-Pro quarterback?

Well, four teams went 12-4 or better, including Gannon’s Raiders. The other three teams had Kerry Collins, Steve McNair, and the
Tony BanksTrent Dilfer combo at quarterback, and Gannon had the best numbers of that group. But even for media types, it usually takes a little more than wins to clinch these awards. McNair, with 2847 yards and 15 TD on the 13-3 defending AFC Champion Titans, was likely not considered by anyone. [continue reading…]

{ 30 comments }

Why Haven’t We Improved At Making NFL Predictions?

Yesterday, we looked at the biggest “covers” in NFL history: those games where the final score was farthest from the projected margin of victory. In a 2010 game in Denver, the Raiders were 7-point underdogs, but beat the Broncos by 45 points. That means the point spread was off by 52 points, the most in any single game.

The first year we have historical point spread data was in 1978. That year, the average point spread was off by (or the average amount of points by which the favorite covered by was) 9.9 points. That number probably doesn’t mean much to you in the abstract, so let’s give it some context. From 1978 to 1982, the average point spread was off by 10.4 points. Over the last five years, the average point spread has been off by… 10.3 points.

Now I’m not quite sure what you expected, but isn’t that weird? In 1978, Vegas bookmakers were using the most rudimentary of models. Think of how farther along we are when it comes to football analytics than we were four decades ago. All of that work, of course, has to have made us *better* at predicting football games, right?

But don’t these results suggest that we are not any better at predicting games? If Vegas was missing games by about 10 points forty years ago, why are they still missing games by about 10 points? One explanation is that the NFL is harder to predict now, which… well, I’m not so sure about that. After all, even if you think free agency and the salary cap bring about parity (which is a debatable position regardless), it’s not like the lines are more accurate later in the season once we know more information. Games are also slightly higher scoring, and you could make the argument that we should be measuring how far games are off by as a percentage of the projected over/under?

Let’s look at the data. The graph below shows in blue the average “cover” in each game for each year since 1978.  As it turns out, 2016 was a really good year for Vegas — the average cover was just 9.0 points, which ranks as the most accurate season ever.  However, there’s no evidence that this was anything more than a one season blip: 2013 and 2015 were average years, and 2014 was the least accurate season ever.  It’s not like our prediction models just started getting sophisticated last season.

For reference, in the orange line, I have also shown the average point spread for each game.  That line has also been pretty consistent over time, with the average spread usually being just above 5 points. [continue reading…]

{ 15 comments }

Biggest Covers In Vegas History (1978-2016)

Last week, I noted that the Colts/Vikings game was the least-conforming game of the 2016 season. Here’s what I wrote then:

The Colts were 0.2 points per game better than average last year, as measured by the Simple Rating System (which takes the points scored and allowed in each game, and adjusts for opponent strength and home field advantage).

The Vikings were 0.9. points per game better than average in 2016, and hosted the Colts in week 15. Given those facts, we would expect Minnesota to have won by 3.7 points. Instead, Indianapolis upset the Vikings, 34-6, beating the expected line by 31.7 points. That was the least-conforming game of 2016.

Well, it wasn’t just the SRS that found that game to be pretty odd. Our friends in the desert expected the Vikings to win by 5 points, which means the Colts covered the point spread by a whopping 33 points.  Two weeks earlier, Indianapolis was actually an underdog in a Monday Night Football game that you would have had to been an idiot to attend in person.  The Colts were 1-point underdogs, but won by 31 points, giving Indianapolis a 32-point cover.  Those were two of the three biggest covers of the year, with the Eagles 34-3 win over Pittsburgh as 3.5 point underdogs (+34.5) being the biggest cover of 2016.

At Pro-Football-Reference.com, we have points spread data going back to 1978. Below are the biggest covers in history: [continue reading…]

{ 2 comments }

Today’s post is an outside the box thought experiment.  I’d love to hear your thoughts on whether this could actually work for an NFL team.

There’s nothing more valuable in the modern NFL that a good quarterback on a rookie contract. Despite that golden rule, teams are not wont to spend multiple draft picks on quarterbacks in the same draft. Since the new CBA was adopted in 2011, only two teams have spent two picks on quarterbacks in the same draft, and no team has used three.

Famously, Washington selected Robert Griffin with the second overall pick in 2012 and then drafted Kirk Cousins early in the fourth round.  That second decision turned out to be a brilliant move by the Redskins in retrospect, even if many criticized that plan at the time.  The other example was in that same draft: Indianapolis selected Andrew Luck with the first overall pick, and took Chandler Harnish with the last overall pick. [continue reading…]

{ 37 comments }

The top QB/WR duo by touchdowns, and another top-10 combo.

Three years ago, I looked at the top quarterback/receiving pairings in terms of total passing touchdowns between the two players. Per a comment suggestion, let’s update that list today. The top two pairs have not changed, but there has been some movement in the top ten.

Philip Rivers and Antonio Gates have now connected for 84 passing touchdowns, all of which came in the regular season. The list below includes the playoffs, and Young and Rice have combined for 85 regular season touchdown passes and 7 playoff scores. That means Rivers and Gates are two more touchdowns away from the second most regular season touchdowns in NFL history. Gates is tied for 6th all time in receiving touchdowns (111) with Tony Gonzalez: despite that, Gates has connected with a touchdown more often with Rivers than Gonzalez has with both Matt Ryan and Trent Green combined.

There’s another tight end duo creeping up the list: Tom Brady and Rob Gronkowski have connected for 76 touchdowns, tied for fifth place on the list. Also at 76 touchdowns: Marques Colston and Drew Brees. The interesting note there: Colston retired without ever catching a touchdown pass from anyone besides Brees.

The table below shows the full list for combinations that have at least 25 touchdown strikes: [continue reading…]

{ 22 comments }

Is Week 1 Really An Outlier?

Week 1 always seem to have some really rare results. Last year, the 2-14 49ers won 28-0 in the late MNF game on opening weekend. The Redskins finished last year with a winning record, but lost at home by 22 points to the Steelers, easily Washington’s worst performance of the season. And the Falcons won the NFC last year, but you wouldn’t have known that watching week 1: Atlanta lost at home to Tampa Bay.

In 2015, the Titans blew out the Bucs, 42-14, in the season opener; Tampa Bay finished the year 6-10, while Tennessee went 3-13. And the 49ers, who wound up going 5-11, again were week 1 superstars: in 2015, San Francisco shocked the 11-5 Vikings, 20-3, on Monday Night Football.

Many of these characters were part of the shocking week 1 results in 2014, too. That year, the 49ers beat the Cowboys in Dallas, 28-17: Dallas finished tied with the best record in the league, while San Francisco went 8-8. The Titans, as they did in 2015, were week 1 superstars in 2014: despite going 2-14, Tennessee beat the 9-7 Chiefs, 26-10, on opening day. And the Vikings and Rams show up here, too: in 2014, Minnesota won in St. Louis, 34-6, in week 1; both teams went 6-9 the rest of the year. Oh, and Miami upset the Patriots in week 1; New England won the Super Bowl, while Miami missed the playoffs.

So is week 1 really an outlier? Well, for the 49ers it obviously has been. The last three years, based on expected results (using location-adjusted SRS ratings to predict final scores), San Francisco has exceeded expectation by over 20 points in each of its last three week 1 games. But there are also teams like the Jaguars. In week 1, 2016, Jacksonville lost at home to Green Bay by 4 points, and Jacksonville finished about 8 points behind the Packers in the SRS. In 2015, the Jaguars lost by 11 at home to the Panthers in week 1, and finished about 15.5 points worse than Carolina. In 2014, Jacksonville lost by 17 in Philadelphia in week 1, and finished 2014 a little over 14 points worse than the Eagles in the SRS. In other words, Jacksonville’s week 1 performance came within 2 points of expectation — based on the full season results — in each of the last three years. [continue reading…]

{ 8 comments }

The Greatest Runners-Up In History

Lost to the eventual champion in 8 straight seasons

Happy Independence Day, folks. July 4th, 1776 was the day our forefathers declared independence in a remarkable document that’s worth your full read.  What’s known in America as the Revolutionary War began in earnest in 1775, reached ***official*** status as a revolution on this day in 1776: that was when the Declaration of Independence was adopted by Congress.  Seven years later, the British surrendered, and the war is still known there as the American War of Independence.  But let’s not give the British too much grief: after all, Britain was the runner-up in the Revolutionary War, which earns them a silver medal in that competition.

So today, let’s look at the best runners-up in NFL history. Two teams have lost in the playoffs to the eventual champion in four straight years.

1990-1993 Bills; 1967-1970 Raiders (4)

The early ’90s Bills famously lost in four straight Super Bowls, to the Giants, Redskins, and then twice in a row against the Cowboys.  But Buffalo isn’t the only team to lose to the Super Bowl champion four years in a row: the Daryle Lamonica/Willie Brown/Gene Upshaw/Jim Otto Raiders pulled off that in the final three years of the AFL and the first year of the post-merger NFL.

In 1967, Oakland made it to the Super Bowl, but lost to the Packers. In 1968, Oakland staged a classic game against the Jets for the AFL title before New York upset the Colts in Super Bowl III. In 1969, the Raiders went 12-1-1 and led the AFL in points, yards, passing yards, passing touchdowns, and yards per attempt. In the playoffs, Oakland beat Houston 56-7, but fell to the Chiefs, 17-7, in the AFL Championship Game. Then in 1970, the Raiders again were on the doorstep of the Super Bowl, but lost 27-17 to the Colts in the AFC Championship Game. [continue reading…]

{ 2 comments }

The Titans Played To Their Opponents In 2016

The Tennessee Titans were weird last year. On paper, the toughest game of the season would have been a week 15 contest in Arrowhead Stadium. And, on paper, the easiest game of the year would be a week 6 home game against the Browns. And yet against both Kansas City and Cleveland, the Titans won by 2 points.

The Titans won one game by more than 14 points last year: would you have guessed it was a 22-point win over the NFC North Champion Packers? Perhaps even more surprising: Tennessee lost one game by double digits in 2016, a 38-17 thumping put on them by… the Jaguars?

It should go without saying that teams tend to play better against bad teams and worse against good teams. But the Titans were a pretty big outlier last year. The table below shows each of the Titans games last year. The table is sorted by the “SOS+HFA” column, which shows the home field adjusted team rating of each opponent. The Chiefs had an SRS rating of +5.6, so playing at Kansas City goes down as a +8.6. The Colts were at +0.2, so playing in Indianapolis is a +3.2, while hosting the Colts is at -2.8. [continue reading…]

{ 4 comments }

Yesterday, I looked at the least-conforming games of the season. I used the SRS to derive opponent-adjusted team ratings, and then came up with a predicted point spread (based on those team ratings and the location of the game) for each game in 2016. By definition, the amount by which each team will exceed its expected points in “overachieving games” will equal the amount by which it fell short of its expected points in “underachieving games.” Since we are just manipulating the 16-game sample, a point by which a team overachieves in one game has to come from another game.

But what we can do is take the absolute value of the difference between the expected margin of victory and actual points differential to get a sense of how consistent or inconsistent each team was last year. And by that measure, the most consistent team was the New York Giants. In 13 of 16 games last year, the final margin came within a touchdown of expectation, and in 3 of 16 games the final margin came within one point of expectation.

The table below shows how to calculate these ratings. Let’s use week 1, which happens to have been one of the rare Giants games that went off script. [continue reading…]

{ 1 comment }

The Colts were 0.2 points per game better than average last year, as measured by the Simple Rating System (which takes the points scored and allowed in each game, and adjusts for opponent strength and home field advantage).

The Vikings were 0.9. points per game better than average in 2016, and hosted the Colts in week 15.  Given those facts, we would expect Minnesota to have won by 3.7 points.  Instead, Indianapolis upset the Vikings, 34-6, beating the expected line by 31.7 points.  That was the least-conforming game of 2016 (you can view the least-conforming games of 2015 here).

The table below shows all 512 regular season games from 2016, and how it differed from expectations. Here’s how to read the first line. The second-least conforming game was came in week 3, and we can use it to help guide us through the table below. The Eagles hosted the Steelers, and Philadelphia had an SRS rating of +3.7, while Pittsburgh had an SRS of +4.7. As a result, we would expect the Eagles to lose by 2 points. Instead, they won 34-3, exceeding expectations by 29 points.
[continue reading…]

{ 1 comment }

Today’s guest post/contest comes from Thomas McDermott, a licensed land surveyor in the State of California, a music theory instructor at Loyola Marymount University, and an NFL history enthusiast. As always, we thank him for his hard work. You can view all of his work at Football Perspective here.


If you can get five people in a room to agree on what a sports dynasty is, you’ll probably have achieved the most miraculous agreement in history since the Congress of Vienna. We know a sports dynasty when we see one (the current Patriots, the New York Yankees, 1990s Bulls, etc.), but it becomes less clear once we attempt to actually define it:,When does the dynasty start? How long must it last? What are the requirements?

In this article on NFL dynasties, FiveThirtyEight does a nice job of negotiating the quagmire by just listing the “best team over any number of years”. [1]Their definition of “best” being their ELO ratings. I’m going to do the same thing here, but focusing solely on NFL defenses since the merger (regular season only). The metric is points allowed by the defense (meaning: fumble, interception, kick and punt return touchdowns, and safeties aren’t included), adjusted for era and strength of schedule (basically, SRS ratings). Regular readers may recall that I published these results back in August 2015. To differentiate this stat from Pro-Football-Reference’s DSRS, I’ll call it “DfSRS”.

Below is a table of defensive dynasties, ranging from 1 to 15 years: [continue reading…]

References

References
1 Their definition of “best” being their ELO ratings.
{ 15 comments }

The Jets, The Giants, And MetLife Stadium

MetLife Stadium opened in 2010. Over that time period, the Jets are 30-26 at home (a hair below-average), while the Giants are 32-24 (right at league average). And, over that same time period, the Jets are 22-34 on the road (slightly below-average), while the Giants are 26-30 in road games (slightly above-average). [1]Note that this includes the two games where the Jets and Giants played at MetLife Stadium; the “road” team won in both games.

So the Jets are +8 in games at MetLife, while the Giants are +6. In home games, the Giants have outscored opponents by 142 points (16th-best), while the Jets have only outscored opponents by 51 points (23rd-best). In road games, the Giants are at -121 (also 16th-best), while the Jets are at -344 points (28th-best).

The Giants had a great year at home in 2016 while the Jets did not; the numbers were much different a year ago, when the Jets appeared to be gaining a much better home field advantage at MetLife than the Giants. That was driven, in large part, by performance in one score games. From 2010 to 2015, the Giants were 8-13 in home games decided by 7 or fewer points, while the Jets are 13-8; that made the Giants one of the worst teams at home in close games, and the Jets were one of the best. But last year, the Giants went 6-1 in home games decided by a touchdown or less, and the Jets went 0-3.

So the conclusion in today’s post? The Jets and Giants are getting about the same home field advantage from MetLife Stadium. That in and of itself isn’t necessarily an important conclusion [2]Although past research showed the Giants may have been better at Giants Stadium. But there are two worthwhile takeaways from this post. [continue reading…]

References

References
1 Note that this includes the two games where the Jets and Giants played at MetLife Stadium; the “road” team won in both games.
2 Although past research showed the Giants may have been better at Giants Stadium.
{ 2 comments }

According to the Pro-Football-Reference.com coaching database, there’s only one man in NFL history that has been, at various points in his NFL career, both an offensive coordinator and a defensive coordinator. Can you name him?

There are some coaches, off the top of my head, who have spent time coaching on both sides of the ball.   Bill Belichick has been heavily involved with the Patriots offense for about a decade (New England didn’t even have an offensive coordinator in 2009 or 2010), and while he never held any official title, he also was the Detroit Lions receivers coach in 1977. Eric Mangini was an offensive assistant for the Browns and Ravens, and also a tight ends coach for the 49ers, while spending time as a defensive assistant (and later head coach) for the Jets, and defensive backs coach and defensive coordinator for the Patriots (he also was the 49ers DC in 2015, his last coaching gig). Juan Castillo has mostly been an NFL assistant on the offensive side of the ball (never serving as an offensive coordinator, however), but he did get surprisingly tapped as the Eagles defensive coordinator in 2011, and worked in that role for a couple of years (well, he was fired in October 2012).

But being both an offensive coordinator and a defensive coordinator in the NFL? That just doesn’t happen. Our mystery coach was a position coach on both sides of the ball in college, including as offensive line coach at SMU in 1976 and 1977. He left the college game to joint the NFL as a scout with the Bucs in ’78.

Then, in 1982, the Patriots hired SMU head coach Ron Meyer, and Meyer picked our mystery man to became the Patriots offensive line coach.  He served under Meyer for his entire tenure in New England, which ended in 1984.  In 1985, he joined Darryl Rogers in Detroit as the Lions offensive line coach, and stayed with the team for four seasons.

While our man was in Detroit, Meyer had been hired as the Colts coach, and Meyer inherited defensive coordinator George Hill. But after the ’88 season, Meyer hired our mystery man to join him in Indianapolis as the team’s defensive coordinator.  At that point, he had no really experience coaching defense other than at Delaware Valley, Rhode Island, and Idaho State, but Meyer nonetheless chose him for the job.  The Colts defense wasn’t great (although it wasn’t terrible, either) in ’89 and ’90, but in ’91, Meyer moved from Indianapolis defensive coordinator to Indianapolis offensive line coach. [continue reading…]

{ 11 comments }

There are currently five head coaches in the NFL that used to be coordinators for the Atlanta Falcons. If you’re a betting man, Steve Sarkisian may be the next to join the list.  Sark was a Pac-12 head coach for six years (four in Washington and two at USC) before spending last season as the Alabama offensive coordinator.  He’s now the 2017 Falcons offensive coordinator, and that’s a pretty good place to be. The last four offensive coordinators for the Falcons — Kyle ShanahanDirk KoetterMike Mularkey, and Hue Jackson — are the current head coaches in San Francisco, Tampa Bay, Tennessee, and Cleveland. Mike Zimmer, the Falcons defensive coordinator opposite Jackson in the Bobby Petrino-doomed 2007 season, is the Vikings head coach, giving Atlanta a league-high five former coordinators who are current head coaches.

In the last few years, the Broncos have had four coordinators go on to become head coaches elsewhere: Jack Del Rio and Adam Gase are the head coaches in Oakland and Miami, while Mike McCoy (San Diego) and Dennis Allen (Oakland) have since been fired. The Ravens have also had four coordinators in the last decade get promoted: Gary Kubiak (Denver) and Rex Ryan (Jets, Bills) are no longer current head coaches, while Chuck Pagano (Colts) and Jim Caldwell (Detroit) are still active head coaches.

In addition to Atlanta, the Bengals are responsible for three current head coaches: the Cincinnati platform lifted Hue Jackson to Cleveland, Mike Zimmer to Minnesota, and Jay Gruden to Washington.

Since 1990

Since 1990, two teams have sent an incredible 9 coordinators to become head coaches of different franchises. For Denver, in addition to the four above, Gary Kubiak, Jim Fassel, Wade Phillips, Mike Shanahan (due to his time as head coach in Washington), and Chan Gailey were all coordinators in Denver since 1990 and then become head coaches elsewhere.

The other team is the 49ers, although all 9 coordinators were in San Francisco from 1991 to 2006. The full list, from most recent to least:
Norv Turner, Mike McCarthy, Jim Mora, Marty Mornhinweg, Pete Carroll, Marc Trestman, Ray Rhodes, Mike Shanahan, and Mike Holmgren.

Fewest

As discussed yesterday, the last Tampa Bay coordinator to become a head coach at another franchise was back in 1984. Each other team has sent at least one coordinator since ’05 on to become the head coach somewhere else.

Since 1990, three teams have vaulted just one coordinator to a head coaching job for another team. The Colts had Bruce Arians as the team’s offensive coordinator (and interim head coach) in 2012, and has been the Cardinals head coach since. For Houston,
the coordinator history has not been great, and Kyle Shanahan (the team’s OC in ’08 and ’09 before moving on to Washington) just became the first one to get a head coaching gig. The final team is Detroit: Dick Jauron was the Lions defensive coordinator in ’04 and ’05 (also serving as interim head coach), before becoming the Bills head coach in ’06.  Detroit and Tampa Bay are the only teams that don’t have a coordinator since ’06 go on to be a coach elsewhere, but with Jim Bob Cooter and Teryl Austin being highly regarded, that could change soon.

The table below shows all offensive and defensive coordinators since 1990 to become head coaches at other teams (ignoring interim head coaches): [continue reading…]

{ 5 comments }

In the Tampa Bay Buccaneers franchise history, they have only had two coordinators become head coaches after leaving central Florida (Dirk Koetter, of course, went from Bucs OC in 2015 to Bucs HC in 2016): Wayne Fontes was the Bucs first ever secondary coach, during the team’s inaugural season of 1976, and he stayed in that role throughout his time in Tampa Bay under John McKay. Fontes was promoted to defensive coordinator in ’82, and led the defense for the final three years of McKay’s tenure.  When McKay retired from coaching after 1984, Fontes nearly got the Tampa Bay head coaching job: when it went to Leeman Bennett instead, Fontes went to Detroit to become the Lions defensive coordinator.  From there, he got promoted to interim head coach in 1988, and became the team’s head coach on a full-time basis beginning in 1989.

McKay also had another young assistant turn into a head coach: Joe Gibbs.  The Hall of Fame head coach famously coached under the great Don Coryell in both St. Louis (as running backs coach from ’73 to ’77) and San Diego (as offensive coordinator in ’79 and ’80), along with the San Diego State Aztecs in the ’60s.  So how did Gibbs wind up in Tampa Bay?

Well, the Cardinals lost their final four games in 1977, Coryell was hired and planned to the the year off from coaching (that didn’t entirely work out). That left Gibbs without a job in ’78, but the timing was right: Gibbs coached under McKay at Southern Cal in 1969 and 1970, and since the Bucs were looking for an offensive coordinator, the timing worked out nicely.  Gibbs was instrumental in Tampa Bay drafting Doug Williams that year, and the rookie was an above-average passer in 10 starts.  After the year, Gibbs reunited with Coryell in San Diego for two seasons before building his legacy in Washington.

Incredibly, though, Fontes and Gibbs are the only two coordinators in Tampa Bay history to go to become head coaches. Take a look: [continue reading…]

{ 13 comments }

In 5 years, one of Tom Brady, Peyton Manning, and Drew Brees will be the all-time leader in passing touchdowns. Currently, Manning is the passing touchdown king with 539 touchdowns, but will Brees or Brady catch him?

A year ago, I wrote about the fascinating touchdown race between Brady and Brees: at the end of the 2015 season, both had thrown 428 career touchdown passes. Last year, Brees threw 37 while Brady threw 28 in 12 games, so Brees is currently up 9 on Brady, 465-456.

But when I measured Brees and Brady last year, I measured them by calendar year. Both threw their first touchdown pass in 2001, so I thought a calendar year-by-year chart would be cool. But it probably makes more sense to compare the passers year-by-year by age, as I did yesterday with Brees and Manning for passing yards. That’s because Brees is about a year and a half younger than Brady (in turn, Brady is about a year and a third younger than Manning, but we haven’t compared them by calendar year).

So if we plot their passing touchdowns by age, Brees appears to have a huge leg up on Brady. That is, unless Brady plays until he’s 45: [continue reading…]

{ 107 comments }

Drew Brees didn’t get much of a headstart on his way to becoming the NFL’s all-time leader in passing yards. As you know, Peyton Manning is the current leader in that category, having retired with 71,940 passing yards.  Manning and Brees both entered the NFL at the age of 22, but Manning started 16 games as a rookie, while Brees played in just one game.  Young Manning was also a bit better than young Brees: that fact, combined with Manning’s 3,518-yard edge as rookies, and Brees missing 5 games at the age of 24 gave Manning a huge early lead.

Thru ages 26, 27, and 28, Manning had a lead of over 8,000 yards on Brees.  But beginning at age 29, Brees started to fight back.  Through age 34, Manning’s lead had dwindled to 3,747 passing yards, though they remain the only two players with over 50,000 passing yards through age 34.  Manning would miss all of his age 35 season with his neck injury, which allowed Brees to finally pass him and become the career leader in passing yards through age 35.

Since then? Well, Brees continues to match Manning, even putting up his own 5,000-yard season at age 37, which is what Brees was in 2016.  For Manning, age 37 was his last great season, age 38 was his last good season, and age 39 was his final year, where he threw for just 2,249 yards.  In other words, if Brees has made it this far, the tough stuff is done: exceeding Manning’s production through age 37 was the hard part.

The graph below shows each player’s career passing yards through X. It’s color-coded by team, showing Brees’ time with the Chargers and Saints, and Manning’s with the Colts and Broncos.  As you can see, Brees has had the edge on Manning over the last three seasons: [continue reading…]

{ 19 comments }

Pythagenpat History, 1960-2016

Yesterday, I looked at Pythagenpat records in 2016. Today, let’s look at the Pythagenpat records for each team since 1960. [1]Note that since today’s dataset covers a much longer period, I used 0.255 as the best-fit exponent to determine what exponent used for each team. More explanation available here. The table below shows the following information for all 1,613 teams since 1960:

The top team by Pythagenpat winning percentage was the 1962 Green Bay Packers, who scored 415 points and allowed just 148 points. That translated to a 0.929 winning percentage, and an even better 0.934 Pythagenpat Winning Percentage. The Packers therefore “underachieved” by 0.005, which ranks as the 851st best difference since 1960. The team’s main passer (by attempts) and coach (by games) were Starr and Lombardi, of course.
[continue reading…]

References

References
1 Note that since today’s dataset covers a much longer period, I used 0.255 as the best-fit exponent to determine what exponent used for each team. More explanation available here.
{ 8 comments }

2016 Pythagenpat Records

If you’re not familiar with how to calculate Pythagenpat records, you can read this post.

But the short version is, this is a slight upgrade on using Pythagorean records, which I assume most of you are familiar with. The formula to calculate a team’s Pythagorean winning percentage is always some variation of:

(Points Scored^2) / (Points Scored ^2 + Points Allowed^2)

Here, instead of using 2 as the exponent, we use a dynamic exponent that changes based on how much scoring occurs in each team’s games. Here are the 2016 Pythagenpat records: [continue reading…]

{ 5 comments }

Superman Eddie Price

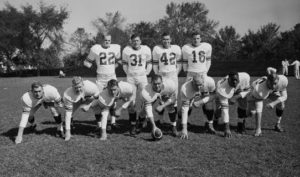
Eddie Price, wearing 31 for the Giants

Even the most hardcore of NFL fans probably haven’t heard of former Giants running back Eddie Price. His career totals — 3,292 rushing yards, 24 touchdowns, 672 receiving yards — are unimpressive; his football career was anything but.

In 1942, Price was considered perhaps the best high school football prospect in the country, but World War II prevented him from being part of the next great super team at Notre Dame. Instead of going to play for Frank Leahy and the Fighting Irish, Price reported to New Orleans for his service. After the war, he stayed in New Orleans and attended Tulane, and helped power one of the best teams in school history. Price played at Tulane in the late ’40s and was a superstar:

He became the first Green Wave player to rush for more than 200 yards in a game, the first to top 1,000 yards in a season and the first in NCAA history to surpass 3,000 yards for his career.

He was named an All-American in 1949 and was twice named All-SEC. He also set the SEC rushing record with 1,178 in 1949. Price nearly beat his record in 1950 with 1,137 yards and his 1949 mark stood unbroken for 27 years.

Price’s career at Tulane was legendary. In his first collegiate game, he had a 103-yard kickoff return against Alabama for a touchdown that led to a 21-20 upset. He later helped Tulane beat the Crimson Tide in ’48 and ’49, too. In fact, Price was so dominant in his three years with the Green Wave that he retired as the NCAA’s all-time leading rusher with 3,095 yards.  He helped Tulane beat LSU by the score of 46-0 in 1948 by rushing for 116 yards and two scores; the Louisiana schools used to face off every year, but the Green Wave didn’t beat the Tigers again until 1973.  As a senior, Price led the NCAA in yards per carry.

In 1950, Price was the 20th player selected, going in the second round to the Giants. And that’s when he really took off.  As a rookie, he led the NFL in rushing yards per game at 70.3. Price missed two games, but otherwise had a magnificent rookie season: he finished the season with 145 yards, 156 yards, and 103 yards rushing in three of the Giants final four games. [continue reading…]

{ 20 comments }

In general, sack data for team defenses is not super consistent from year to year. Since 1990, the correlation coefficient between sack rate (for defenses) in Year N and sack rate in Year N+1 is 0.27. The best-fit formula (using a linear regression cover the years from ’90 to ’16) to predict sack rate for next year would be to use a constant of 4.8%, and then add 26% of the defense’s sack rate from the prior season.

That’s not too surprising of a result, but I was curious whether adding  each team’s concentration index would help make sacks more predictive. As it turns out, the answer is a little complicated. I ran the same regression as above, but used each defense’s concentration index as a second variable.  The change didn’t improve the correlation at all, and the p-value on the concentration index variable is 0.65, making it essentially meaningless.  But it may be a little more complicated than that.

The team with the biggest decline since 1990 in sack rate, year over year, is the 2008 Chiefs. In ’07, Kansas City had a sack rate of 7%, the 8th-highest in the NFL. In 2008, it dropped to just 2%, the lowest in modern NFL history. And in 2007, Kansas City had the second most concentrated pass rush in the NFL, largely based on Jared Allen and his 15.5 sacks.  In ’08, Allen was in Minnesota, and the Chiefs didn’t have a single player more than three sacks.  This makes perfect sense: KC’s pass rush was very good in ’07 but centered around a superstar defender; without him the next year, the pass rush fell apart.

Sounds simple, right? Except that’s just one example.  In 2000, the Titans had the 2nd best pass rush but just the 28th most concentrated: six Tennessee defenders had at least four sacks, and another six had at least two sacks, while Jevon Kearse and his 11.5 sacks made up just 21% of the team’s sacks.  This sounds like a diverse pass rush that should be more sustainable from year to year, but in ’01, the team’s sack rate basically fell in half.

Analyzing sack data is very complicated: you have to factor in regression to the mean, Game Scripts, and also the randomness involved with something that only happens once every 15 or so passing plays. That said, the table below shows the 50 teams with the most concentrated pass rushes since 1982. In other words, these were the teams that were built around just one or a handful of elite pass rushers: [continue reading…]

{ 2 comments }

Concentration Index and Defensive Sacks

Are sacks more highly concentrated among a few players now? Look at the 2016 Raiders: Khalil Mack, who won the Defensive Player of the Year award by one vote over Von Miller, had 11 sacks. But Mack and Bruce Irvin (7.0 sacks) were the only Oakland defenders to record more than three sacks last year, and only six Raiders finished the year with a sack. In Atlanta, Vic Beasley led the NFL with 15.5 sacks, but only eight other Falcons had a sack, and no other Falcon had more than five. Meanwhile, the ’86 Oilers had 17 players record at least one sack and no player with more than five sacks!

In 2014, J.J. Watt had 20.5 of Houston’s 38 sacks. And in 2012, Aldon Smith had just over half of the 49ers sacks, too. But are things really getting more concentrated? Memory can play tricks on us: after all, in 1989, Tim Harris had 19.5 sacks for the Packers, which represented 57% of all Green Bay sacks that year.

As it turns out, the Raiders and Falcons weren’t great examples to measure the modern NFL. They were the two most concentrated teams in the NFL last year in terms of sacks. Let’s look at the Raiders sack totals more closely, and use the same methodology we’ve used the last few days (also known as the Herfindahl index): [continue reading…]

{ 5 comments }

RBBC, Rushing Concentration, and Outliers

In 1984, James Wilder had 407 carries for Tampa Bay at a time when the league was only beginning to shift away from running back by committee. In fact, by the end of the ’84 season, three of the highest single-season carry totals in NFL history had taken place that year, with Walter Payton and Eric Dickerson joining Wilder as true workhorses. The ’84 Bucs had the most concentrated rushing attack of any team in an era of increasingly concentrated rushing attacks.

Take a look: in ’84, Wilder had 1,544 rushing yards, which represented 86.94% of all Bucs rushing yards. The square of that is 75.58%; sum the squares of all players who gained rushing yards for Tampa Bay last year, and you get a concentration index of 75.87%.

PlayerRushYdsPercSqrd
James Wilder407154486.94%75.58%
Steve DeBerg28593.32%0.11%
Mel Carver11442.48%0.06%
Jack Thompson5351.97%0.04%
Adger Armstrong10341.91%0.04%
Michael Morton16271.52%0.02%
Gerald Carter1160.9%0.01%
Scott Dierking3140.79%0.01%
George Peoples120.11%0.00%
James Owens110.06%0.00%
Total4831776100%75.87%

James Wilder was a one man offense

That was a truly remarkable number in the historical context of 1984. It crushed an NFL record set just one year earlier: the ’83 Rams, with a rookie Dickerson, had a rushing concentration index of 65.95%. Only one other team – the ’81 Oilers — had a concentration index of over 60% when the Bucs hit 76% in 1984.

The average team had a rushing concentration index of 35.5%, and the standard deviation among the teams in 1984 was 13.7%. As a result, Tampa Bay’s rushing concentration index was 2.96 standard deviations above average, known as the Z-Score. That was the 2nd most concentrated score from 1946 to 1984, snugly fit in between the 1966 Patriots (2.93) and 1967 Patriots (2.97).

In 1966, the Patriots led the AFL in rushing attempts and featured a two-back offense with Jim Nance (299 carries) and Larry Garron (101 carries). But since Nance averaged 4.9 yards per carry and Garron just 3.2, Nance wound up rushing for about 74% of the Patriots rushing yards that season. In ’67, New England ran less often, but Nance took a larger share of the load. He had 269 carries to Garron’s 46, and had 76% of all Patriots rushing yards in a very RBBC-centric era. From ’66 to ’67, Nance wasn’t just the top RB in the AFL but in all of pro football. Thanks to his heavy workload, he easily outrushed two HOF RBs in the primes of their career during those seasons.

The table below shows each team that had a Z-Score of at least 1.25 in rushing concentration. Here’s how to read it. In 1991, the Cowboys behind Emmitt Smith had 1,726 rushing yards. [1]This excludes any player who finished the season with negative rushing yards. The squared result of each player’s percentage — i.e., the concentration index — was 82.3%. The standard deviation among all teams that year was 13.9%, and the league average was just 33.9%, giving the ’91 Cowboys a Z-Score of 3.48. In other words, the ’91 Cowboys’ rushing attack was so concentrated for that season that it was 3.48 standard deviations above average. That’s why it ranks 1st in this metric. [continue reading…]

References

References
1 This excludes any player who finished the season with negative rushing yards.
{ 6 comments }

Three years ago, I looked at the single-season leaders in percentage of team rushing yards. Then and now, the top two seasons belonged to Edgerrin James: he had 94% and 92% of the Colts rushing yards in his first two seasons in the league. There were only three other seasons where a running back had at least 90% of his team’s rushing yards: Emmitt Smith in 1991, Barry Sanders in 1994, and … Travis Henry in 2002. In that post, I calculated for each team the percentage of his team rushing yards gained by that team’s top rusher. Then I calculated the league average percentage gained by each team’s top rusher, and plotted how that varied over time. This was intended to measure how running back back committee centric the league was in each year.

For a less rigorous method to measure RBBC-ness, you can see this post, which looked at games with more than 15 carries.

Both methods show RBBC being heavy in the ’70s, and the stud RB era peaking about 10 years ago.  But if you want to measure rushing concentration, a better method is probably to use the formula described yesterday. So for each team, I calculated the percentage of team rushing yards gained by every player on the team, squared that result, and then summed those numbers for each player on the team. You can read yesterday’s post for more info on the methodology, but here were the results for 2016: [continue reading…]

{ 9 comments }