≡ Menu

Today’s guest post comes from Damon Gulczynski, a longtime reader, Seattle sports fan, and part-time writer. He also wrote this book on baseball names. As always, we thank our guest posters for contributing.


A journeyman quarterback appears here

When the New York Jets exercised an option to void the contract of quarterback Ryan Fitzpatrick in February, they paved the way for yet another stop on his already lengthy tour through the cities of the NFL.  If the hirsute Harvardian plays in at least one game this upcoming season with a new team, it will mark the seventh time he has done so.  To my knowledge, this would tie the all-time record among NFL quarterbacks.  That is, unless his replacement in New York takes a snap before him.  Josh McCown has already played with seven different NFL teams; the Jets will be his eighth.

At this point, both McCown and Fitzpatrick have surely already attained the venerated title of “journeyman,” but it goes beyond this.  I contend that by the end of the 2017 NFL season, McCown and Fitzpatrick will be the two journeyman-est quarterbacks in NFL history.  To support this contention, I introduce a new metric I developed called Journeyman Score (JM score). [continue reading…]

{ 23 comments }

Games Are Closer Than Ever Now

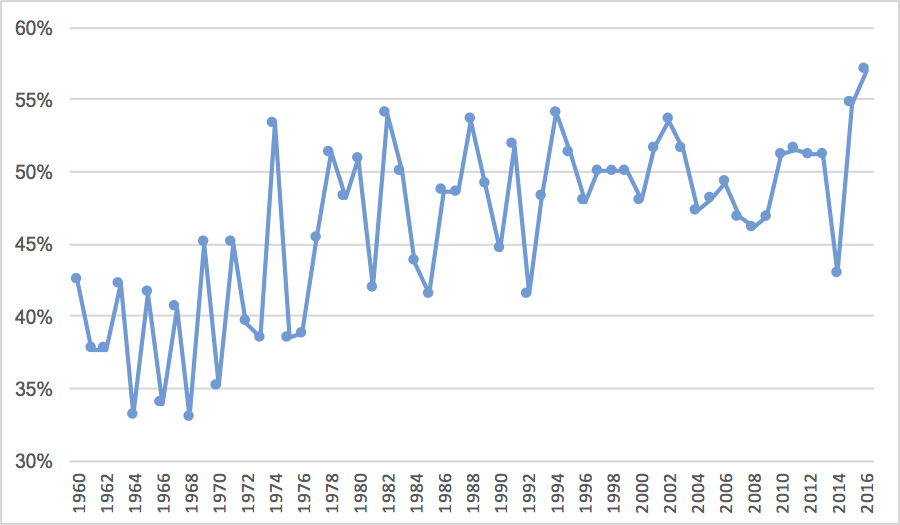
In 2016, 146 of 256 regular season games finished with a margin of victory of 8 or fewer points. That’s an incredible 57.0% of all games being decided by one score, which makes the 2016 season one of the most competitive in NFL history. If not the most competitive. In 2015, 54.7% of all games were decided by 8 or fewer points; prior to that, no other season since 1960 finished with 54.1% or more games being decided by one score.

The graph below shows the percentage of all games since 1960, by year, where the final margin was 8 or fewer points:

[continue reading…]

{ 15 comments }

Trivia of the Day – Saturday, April 15

Texas A&M defensive end Myles Garrett is likely going to be the first overall pick in the draft, especially after his dominant performance at the NFL Combine.  He would be the second front seven player from the SEC to go number one in three years, after Jadeveon Clowney was the first overall pick in 2014.

But only one other front seven player from the SEC has gone first overall.  Can you name him?

Trivia hint 1 Show


Trivia hint 2 Show


Trivia hint 3 Show


Click 'Show' for the Answer Show

{ 4 comments }

Myles Garrett Is Your 2017 Combine Champion

Myles Garrett is in good shape.

Over the last few days, we have looked at how the top college athletes performed in various drills at the NFL combine, after adjusting for height and weight. Today, we look at the full results and crown a combine champion.

That is a pretty easy thing to do, as it turns out. Texas A&M defensive end Myles Garrett is likely going to be the first overall pick in the draft, and his performance in Indianapolis cemented such a distinction. Garrett had the 2nd best performance in three separate drills: the 40-yard dash, the bench press, and the vertical jump. Then, he produced a 5th-place finish in the broad jump, while sitting out the 3-cone drill. Garrett competed in four of these five events and his averaged finish was 2.8. That’s tremendous.

The table below shows the results in these five drills. I have also included an average rank, excluding all events where a player didn’t participate. That’s not the best way to do this, but I don’t know of a simpler method to rank them. The far right column shows how many of the 5 events each player competed in, so that can be a useful guide. It’s clear to me that the runner up for Combine King is Solomon Thomas rather than Aviante Collins. Thomas had an average rank of 7.6, but he competed in all five events. Collins has a higher rank at 5.0, but the TCU tackle only competed in the 40 and the bench press. To me, a 1-7-8-8-14 is more impressive than a 5-5-dnp-dnp-dnp, but to keep things simple, I just used a simple average. [continue reading…]

{ 1 comment }

Thomas was a combine superstar

As you can imagine, heavier players fare much worse in the 3-cone drill, and taller players have a slight advantage, too. Here was the best-fit formula from the 2017 combine:

7.3397 -0.0317 * Height (Inches) + 0.0091 * Weight (Pounds)

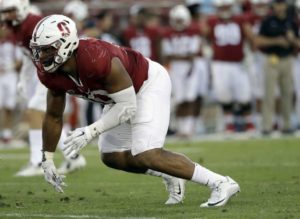
Stanford running back Christian McCaffrey is one of the more interesting prospects from this draft, and he dominated in the 3-cone drill, finishing in 6.57 seconds, just one hundredth of a second behind the leader. Given his dimensions — 71 inches, 202 pounds — he’d be expected to complete the drill in 6.93. McCaffrey therefore finished the drill in 0.36 seconds more than expected, the 7th-best adjusted performance in this drill.

The top performance belonged to a different Stanford player, defensive end Solomon Thomas, who finished a full 0.50 seconds above expectation. The full results, below: [continue reading…]

{ 1 comment }

Hey, look who it is again.

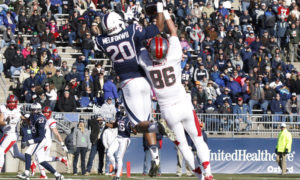
Yesterday, we looked at the vertical jump, which is biased towards lighter players. The star at the combine was Connecticut safety Obi Melifonwu, who had both the top vertical jump and the top weight-adjusted vertical jump. Well, Melifonwu also had the longest broad jump at the combine.

The broad jump is also biased in towards lighter players, but it’s also biased towards taller players. As a result, we need to adjust broad jump results for both weight and height: the best-fit formula from the results of the 2017 combine is:

Broad Jump = 84.14 + 1.0766 * Height (Inches) – 0.1940 * Weight (Pounds)

For Melifonwu, he weighed 224 pounds and was 76 inches tall; that means he’d be projected to jump a solid 122.5 inches. That’s a pretty high projection, showing that Melifonwu’s body is well-tailored for this drill. But even still, he exceeded that jump by 18.5 inches, courtesy of his remarkable 141 inch jump. As a result, he once again had both the top jump and the top adjusted jump: [continue reading…]

{ 0 comments }

Being able to jump high might be useful for a safety

Let’s begin with the most remarkable of today’s feats: Myles Garrett is getting pretty good at this number two thing. After finishing second in the weight-adjusted 40 and second in the height and weight adjusted bench press, Garrett has again finished second in a combine drill, this time the weight-adjusted vertical.

When it comes to the vertical jump, weight is by far the most important thing that matters. For every additional 16.7 pounds a player weights, his expected vertical declines by one inch. That’s because the best-fit formula for projecting the vertical jump at the 2017 combine was 46.38 – 0.0597 * weight (pounds). Connecticut safety Obi Melifonwu weighed 224 pounds in Indianapolis, which would project him to jump an even 33 inches if he was average at this drill.

Well, Melifonwu was anything but average. He jumped an incredible 44 inches: for comparison’s sake, Florida State / Jacksonville safety Jalen Ramsey had a 41.5 inch vertical last year, tied for the most of any player at the 2016 combine. And that was at 209 pounds. Melifonwu was 15 pounds heavier and jumped 2.5 inches higher. That’s a remarkable feat, and brings to mind some of the great verticals from the 2015 combine.

And while Melifonwu was 11 inches better than expected, Garrett was right on his heels at +10.9 inches. Garrett weighed 272 pounds at the combine, but still jumped an insane 41 inches. That’s only three fewer inches than Melifonwu at 48 pounds heavier. Now because the average player lost 16.7 inches for every pound, that makes Melifonwu’s jump just slightly better, but the two of them were far ahead of the rest of the pack. Below are the full results: [continue reading…]

{ 1 comment }

Lawson, when he’s not on the bench press

Yesterday, I looked at the best weight-adjusted 40-yard dash times at the 2017 NFL Combine. The Browns are expected to select Texas A&M defensive end Myles Garrett with the first overall pick, and with good reason: he had the 2nd best weight-adjusted 40-yard dash time, and he comes in 2nd place again today in the height and weight adjusted bench press.

In 2015, Clemson/Atlanta Falcon Vic Beasley was the bench press champion, using a formula involving expected bench press reps based on a player’s height and weight.  That turned out to be pretty predictive of future success; on the other hand, last year’s winner was Nebraska fullback Andy Janovich, who wound up being a 6th round pick and a minor contributor as a rookie with the Broncos.

The best-fit formula to project bench press reps for the 2017 Combine was:

17.401 -0.3354 * Height (Inches) + 0.1075 * Weight (Pounds)

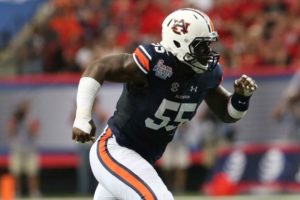
Using that formula, Garrett — at 76 inches and 272 pounds — would be projected to bench press 225 pounds for 21.1 reps. In reality, Garrett produced a whopping 33 reps, or 11.9 more than expected. The only way to top him was Auburn’s Carl Lawson, who measured at 74 inches and only 261 pounds. Being shorter is better, but being lighter is worse, and Lawson would be projected using the regression to have 20.6 reps on the bench press. Instead, he had 35, or 14.4 more than projected, easily the largest margin at the combine.
[continue reading…]

{ 0 comments }

O.J. Howard is fast.

As I have done for the last few years, this week I will be using the raw NFL combine data and adjusting them various metrics.  With respect to the 40-yard dash, the only adjustment I’ve made is for weight, as no other variable (e.g., height) impacts a player’s 40 time quite like weight.  The best-fit formula to predict 40-yard dash time during the 2017 combine was 3.283 + 0.00606 x weight. ((This time around, I excluded punters, kickers, and long snappers when running regressions, as those players aren’t invited to their combine for their raw athleticism (and removing them made the numbers a little tighter). As you can see

Let’s use Alabama tight end O.J. Howard as an example.  He weighed 251 pounds at the combine, which means he would be projected to run the 40-yard dash in 4.81 seconds. Instead, he ran it in just 4.51 seconds, a full 0.30 better than expected.

That was the best performance of any player at the combine. A very close second was produced by the presumptive number one pick in the draft, Myles Garrett. The Texas A&M defensive end weighed 272 pounds, so using the formula above, a player of Garrett’s size should run the 40 in 4.93 seconds.  But Garrett was 0.29 seconds better than expected, completing the drill in 4.64 seconds. Garrett reportedly bested that time by running 40 yards in 4.57 seconds at his Pro Day, too. [continue reading…]

{ 4 comments }

The Broncos thought they had found their heir apparent.

The Giants, Saints, Steelers, and Chargers all have older franchise quarterbacks, leading many to speculate that one or more of those teams will spend an early pick on a quarterback. That could even include a first round pick, which made me wonder: how often do teams do that?

I looked at all teams since 1967 that:

  • Used a first round pick on a quarterback;
  • Had a QB on the roster the year before and that upcoming season who was at least 32 years old in the upcoming season;
  • That QB threw at least 100 passing touchdowns with that team.

There are 15 examples that fit those specific criteria.  Let’s review: [continue reading…]

{ 9 comments }

In 1973, the 14 AFC teams housed 8 Hall of Fame quarterbacks. The AFC East had Joe Namath and Bob Griese with the Jets and Dolphins, the AFC Central had Pittsburgh’s Terry Bradshaw, and the AFC West had five HOF QBs: Len Dawson was with the Chiefs, while the Chargers had a first-year Dan Fouts and a last-year Johnny Unitas. The Raiders? They had Ken Stabler and George Blanda. And in the NFC, Sonny Jurgensen and Roger Staubach were the signal callers for Washington and Dallas, while Fran Tarkenton was the Vikings quarterback. That means the ’73 NFL (along with the ’70 and ’71 versions, which didn’t have Fouts but did have Bart Starr) housed 11 future Hall of Fame passers. And that excludes Ken Anderson, of course, who entered the league in ’71.

Meanwhile, in ’81 and ’82 — at a time, I’ll note, when Ken Anderson was doing pretty darn well — there were just four active HOF QBs. Stabler, who finally made it as a seniors’ nominee last year, Fouts, Bradshaw, and Joe Montana. On average, there have been about 7-8 active HOF quarterbacks at any one time. [continue reading…]

{ 17 comments }

2016 Postseason Game Scripts

With one massive exception, the 2016 playoffs were not very interesting. The home team usually won, the favorite usually won, and usually by a large margin. In 8 of 10 games (ignoring the neutral site Super Bowl), the home team was the favorite and won by 13+ points.

And the Game Scripts weren’t all that exciting, either. Most of the games weren’t Super Bowl, and there was just one comeback. Of course, it wasn’t just any comeback; it was perhaps the comeback. Take a look: [continue reading…]

{ 7 comments }

Tony Romo Has Borderline HOF Stats (Era-Adjusted)

This photo probably has one HOF QB

Yesterday, Tony Romo announced that he was retiring from football after an excellent career with the Cowboys. Now here are two interesting questions: will he be a Hall of Famer? And should he be a Hall of Famer?

Regular readers will recall that in 2014, I looked at how Eli Manning’s stats compared to other Hall of Fame passers. I used a quick-and-dirty method to measure quarterback dominance, reprinted below.

  • Step 1) Calculate each quarterback’s Adjusted Net Yards per Attempt (ANY/A) for each season of his career where he had enough pass attempts to qualify for the passing title (14 attempts per team game). ANY/A, of course, is calculated as follows: (Passing Yards + PassTDs * 20 – INTs * 45 – Sack Yards Lost) / (Pass Attempts + Sacks).
  • Step 2) For each quarterback, award him 10 points if he led the league [1]For purposes of this post, I have combined all AFL, NFL, and AAFC Stats. in ANY/A, 9 points if he finished 2nd, 8 points if he finished 3rd, … and 1 point if he finished 10th. A quarterback receives 0 points if he does not finish in the top 10 in ANY/A or does not have enough pass attempts to qualify. This is biased in favor of older quarterbacks to the extent he is playing in a smaller league. For example, Charlie Conerly
  • Step 3) For each quarterback, add his “points” from each season to produce a career grade.

[continue reading…]

References

References
1 For purposes of this post, I have combined all AFL, NFL, and AAFC Stats.
{ 123 comments }

Dan Fouts, and Winning vs. Stats Part 4

On Thursday, I looked at quarterbacks from 2016 who started at least 8 games and threw at least 150 passes. For those passers, I calculated how many standard deviations above average they were in Relative ANY/A (i.e., how much better they were, statistically, than average) and in winning percentage. I sorted the list by the difference between the two, to find the quarterbacks whose stats and winning percentages diverged by the largest amounts. And Friday, I looked at the quarterbacks whose passing stats most greatly exceeded their winning percentage in any given season.  On Saturday, I looked at the reverse: the quarterbacks whose winning percentages greatly exceeded their stats.

Today, let’s look at some career ratings.  One key note: This is a “career” rating but it excludes all seasons where a quarterback started fewer than 8 games, or threw fewer than 150 pass attempts.  So this excludes partial seasons, making it not a true snapshot of a player’s career, but rather a quarterback’s career as his team’s main starter.

The main leader here is Dan Fouts, and it’s not particularly close.  Over the course of his “career” — which spans 13 seasons as a starter with 150+ attempts — Fouts was a total of 13.8 standard deviations above average in ANY/A. However, he was barely above average in winning percentage, at just 0.23 standard deviations. Remember, Fouts had two top-30 seasons and four top-100 seasons in terms of his stats exceeding his record. As a result, his total “Diff” is 13.57, easily the most of any quarterback in this study, with Dan Marino, Boomer Esiason, and Drew Brees.

But since this is a cumulative stat, I wanted to also look at things on a per season basis.  So Fouts was, on average, 1.06 standard deviations above average in ANY/A, and just 0.02 in winning percentage, for an average difference of 1.04.  So is it better to sort the list based on cumulative difference, which is biased towards longevity, or average difference, which can be skewed by players who only played a few seasons? To combine the two ideas, I came up with a third column called Adj Diff.  That’s calculated by adding 6 seasons of average (i.e., 0.00) play to every player’s total diff, and re-calculating their average on a per-season (with 6 additional seasons) basis.  This helps blend both ideas, in my opinion.  If you have only a few seasons, 6 seasons of average play will drop you down significantly, but it also limits the value given to compilers.  Anyway, here’s the list: [continue reading…]

{ 51 comments }

Today’s guest post comes from James “Four Touchdowns” Hanson, a relative new reader to the site. As always, we thank our guest posters for contributing.

[Editor’s note: There were a couple of minor bugs in the original data. This post has now been updated.]


There may be no two quarterbacks more often measured against each other than Tom Brady and Peyton Manning. One simply has to do a Google search of the topic to see that fans and sports writers have compared the two numerous times, using a vast array of criteria from the simple counting of championships to using advanced analytics to make their case.

So it’s surprising to me that I still haven’t come across a comparison of Manning and Brady against the same defenses. It’s an idea that occurred to me when Manning critics pointed out that much of his record-breaking 2013 season came against the mediocre teams of the 2013 NFC East and AFC South, while Tom Brady’s record-breaking 2007 was against a tougher strength-of-schedule. [1]While I am a Peyton Manning fan, I feel the point is valid and logical. We compare stats so often but don’t always take into account that most of those numbers were earned against different teams … Continue reading If we’re genuinely after the fairest assessment possible – which is why I assume fans of advanced analytics prefer to measure individual players by their own production rather than team results like wins and championships – what better way to measure each player than by how they performed against the same competition?

So I decided to take a look at the seasons in which Manning and Brady were both active and played against the same teams in the same season. Of course, like any statistical analysis, this one comes with its own set of flaws. When the two quarterbacks play each other’s divisions or one plays the same team in the regular season and the playoffs, one of them may have played the same team twice or even three times in a single season while the other has played them only once.

This can be good or bad for the player’s results – sometimes it allows the opposing defense to learn from the first encounter and make life difficult for the passer the second time around. One example is Peyton Manning’s encounters with the Steelers in 2005; he defeated Pittsburgh with a 102.9 rating and 8.67 ANY/A during the regular season, only to see his performance suffer the second time around during the post-season with a 90.9 rating and 6.21 ANY/A in a loss. Meanwhile, Tom Brady’s single game against the Steelers, where he won with a 92.7 rating and 6.84 ANY/A, stands alone – could he have done better or worse in a second encounter? We’ll never know.

Other times, it can allow the quarterback another opportunity to do well against that defense. When Brady played the Jets for the first time in 2010, he earned a mediocre 72.9 rating and 5.11 ANY/A in a loss. He bounced back to win with an extraordinary 148.9 rating and 12.00 ANY/A in their second meeting and then fell somewhere in between when they met in the playoffs, losing with an 89 passer rating and 5.08 ANY/A. Meanwhile, Manning met the Jets just once in the post-season, where he suffered a loss despite earning a 108.7 rating and 8.85 ANY/A in his last game wearing a Colts uniform. How would he have done if he played the Jets three times? Again, we’ll never know.

In fact, the sometimes vast difference in which each QB has performed against the same defense in the same season should encourage us to take these results with a grain of salt – in-game conditions, game plans from coaches, the play from supporting casts, how one team’s strengths and weaknesses match differently with an opponent, playing at home or away, key injuries on either side, etc. can all effect a player’s performance in any given game.

And there’s always the possibility that Brady or Manning just had a bad day and their performance isn’t indicative of their true abilities: the small sample size of a football season made even smaller by singling out common opponents isn’t ideal in determining a fair and scientific measurement for how good each player actually is. On the other hand, it’s the only evidence we have available, so we’ll have to roll with it.

I bring this up because I don’t intend this to be a definitive attempt at determining which player is better – most people already have made up their minds (and I personally tend to rate quarterback on tiers anyway). Some say Manning would have more championships if he had Belichick and the Patriots organization at his side, while others say Brady would have bigger numbers if he had the receiving talent Manning had during his career. I think both can be true.

I’d also like to mention that I pulled this list manually and despite several reviews, there still may be errors in the data – this is unintentional and I welcome any corrections.

So without further ado, here’s a list of the common opponents they faced in each season, with both 2008 (Brady played one game) and 2011 (Manning was inactive) removed as both players weren’t active during those seasons:

• 2001: Jets, Bills, Dolphins, Raiders, Saints, Falcons, Broncos, Rams
• 2002: Dolphins, Jets, Steelers, Titans, Broncos
• 2003: Dolphins, Jets, Bills, Browns, Broncos, Jags, Texans, Titans, Panthers
• 2004: Ravens, Chiefs
• 2005: Steelers, Jaguars, Chargers
• 2006: Bills, Jets, Dolphins, Titans, Jags, Texans, Broncos, Bengals, Bears
• 2007: Chargers, Ravens, Jaguars
• 2009: Bills, Jets, Dolphins, Titans, Jags, Texans, Ravens, Broncos, Saints
• 2010: Chargers, Jets, Bengals
• 2012: Texans, Ravens
• 2013: Colts, Ravens
• 2014: Bills, Jets, Dolphins, Raiders, Chiefs, Chargers, Colts, Bengals, Seahawks
• 2015: Colts, Steelers, Chiefs

And here are their career averages against common opponents from 189 total regular season and playoff games played (93 Manning, 96 Brady):

Except for interception percentage, Manning seems to have a slight advantage across the board. Most differences are so small that I personally consider them basically even in most categories. The biggest differences seem to be that Manning’s interception rate is substantially higher, while Brady’s sack numbers are substantially higher – and in Brad Oremland’s TSP and Career Value metrics, where Manning holds a commanding lead.

To delve a little further into the numbers, let’s look at the advanced stats of each player by season. The highlights indicate which player did better that year in each metric, while the bolded numbers indicate that season’s number marks a career best (against common opponents) –

The leader in both ANY/A and Passer Rating match in every season, with Manning’s rates beating Brady’s in 8 of the 13 seasons compared. QBR results are also is very similar, with the only difference being Brady having the edge in 2014, putting them even at 4-4.

Interestingly, it seems that for most seasons, one player clearly played better against common opponents by a substantial amount – in Passer Rating, the two only play at a similar level in 2001 and 2007, while the rest of the time the winner often beats the other by ten points or more! What’s really surprising to me is that Manning surpasses Brady in every metric for 2007, which was when Brady led perhaps the greatest offense of all time to a record-breaking season and an AFC Championship.

I also wanted to compare their performances against common opponents in each season by TSP but since it’s a raw sum instead of an average like the other advanced stats, I needed to take each season’s statistical averages and multiply them to get 16 games worth of production. The results were –

The first thing that jumps out at you is Manning’s preposterous 2013 prorated across 16 games – over 6,500 yards and 75 TDs with only 5 INTs. That alone tells us to take these results with a grain of salt.

But accepting the numbers for what they are, we see that the leader in TSP for each season matches the leader in Passer Rating and ANY/A. We also see that Manning’s highs and lows are quite extreme in comparison to Brady’s – Brady doesn’t have a season that matches Manning’s 2004 and 2013, but Brady’s TSP never dips into negative numbers as Manning’s does in 2002 and 2015.

And again, Manning’s 2007 results manage to top Brady’s numbers for his most legendary statistical season (though that probably means nothing since the sample size we’re working with is so small).

So what does this all prove? Well, nothing really. As said, I think the majority of people already have their opinions set for these players – this is just for fun. Hope you enjoyed!

References

References
1 While I am a Peyton Manning fan, I feel the point is valid and logical. We compare stats so often but don’t always take into account that most of those numbers were earned against different teams of varying quality – after all, it’s not fair to compare passing numbers if one guy is going up against the 2002 Bucs while the other is playing the 2015 Saints, right?
{ 207 comments }

Thoughts on the 2016 NFL Playoffs

The cherry on top of a boring dessert

There were really only three notable games in this year’s playoffs. The Super Bowl, of course, was a classic game, if not necessarily a good one to watch from start to finish. The Patriots completed a historic comeback and won in overtime, 34-28.

And there were two upsets: the Packers went into Dallas and won, 34-31, in what was the best game of the playoffs. And the Steelers went into Kansas City and won in a sloppy game, 18-16, where Pittsburgh kicked six field goals.

The other 8 games? All were won by the favorites, and all were won by at least 13 points. That matched the number of times the favorite won by over 10 points in the three previous years combined.

Since 1990, the favorites have won 7.6 of 11 games, on average, in the postseason. With 9 wins by favorites in 2016, that matches the most times the favorite has won in the playoffs, but it happened six other times, too. So 2016 wasn’t all that notable in that regard.

And since 1990, teams have won by over 10 points in just over half of all playoff games. With 8 such wins, that is the most ever, but it happened four other times, too (although not since 2002). But what makes the 2016 playoffs stand out is the combination of the two factors: 8 times the favorite won and won by over 10 points, compared to just 4.4 times on average. The only other time that happened was in 1996. [1]And 8 of the 10 times, the home team won, which is high, but also not particularly unusual (the home team won 6.8 games on average).

The table below shows the average results (from the perspective of the winning team) in every playoff year since 1990: [continue reading…]

References

References
1 And 8 of the 10 times, the home team won, which is high, but also not particularly unusual (the home team won 6.8 games on average).
{ 1 comment }

On Thursday, I looked at quarterbacks from 2016 who started at least 8 games and threw at least 150 passes. For those passers, I calculated how many standard deviations above average they were in Relative ANY/A (i.e., how much better they were, statistically, than average) and in winning percentage. I sorted the list by the difference between the two, to find the quarterbacks whose stats and winning percentages diverged by the largest amounts. And yesterday, I looked at the quarterbacks whose passing stats most greatly exceeded their winning percentage in any given season.

Today, the reverse: the quarterbacks whose winning percentages were much more impressive than their passing numbers. And the 1973 season had by Terry Bradshaw stands out as the most extreme example. In ’73, Bradshaw went 8-1, despite passing stats that were bad even by 1973 standards: he threw 10 TDs, 15 interceptions, and averaged just 4.89 NY/A. Bradshaw ranked 21st in ANY/A at just 2.56 out of 24 qualifying passers. [continue reading…]

{ 14 comments }

Manning didn’t have much help during his career

Yesterday, I looked at quarterbacks from 2016 who started at least 8 games and threw at least 150 passes. For those passers, I calculated how many standard deviations above average they were in Relative ANY/A (i.e., how much better they were, statistically, than average) and in winning percentage. I sorted the list by the difference between the two, to find the quarterbacks whose stats and winning percentages diverged by the largest amounts.

What about historically? I performed the same study going back to 1970. And the season that stands out the most is Archie Manning’s 1980 season. That year the Saints were the worst team in the league: New Orleans went 1-15, and every other team won at least 4 games. [1]The Saints’ troubles continued into the draft; New Orleans selected George Rogers first overall, when two of the top four, and three of the top eight players went on to be Hall of Famers. Manning started every game for the team because he actually had a strong season, at least statistically: he ranked 9th out of 30 qualifying passers in ANY/A, and had a Relative ANY/A of +0.53. That, of course, is pretty unusual given his team’s 1-15 record.

That stands out as the biggest example of a divergence of stats being more impressive than team record. The best 100 seasons (although by default, the table only lists the top 20) are below: [continue reading…]

References

References
1 The Saints’ troubles continued into the draft; New Orleans selected George Rogers first overall, when two of the top four, and three of the top eight players went on to be Hall of Famers.
{ 12 comments }

Kessler in a losing effort.

In 2016, Browns rookie quarterback Cody Kessler had an uneven year. He went 0-8, but he ranked 24th in ANY/A out of the 31 quarterbacks who started at least 8 games and threw at least 150 passes. His stats weren’t great, but they weren’t 0-8 bad, either. In PFR’s Adjusted Net Yards per Attempt Index, which attempts to adjust for era, Kessler ranked 15th out of the 43 rookie passers to meet the 8 start/150 attempt threshold. It was a pretty good rookie season that came with an 0-8 record.

And then there was Brock Osweiler.  The Texans quarterback — now on the Browns — was dead last with a pitiful 4.34 ANY/A average last season.  But for the second year in a row, Osweiler produced a winning record despite poor play; Houston went 8-6 with Osweiler under center.

I calculated the winning percentage and Relative ANY/A (i.e., ANY/A adjusted for era) for each passer since 1970 to meet the 8 start/150 attempt threshold.  I then calculated the standard deviations above/below average each passer was in each category.  Here are the results for 2016, and here’s how to read the Kessler line: he started 8 games for the Browns and had a 0.000 winning percentage.  His Relative ANY/A was -0.34, so just a hair below league average.  He was 2.53 standard deviations below average in winning percentage, but only 0.28 standard deviations below average in RANY/A.  As a result, he was 2.24 standard deviations better in RANY/A than he was in winning percentage; that was the highest number on the list.  Passers at the top had much better stats than wins; passers at the bottom (highlighted by Osweiler) had better wins than stats. [continue reading…]

{ 24 comments }

NFL And Regression To the Mean, 1970-2016

Since 1970, you would do a pretty good job estimating any team’s record by regressing that team’s record back to the mean by about 60%. More specifically, if you take 40% of the team’s actual winning percentage the prior year, and 60% of the league average winning percentage, you would get a pretty good estimate of their record the next season (though the R^2 is just 0.17).

That’s over a long period, though, and team variability is on the rise. If you look at the last 20 years, it’s more like 70%, with the best fit formula to project winning percentage being something like 35% plus 30% of the team’s winning percentage the prior year.

Last year was a bit of a weird year, with some notable outliers. The 3-13 Browns would have been expected to progress to the mean, but instead went 1-15. The 49ers went from 5-11 to 2-14. The Bears went from 6-10 to 3-13. And on the positive side of .500, the Panthers dropped from 15-1 to 6-10, while the Jets win total dropped in half, from 10 to five.

The Patriots defied regression to the mean for the umpteenth straight year, improving from 12-4 to 14-2. The Raiders zoomed past the mean, going from 7-9 to 12-4. The Giants similarly went from 6-10 to 11-5.

The correlation coefficient between team winning percentage in 2015 and team winning percentage in 2016 was 0.27, which is pretty low, but not abnormally so. Here are the correlation coefficients for each pair of years since 1970: [continue reading…]

{ 1 comment }

Dillon was a star with the Patriots, too.

It’s been an unusually busy offseason for the Patriots. New England signed Buffalo Pro Bowl cornerback Stephon Gilmore to a big contract, and also added former Bengals running back Rex Burkhead.  The Patriots were also active in the trade market, acquiring WR Brandin Cooks from New Orleans, DE Kony Ealy from Carolina, and TE Dwayne Allen from the Colts.

Departing from New England? TE Martellus Bennett went to Green Bay, Jabaal Sheard went to Indianapolis, CB Logan Ryan went to Tennessee, while CB Malcolm Butler and RB LeGarrette Blount, among others, could still be on the move.

Which made me wonder: do the Patriots, as you might suspect, do better adding players from other teams than other teams do when adding players from the Patriots? The table below shows the most productive players (by AV) in year 1 in New England after playing for a different team the prior season. Note that this excludes Dion Lewis in 2015, who was not on an NFL team in 2014. [continue reading…]

{ 11 comments }

Adam Steele is back to recap his Wisdom of Crowds work. As always, we thank him for that. Football Perspective wouldn’t be what it is without contributions like this from folks like Adam.


I’d like to thank everyone who voted in this year’s Wisdom of the Crowds, and I also appreciate your patience in waiting for the long overdue recap article. I’m not much for small talk, so let’s get right to it.

Originally, my plan was to simply tally the scores and use the totals for the QB ranking. However, it quickly became evident that this wasn’t going to work, as we had very large discrepancies in how voters allocated their points. Some people awarded 25 points to their pick for best ever, while others didn’t give any QB more than six points. It would be just plain wrong for one voter’s GOAT to be weighted four times more than the next voter. My solution (helmet knock to commenter hscer [1]I highly encourage you to check out hscer’s collection of Sporcle quizzes., since he came up with it) is to tabulate points in proportion to the highest score on each ballot. Thus, a QB who scores five points on a ballot with a 25 maximum receives 0.2 ranking points, while a five-pointer on a ballot with a maximum of six is awarded 0.83 ranking points. This levels the playing field for all ballots, and in my opinion yields a far more honest result than the simple tally method. Since the abstract concept of ranking points is tough to put in proper context, I’ve translated them into Share %, which is the percentage of possible points earned. We had 51 legal ballots submitted this year, so Share % = ranking points / 51.

Results

In order to qualify for a WOC ranking, a quarterback had to be listed on a minimum of three ballots, leaving us with 36 qualifying QB’s. The table below lists the quarterbacks’ Share %, ballot appearances, “pantheon” appearances (ballots where he received at least 0.5 ranking points), and ballots where he received the highest score (including ties). I also included the ranking each QB earned in the 2015 edition of this exercise, as well as the number of positions gained or lost from 2015 to 2017. [continue reading…]

References

References
1 I highly encourage you to check out hscer’s collection of Sporcle quizzes.
{ 50 comments }

TD/INT Ratio Leaders

Touchdown/Interception ratio isn’t an official statistic, so here’s something you probably didn’t know. Among qualifying passers (minimum 14 pass attempts per team game), either Tom Brady or Aaron Rodgers has led the league in this category in 6 of the last 7 seasons. The one exception? Nick Foles in 2013.

Brady has lead the NFL in TD/INT ratio four times: 2007, 2010, 2015, and 2016. That’s tied for the most in football history, with Roger Staubach and Charlie Conerly. The table below shows the leaders in pro football (combining the AAFC and AFL with the NFL) in each year since 1946:

[continue reading…]

{ 5 comments }

Running Back Receiving Data Since 1950

Yesterday, I looked at the amount of rushing yards generated by “quarterbacks” in each year since 1950. I put that term in quotes because what I did was calculated the amount of rushing yards by passers, weighted by the number of passing yards by each passer. So the amount of rushing yards by a passer with 5000 passing yards counts for 50 times as much (when determining how much rushing was generated by “quarterbacks” that season) as a passer with 100 passing yards.

What if we do the same thing but with receiving yards generated by “running backs”? The peak year was 2002, when there were a lot of players who both were their team’s workhorse back and were great receivers. Priest Holmes rushed for 1,615 yards and had 672 receiving yards, Charlie Garner was at 962/941, Tiki Barber had 1387/597, and LaDainian Tomlinson was at 1683/489. On average, the league “running backs” produced an average 292 receiving yards. That may not mean much in the abstract, but think of it this way: if each team gave all of its rushing yards to one player, that player would have averaged 292 receiving yards, too. Using the methodology from yesterday, here are the results if we replace passing yards with rushing yards, and rushing yards with receiving yards: [continue reading…]

{ 1 comment }

Last year, Tyrod Taylor led all quarterbacks with 580 rushing yards. Colin Kaepernick, in 12 games, ranked 2nd with 468 rushing yards, and no other quarterback had even 400 rushing yards. But Aaron Rodgers, Blake Bortles, Cam Newton, Marcus Mariota, and Andrew Luck all had at least 300 rushing yards, so 7 out of 32 teams had a quarterback with at least that many yards.

How does that compare historically? Two years ago, in one of my favorite posts/methodologies, I looked at how to measure quarterback rushing yards. Here’s what I did.

1) Calculate the percentage of league-wide passing yards by each player in each season. For example, Tyrod Taylor was responsible for 2.3% of all passing yards in 2016.

2) Calculate the weighted average league-wide rushing yards for each season. So we take the result in step 1 and multiply that by each player’s number of rushing yards. For Taylor, this means multiplying 2.3% by 580 for a result of 13.4 rushing yards. Perform this calculation for each player in each season and sum the results to obtain a league-wide total. For 2016, this total was 150.9 rushing yards (obviously Taylor was the biggest contributor among quarterbacks).

3) For non-16 game seasons, pro-rate to 16 games.

Perform this calculation for each season since 1950, and you get the following results: [continue reading…]

{ 6 comments }

2016 Team AV and Draft Value

Last year, I looked at each team’s “average” draft value, with average being defined as the AV-weighted average of the team’s roster. And yesterday, I did the same thing for every Super Bowl champion. Today, we look at the draft value for each team in 2016.

One thing that’s interesting, if not surprising: there’s not a ton of turnover from year to year in this stat. The top five teams in this metric last year were also the top five teams this year, although the order switched around notably. The Falcons were fifth last season, but were first this year, and would have been in the top 10 among all Super Bowl champions had they won. That’s what happens when Matt Ryan (3rd overall), Julio Jones (6th), Alex Mack (21st), Jake Mathews (6th), and Vic Beasley (8th) were the team leaders in AV.

The table below shows all teams in 2016: [continue reading…]

{ 1 comment }

Super Bowl Champions, by Draft Value

The New England Patriots won Super Bowl LI, but it wasn’t because the team was packed full of high draft picks. Of the five Patriots who had more than 10 points of AV, only one was drafted in the first four rounds. Regular readers know that I created an AV-based draft value chart, which assigns points to each draft pick based on the expected marginal production produced by that pick.

Well, you can calculate a team’s weighted average draft value by doing the following:

  • Calculate the draft value spent on each player on the roster who produced at least 1 point of AV that season.
  • Calculate the percentage of team AV produced by each player. This is key, otherwise Chris Long would skew the results in the wrong direction.
  • Multiply the results in steps 1 and 2, and then sum those values.

Here’s how it would work with the 2016 Patriots, who had an average draft value (as a roster, and weighted by AV) of 6.72.

PlayerPosAVPerc of TmAV%Draft PkDraft ValWt Draft Val
Dont'a HightowerILB145.4%2514.10.76
Malcolm ButlerCB135%udfa00.00
Tom BradyQB135%1990.90.05
Marcus CannonOL135%1383.20.16
Julian EdelmanWR114.2%23200.00
Devin McCourtyDB103.8%2713.60.52
Nate SolderT103.8%1716.60.64
Alan BranchDT93.5%3312.30.43
LeGarrette BlountRB83.1%udfa00.00
David AndrewsC83.1%udfa00.00
Shaq MasonC83.1%1313.60.11
Joe ThuneyOG83.1%786.90.21
Malcom BrownDT83.1%3212.50.38
Chris HoganWR72.7%udfa00.00
James WhiteRB72.7%1303.60.10
Trey FlowersDE72.7%1015.20.14
Martellus BennettTE72.7%618.40.23
Rob NinkovichDE62.3%1353.40.08
Jabaal SheardDL62.3%3711.60.27
Patrick ChungDB62.3%3412.10.28
Chris LongDE62.3%230.20.70
Nate EbnerDB51.9%19710.02
Logan RyanCB51.9%836.50.13
Jamie CollinsOLB51.9%529.40.18
Rob GronkowskiTE51.9%4210.80.21
Elandon RobertsILB41.5%2140.40.01
Cameron FlemingOT41.5%1403.10.05
Malcolm MitchellWR41.5%1124.60.07
Shea McClellinDE41.5%1915.80.24
Dion LewisRB31.2%1492.70.03
Stephen GostkowskiK31.2%1184.20.05
Vincent ValentineDT31.2%965.50.06
Eric RoweCB31.2%4710.10.12
Danny AmendolaWR20.8%udfa00.00
Jonathan FreenyDE20.8%udfa00.00
Ryan AllenP20.8%udfa00.00
Ted KarrasOG20.8%2210.20.00
Duron HarmonFS20.8%915.90.05
Jacoby BrissettQB20.8%915.90.05
Jimmy GaroppoloQB20.8%628.30.06
Kyle Van NoyOLB20.8%4011.10.09
Barkevious MingoOLB20.8%623.20.18
Jonathan JonesDB10.4%udfa00.00
Anthony JohnsonDT10.4%udfa00.00
Justin ColemanCB10.4%udfa00.00
Brandon KingDB10.4%udfa00.00
Woodrow HamiltonDL10.4%udfa00.00
Joe CardonaLS10.4%16620.01
Geneo GrissomOLB10.4%975.50.02
Jordan RichardsSS10.4%648.10.03
Cyrus JonesCB10.4%608.50.03
Total260100%6.72

[continue reading…]

{ 0 comments }

Ben Roethlisberger takes a lot of sacks. Since entering the league in 2004, he has nearly 100 more sacks than any other quarterback. I thought it would be interesting to look at the leaders in sacks taken over rolling 5-year periods.

Over the last 5 years, the most sacked quarterback is Ryan Tannehill, who may be going down a Roethlisberger-like path. Tannehill has surprisingly only missed 3 games in his 5-year career, but I’d say the odds of him continuing to take sacks at a high rate and playing 16 game seasons is pretty low.

As for Roethlisberger, he had the most sacks taken from ’04 to ’08, ’05 to ’09, ’06 to ’10, ’07 to ’11, and ’09 to ’13; he was 2nd from ’08 to ’12, just four sacks behind Aaron Rodgers. That was the only thing stopping Ben from leading for a whopping 6 straight 5-year periods.

Here’s a list of the leader for every 5-year period beginning in 1969, which is as far back as PFR’s sack data goes: [continue reading…]

{ 9 comments }

Guest Post: Alternative Super Bowl MVPs

Today’s guest post comes from Damon Gulczynski, a longtime reader, Seattle sports fan, and part-time writer. He also wrote this book on baseball names. As always, we thank our guest posters for contributing.


White runs for a score against the Falcons

James White was fantastic in Super Bowl LI, setting records in receptions (14) and total points (20), but he did not win the MVP Award.  Instead the voters bestowed that honor on a player who reduced his team’s chances of winning by nearly 15% on a single play (Robert Alford’s pick-six).  That, of course, is a misleading statement — Tom Brady went on to finish the game with over 450 passing yards in leading his team to the greatest comeback in Super Bowl history — but it is completely accurate to say James White was fantastic.  It would not have been unreasonable in the least to pick him over Brady for game MVP.  Super Bowl LI was a case where it would have been more representative of the story of the game to give out two MVP awards — or better yet to have a “three stars” of the game system, like hockey, so that Trey Flowers (2.5 sacks) could have been recognized along with Brady and White.

With this in mind, for fun, I decided to go through each of the 51 Super Bowls and retroactively select the three stars of the game.  In making these selections I relied on box scores, play-by-play logs, news articles, and video clips from past Super Bowls.  My full list is given below.  The actual Super Bowl MVPs are denoted with a + sign after their name; players on the losing team are denoted with a ~ after their name.  In 30 of the 51 cases the MVP was my first star of the game, which means I think the voters “got it wrong” 21 times.  And in six cases I think they really got it wrong, as the player they chose for MVP did not even qualify as my third star of the game. [continue reading…]

{ 29 comments }

Net Interceptions and the Jets

The Jets threw 25 interceptions last year, which was bad because no other team threw more than 21. Also not good: the Jets defense forced just 8 interceptions last year, tied for second-fewest in the league behind the Jaguars (7).

That means New York was at -17 net interceptions last year, which is bad. But the Jets have generally been pretty bad in this category over the last decade, with -59 net interceptions from ’07 to ’16. Take a look at the yearly totals, with interceptions throwing by Jets passers in white, and interceptions forced by the Jets defense in green. [continue reading…]

{ 2 comments }