≡ Menu

It was a very good week for Oklahoma.

The Sooners were easy to write off early in the 2016 season, after two bad losses in the first three weeks. Oklahoma failed to cover by 23 points against Houston (33-23 loss, as a 13-point favorite) and Ohio State (45-24, as a 2-point favorite), which appeared to knock them out of the national discussion.

But Houston did the Sooners a favor by knocking off Louisville on Thursday night, eliminating (for now) the Cardinals from the playoff picture. Houston recorded a single-game SRS score of 79.5 for that performance, the top game of the week. And the better Houston looks, the more forgivable that loss is from Oklahoma’s perspective.

Oklahoma also doubled-up on West Virginia, 56-28, the third-best game of the week. And the fourth-best game of the week came from Oklahoma State, who destroyed TCU. The Sooners and Cowboys face off in two weeks in a de facto Big 12 playoff game: the teams are 8-0 and 7-1 in conference play, respectively, with every other team having at least two conference losses.

Below are the single-game ratings from week twelve: [continue reading…]

{ 1 comment }

Week 11, 2016: Gameday Thread

What’s on your mind today? Philadelphia/Seattle is probably the best game on the slate, although Arizona/Minnesota is one I will definitely keep an eye on. I’m also excited to watch some Titans football, which is not a misprint.

Tennessee is on the franchise’s best six-game scoring streak since 1961. No, really: here is the trailing one, three, and six game points totals for every streak in Titans/Oilers history:

titans-scoring2

As always, leave your thoughts/notes in the comments. With the Jets on a bye, this is shaping up to be a terrific Sunday.

{ 43 comments }

Blair Walsh In Perspective: Game-By-Game EPA

Minnesota Vikings kicker Blair Walsh was released by the Vikings this week, and given his struggles this year, it’s hard to argue with Minnesota’s decision. Walsh will be infamously remembered for missing a chip shot in the playoffs against the Seahawks last year, and those demons have carried over to his 2016 performance.

How much so? I looked at every kick of Walsh’s career, beginning in his rookie season of 2012. For every made extra point in 2012, 2013, or 2014, I gave him +0.01 points, and +0.06 points for every made extra point in 2015 or 2016. Then, for every miss, he received -0.99 or -0.94 points, as applicable.

Extra points were easy; field goals were slightly harder. The graph below shows the average success rate on field goals in 3-year increments, from 2012 to week 10 of 2016:

fg-exp

I used those numbers to give Walsh points for each field goal attempt, too. For example, 48-50 yard kicks have been made 70% of the time over the last five years, so if Walsh attempted a 49-yard field goal, I gave him +0.9 points if he made it, and -2.1 points if he missed it.

Using that methodology, here is how Walsh has fared in every regular season game of his career:

walsh-fg

As a rookie, Walsh was at +11.4 in this system, and would be even higher if I era-adjusted in sample (for convenience, I treated 2012 games the same as 2015 games, which probably is not appropriate). In 2016, he had -7.1 points by this system, including two miserable games in weeks 1 (missed extra point, missed 37-yarder, missed 56-yarder) and 9 (missed extra point, missed 46-yarder in a game the Vikings lost in overtime).

{ 11 comments }

ANY/A Differential, Through 10 Weeks (and TNF) (2016)

The average pass attempt this year, including sacks, has traveled 6.37 ANY/A. On offense, the Falcons and Patriots pace the lead, as both teams are averaging 9.0 ANY/A. The Cowboys, behind rookie Dak Prescott, are third at 8.3, and no other team is within half a yard of the Cowboys. That’s a good reason why Matt Ryan, Tom Brady, and Prescott are three of the frontrunners for MVP.

At the bottom of the offensive rankings? The Ravens, Jets, and Texans. The struggles of Brock Osweiler and Ryan Fitzpatrick have been well-documented, while Joe Flacco‘s decline hasn’t been as widely discussed (other than here, of course).

Below are the Adjusted Net Yards per Attempt averages for each team, on both offense and defense, through ten weeks and last night’s game: [continue reading…]

{ 4 comments }

Are the Texans The Worst 6-3 Team Ever?

Regular readers are familiar with Pythagenpat Records, and using them to see how much of an outlier teams are in a given season.

You can read the link for background information, but here is the quick summary.

The Texans have scored 161 points and allowed 188 in 9 games this year. We use this formula to determine the appropriate exponent for Texans games:

(Points Scored + Points Allowed)/(Games Played)^0.251

This helps to control for things like pace of games, and scoring frequency. For Houston, that exponent is 2.50. Then, we use that to calculate the team’s Pythagenpat Record using this formula:

(Points Scored ^ 2.50) / (Points Scored ^ 2.50 + Points Allowed ^ 2.50)

[continue reading…]

{ 12 comments }

Week 10, 2016 Game Scripts: Break Up The Titans

The Titans were the big Game Scripts story of week ten, as Tennessee rolled out to a 21-0 lead against the Packers. The Titans have been remarkable over the last few weeks: since the start of week five, the team is averaging 33.7 points per game, the most in the NFL.

Tennessee has scored at least 25 points in six straight games for only the third time in franchise history, and only the second time since the merger. The Titans have crossed the 35-point mark in three straight games, a franchise first.  The team is 2nd in yards per carry and 6th in yards per attempt; this is an offense flying high right now. [continue reading…]

{ 1 comment }

Today at 538: the Steelers and Seahawks had some interesting two-point conversion decisions in week ten.

According to ESPN Stats & Information Group, there have been 1,045 two-point conversion attempts since 2001, with teams converting 501 of those tries. That’s a 47.9 percent conversion rate; given that a successful attempt yields 2 points, that means the expected value from an average 2-point try is 0.96 points.

Interestingly, that’s almost exactly what the expected value is from an extra point these days. Since the NFL moved extra-point kicks back to the 15-yard line last season, teams have a 94.4 percent success rate, which means that an extra point has an expected value of between 0.94 and 0.95 points.

This means that, all else being equal, the average team should be indifferent between going for two or kicking an extra point. Unless the game situation (i.e., late in the second half) or team composition (e.g., a bad kicker, or an offense or an opposing defense that is very good or very bad) changes the odds considerably, the decision to go for two or kick an extra point shouldn’t be controversial. In the long run, things will even out, because the expected value to the offense is essentially the same in both cases.

That’s the long run. In the short run, there will be ugly outcomes. And we saw two of those play out this weekend.

You can read the full article here.

{ 4 comments }

The story of the college football season had been the lack of any crazy upsets. It felt as though we were on a predetermined path to the college football playoffs, with Alabama, Clemson, Washington, and the Ohio State/Michigan winner taking the four spots.

Then, Saturday happened. The six best teams this year have combined to lose just five games, and *three* of them came in week eleven:

  • Pittsburgh went into Clemson and won, 43-42. This was a shocking upset: the Tigers were favored by 21.5 points.
  • Less of an upset was seeing USC (+10) go in to Seattle and double up the Huskies, 26-13.  This registered as the 2nd most dominant win of the week, behind only Ohio State’s 62-3 thrashing of Maryland.
  • And then the most shocking development of the weekend: Michigan, #1 in the SRS last week, falling to Iowa in Iowa City.  The Wolverines were 24-point favorites, and would have been 22.7-point SRS favorites over a Hawkeyes team that ranked 44th in the SRS a few days ago.

Oh, and in addition to Ohio State taking care of business, Alabama crushed MSU, 51-3, for the 3rd best SRS game of the week.  Below are the single-game SRS ratings from week 11: [continue reading…]

{ 8 comments }

Week 10, 2016: Gameday Thread

What’s on your mind today? Is it the highly-anticipated AFC East/NFC West showdown between the Jets and the Rams, or perhaps Patriots/Seahawks?  Post whatever you see today, or just whatever is on your mind, in the comments below.

{ 31 comments }

There was just one 4th quarter comeback in week nine, and it came in the Lions/Vikings game.  Trailing 13-9 with 4:14 left, Minnesota embarked on a 19-play, 79-yard drive for a touchdown to take a 16-13 lead.  That would have been the only 4th quarter comeback of the week, but Matthew Stafford completed two passes for 35 yards to put Detroit in position for a field goal to tie the game.  Matt Prater connected from 58 yards, and the Lions won in overtime.

But the Lions led for most of that game, and finished with a Game Script of +2.3.  Only one other winning team in week nine had a fourth quarter score to take the lead: Miami, who returned a kickoff for a touchdown against the Jets. But Miami led 14-13 at halftime, and 20-13 at the end of the third quarter; the Dolphins finished with a Game Script of +2.3.

So there were no teams that won games in week nine with a negative Game Script.  Below are the full results: [continue reading…]

{ 0 comments }

538: Are The Eagles Better Than Their Record?

Today at 538: the Eagles appear to be much better than your average .500 team.

The Philadelphia Eagles are one of the more confusing teams in the NFL. At 4-4, it’s easy to assume that the Eagles are an average team, yet Philly has outscored opponents by 57 points this season, the third-best differential behind the 7-1 Cowboys and 7-1 Patriots. Furthermore, Football Outsiders has the Eagles first in the NFL in defense-adjusted value over average, a metric that measures team performance on a play-by-play basis. So what’s the deal — are the Eagles secretly one of the best teams in the league, or have they somehow gamed the system?

The obvious reason the Eagles are 4-4 despite putting up impressive numbers in the two stats mentioned above is that they clustered a lot of very strong play into just four games. In the team’s four wins, the Eagles have outscored opponents by a total of 76 points, an average of 19 points per victory. That makes Philadelphia one of four teams with an average margin of victory of at least 19 points in wins, joined by the Steelers (19.3 in four wins), Cardinals (23.3 in three wins) and 49ers (28.0 in one win).

You can read the full article here.

{ 1 comment }

Week Ten (2016) College Football SRS Ratings

A little late to the party this week, so here are last week’s ratings as a reminder. Given the late publishing date, I am also including the games from Tuesday and Wednesday night, which means Western Michigan is now 10-0 in these rankings.

The big win of week ten was by Ohio State, as the Buckeyes recorded the single biggest SRS win of the season. Playing at home against Nebraska (ranked 31st, SRS of 48.8), the Buckeyes won 62-3. That’s a 56-point HFA-adjusted margin of victory, which gets adjusted down to a 40-point win after the adjustment we use here in the SRS (i.e., the average of 24 and 56). That translates to an 88.8 single-game rating, which trails only Alabama’s 52-6 neutral site win over USC (90.5) for the top rating of the season. [continue reading…]

{ 0 comments }

Checkdowns: The Bill Barnwell Show, talking Week 10

Today at ESPN, you can hear me talk about football for 42 minutes before talking about the Jets.

{ 0 comments }

The 2016 Presidential Election

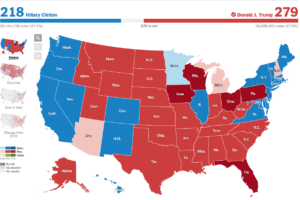
In light of last night’s surprising results, I can’t get too focused on writing an article about football. There will be really good articles written by smart people out there today, but it all starts and ends with the maps. Here was 2012:

nyt_us_620px_president_map

And here is 2016, according to the NYT:

screen-shot-2016-11-09-at-8-14-03-am [continue reading…]

{ 98 comments }

Adam Steele is back for another guest post. You can view all of Adam’s posts here. Adam is now on Twitter, and you follow him @2mileshigh. As always, we thank him for contributing.


In 2014, Football Perspective ran a pair of crowd sourcing exercises to determine the greatest quarterbacks and running backs of all time. These experiments were a lot of fun and generated a great deal of debate amongst the participants, so I thought it would be worthwhile to give crowd sourcing another shot. NFL quarterbacks are the most discussed and analyzed athletes in America, but we can’t properly debate the merits of the league’s famous signal callers without considering the effects of their supporting casts. As of today, there is no mathematically accurate way to measure the strength of a QB’s teammates and coaches, but there are plenty of people around who possess the football knowledge to make educated guesses. Basically, this is the perfect candidate for crowd sourcing. I want to keep things simple to maximize reader participation, so there are just a handful of guidelines I expect participants to follow:

1) Please rate a QB’s supporting cast based on how they affected his statistical performance, not his win/loss record or ring count. The supporting cast umbrella includes the direct effect of skill position teammates, offense lines, coaches, and system, but also the indirect effect of defense, special teams, ownership, and team culture. You’re free to weigh these components however you see fit. The rating for each supporting cast will account for the quarterback’s entire career, using a 0-100 scale. As a rule of thumb, a 100 rating equates to an all star team, 75 is strong but not dominant, 50 is average, 25 is weak but not terrible, and 0 is equivalent to the 1976 Buccaneers.

2) Ratings should be roughly weighted by playing time. The years in which a QB is the full time starter should count more heavily than seasons where he’s a backup or spot starter. And this almost goes without saying, but supporting casts are best evaluated in the context of their respective eras.

3) You may rate as many supporting casts as you wish. Since I will be compiling the results by hand, it doesn’t matter how you order your list, as long as it’s easy to read. I ask that you refrain from rating the supporting casts of quarterbacks you’re not reasonably familiar with; if you don’t know anything about a QB’s career, don’t guess! Any quarterback with at least 1,500 pass attempts is eligible to be rated, and I’ve provided a list of these quarterbacks here. Feel free to break up your ratings into multiple posts on different days, but just be sure to post with the same username each time so I can properly count the results. I plan on keeping the poll open for one week, but reserve the right to extend the duration if interest from new participants remains high enough.

Have fun!

{ 25 comments }

538: Mid-Season Awards (2016)

Today at 538: my mid-season awards column!

Offensive Player of the Year: David Johnson, RB Arizona Cardinals

The Cardinals running back leads the league with 1,112 yards from scrimmage through eight games. He’s averaging over 80 yards rushing and 50 yards receiving per game, which has only been accomplished by four other players in NFL history. But what’s most impressive has been his consistency: Johnson has gained at least 100 yards from scrimmage in every game this year, making him just the 12th player since 1960 to do that in each of his team’s first eight games. Every other player this year has at least three team games in which they failed to gain 100 total yards.4 He’s also averaging 4.5 yards per run and 11.6 yards per reception while scoring eight touchdowns, showing that Johnson’s season hasn’t been fueled only by a heavy workload.

You can read the full article here.

{ 12 comments }
For the 49ers, run defense is more of a suggestion

For the 49ers, run defense is an aspirational thing.

In 2013, the Bears allowed 100-yard rushers in six straight games: those players were Eddie Lacy, Reggie Bush, Ray Rice, Benny Cunningham, Adrian Peterson, and DeMarco Murray. Chicago was the 5th team since 1960 to allow such a streak.

In 2007, the Browns began the season by allowing 100-yard games to Willie Parker, Rudi Johnson, LaMont Jordan, Willis McGahee, Sammy Morris, and Ronnie Brown.

In 2006, the Rams had their own six-game stretch of allowing opposing running backs to hit the century mark: those backs were LaDainian Tomlinson, Larry Johnson, Maurice Morris, DeAngelo Williams, Frank Gore, and Edgerrin James.

In 1998, the Bengals allowed an opposing runner to hit the 100-yard mark in six straight games: Priest Holmes, Kordell Stewart, Eddie George, Napoleon Kaufman, Terrell Davis, and Fred Taylor were the stars there.

The first time, since at least 1960, that a team allowed a player to rush for at least 100 yards in six straight games came in 1979, against the Raiders.  Oakland only allowed six 100-yard rushers all season, but it happened in consecutive weeks  by Paul Hofer, Earl Campbell, the 7th best player named Mike Williams in NFL history, Rob Lytle, Chuck Muncie, and Mike Pruitt.

But now, for the first time in NFL history, the San Francisco 49ers have allowed a 100-yard rusher in seven straight games. Fozzy Whittaker went 16-100 in week 2, Christine Michael had 20-106 in week 3, Ezekiel Elliott had 23-138 the next week, David Johnson went off for 27-157 in week 5, LeSean McCoy ran roughshod 19-140-3 the following week, and Jacquizz Rodgers had 26-154 last week.

Today? Mark Ingram had 15 carries for 158 yards.  Up next week? A rematch against David Johnson and the Cards.

{ 4 comments }

Week 9, 2016: Gameday Thread

Let’s fire up the gameday thread. Two articles from this week of note in preparation of Sunday Night Football:

  • At 538, is the Broncos pass D better than ever?
  • At 538, are the Raiders penalties part of the reason for the team’s success?

Tonight’s game should be really fun to watch, if nothing else because it’s cool to see both of these teams playing well at the same time. In Elo ratings parlance, 1500 is the rating of an average team. Well, this is the first time since 2003 that both the Raiders and Broncos are above-average in Elo ratings.

That’s crazy, although largely because of Oakland’s below-average play. Just once, in 2011, was Oakland above 1500 and Denver below 1500. The graph below shows the Elo ratings for both teams entering all Raiders/Broncos games since 1960, along with the average rating of the two teams. It includes tonight’s game as the last data point: [continue reading…]

{ 35 comments }

On average, the fumbling team has recovered 56% of all fumbles this year. But that hasn’t been the case with the Giants. New York has fumbled 11 times this year, which means you would expect them to recover 6.2 of those fumbles. But the Giants have 8 lost fumbles this year, which means the team has recovered only 3 of those 11 fumbles, or 3.2 fewer fumbles than expected.

That’s really bad, although not the worst in the league. Carolina has fumbled 7 times, so we would expect the Panthers to have recovered 3.9 of those fumbles. Instead? Carolina is 0-for-7, so the Panthers have recovered 3.9 fewer fumbles than expected.

But the Giants haven’t recovered the ball frequently when their opponent fumbles, either. New York’s opponents have 8 fumbles, so you would expect the Giants to have recovered 3.5 of them (or, stated another way, that their opponents should have recovered 4.5 of them). But Giants opponents have lost just one fumble this year, so New York has recovered 2.5 fewer fumbles than expected in this area of the game, too. Add it up, and that means the Giants have recovered 5.7 fewer fumbles than you would think. And that New York has recovered just 21% of all footballs to hit the ground in their games, regardless of the fumbling team

Here’s the data for all 32 teams through week 8 plus Thursday night. Here’s how to read the Steelers line. Pittsburgh has 9 fumbles of its own, but has only lost 2 fumbles, so the Steelers own fumble recovery percentage is a robust 78%, and Pittsburgh has recovered 2.0 more fumbles than expected. Meanwhile, Steelers opponents have 10 fumbles, and Steelers opponents have lost 5 of them, so the Steelers have recovered 50% of all fumbles here, too. [1]Note that “Opp FR%” means percentage of opponents fumbles that your team recovers. So Denver, at 72.7%, has recovered a lot of those fumbles. This means the Steelers have recovered 0.6 more fumbles than expected of their opponents, and therefore 2.6 more fumbles overall than expected. The final column shows that Pittsburgh has recovered 63.2% of all fumbles in play this year, second most to those always-lucky Browns. [continue reading…]

References

References
1 Note that “Opp FR%” means percentage of opponents fumbles that your team recovers. So Denver, at 72.7%, has recovered a lot of those fumbles.
{ 3 comments }

538: Is Denver’s Pass Defense Even Better? 

Today at 538: yes, really, Denver’s pass defense is even better this year.

Football studies have generally shown that offenses are more consistent from year to year than defenses, and regression to the mean is always a key part of any analysis for a historically great unit. As a result, we wouldn’t expect Denver’s 2016 pass defense to be anywhere near as good as the 2015 one. And that’s exactly what you see with most of the other teams on the list above.

The other pass defenses on the top 20 list above were, on average, 1.53 net yards per attempt better than average against the pass in their dominant season; however, in their first eight games of the following season, they were just 0.52 NY/A better than average. That’s a sign of how difficult is it for dominant defenses to sustain that level of excellence over a long period. Defensive backs and pass rushers are two of football’s most health-dependent roles, and even one player losing a step or leaving in free agency can sink a unit. But so far this season, the Broncos have been even better that last season, jumping from 1.30 NY/A better than league average to 1.73.

You can read the full article here.

{ 9 comments }

The Washington Redskins have made five Super Bowls in their history:

  • To conclude the 1972 season, with Republican Richard Nixon in office as President of the United States;
  • At the end of the 1982, 1983, and 1987 seasons, with Republican Ronald Reagan as the sitting POTUS;
  • In January 1992, during the final year of Republican George H. W. Bush’s presidency.

During the Super Bowl era, Washington has gone 272-180-3 while a Republican is in office. That translates to a .601 winning percentage, the best of any team.

But the Redskins have been a lot worse with a Democrat in office. In fact, Washington has a lowly 150-201-5, a 0.428 winning percentage that is the fourth worst of any team during the Super Bowl era. Washington’s best years came under Reagan, Bush, Ford, and Nixon, while the franchise’s worst years have been under Obama, Clinton, and LBJ.  Take a look: [continue reading…]

{ 8 comments }

Today at 538:

So far this season, 45 players have been flagged for at least five offensive penalties, and six of those players are Raiders: backup lineman Vadal Alexander (8), followed by Penn (7), center Rodney Hudson (6), guard Gabe Jackson (6), WR Michael Crabtree (5) and guard Kelechi Osemele (5). In total, Raiders offensive linemen have been flagged for 33 penalties, nine more than any other offensive line in the league.

That’s a lot of penalties, but what that analysis is missing is what’s happening on all the plays that don’t result in a penalty — especially if those plays include ones where the refs don’t throw a flag because they’ve already thrown so many. And Oakland’s offensive line is doing really, really well on those plays. No team has spent more 2016 salary cap dollars on its offensive line than the Raiders, and it’s paid off: Oakland has been sacked on just 2.7 percent of all pass plays this season, the lowest rate in the NFL. And Oakland’s top three running backs — Latavius Murray, DeAndre Washington, Jalen Richard — aren’t highly-regarded and weren’t drafted with premium picks, but they have rushed 156 times for 763 yards and 6 touchdowns, averaging 4.9 yards per attempt. The Oakland line is getting things done.

You can read the full article here.

{ 1 comment }

Three victorious teams stood out in week eight as pass-heavy:

  • New England blew out the Bills, and led 41-17 until the final minute of the game. But despite a Game Script of +13.0, that didn’t stop the Patriots from throwing on over 60% of all plays. Tom Brady has deservedly received a lot of press this week, but the ratio against Buffalo was also a sign of an emerging problem: the running game hasn’t been very good. LeGarrette Blount had 18 carries for 43 yards, and New England’s running game has been inconsistent all year. Of course, that could just lead to more Brady throws, which may not be such a bad thing.
  • For Oakland, Derek Carr had 59 pass attempts (and just two sacks) in a monster game against the Bucs. The Raiders running backs had some success, but this was a competitive game throughout. That’s a sign, tho, that the Raiders want to put the ball in the hands of Carr and Michael Crabtree (16 targets) and Amari Cooper (15 targets).
  • The Chiefs rolled against the Colts, but even though Alex Smith went down, Kansas City stayed pass happy under Nick Foles. Kansas City passed more than you would expect from a team with a +8.0 Game Script, but that also may be a sign that the Colts pass defense is so bad that teams will pass on it regardless of situation.

Below are the Week 8 Game Scripts numbers. [continue reading…]

{ 13 comments }

The most dominant win of week 9 came from…. Tulsa? Entering the week, Memphis was 5-2, with only road losses against ranked teams in Memphis and Navy. Memphis ranked 38th in the SRS last week, and was a 6-point favorite at home against Tulsa. But the Golden Hurricane broke open the game in the second half, scoring the final 24 points en route to a 59-30 victory. Running back James Flanders had 33 carries for 249 yards and 5 touchdowns, including scores of 52 and 48 yards.

In slightly more relevant week 9 news, there was some B12 on B12 crime this weekend, as the last two remaining teams in the conference went down.  Oklahoma State had the 2nd best SRS performance of the week, winning by 17 against previously unbeaten West Virginia. Texas was a bit less impressive, but still had the third best B12 performance of the week in a 35-34 home victory against Baylor.

But perhaps the most notable performance of the week came from Auburn, as the Tigers went on the road and scored 13 fourth quarter points to beat Ole Miss in Oxford, 40-29.  Auburn now seems like a legitimate candidate to beat Alabama, or at least give the Tide a competitive game in the Iron Bowl.

Below are the single-game SRS results from this weekend. As always, thanks to Peter R. Wolfe for providing the game scores. [continue reading…]

{ 1 comment }

Week 8, 2016: Gameday Thread

It’s time to fire up the gameday thread for another week.

{ 32 comments }

Most Plays Without Scoring a Touchdown

One of my favorite boxscores comes from a Steelers-Texans game in 2002. The Jets played at 4:15 that day, and I was living in Pennsylvania at the time, so I got to watch that game in its entirety. And the game was baffling on every level.

The expansion Texans had just three first downs the entire game. Three! David Carr completed 3 of 10 passes for 33 yards, with all three going to tight end Billy Miller. He was sacked four times, so Houston had 10 net passing yards on 14 dropbacks.

The Texans weren’t much better on the ground, running 26 times for 37 yards. That’s 47 total yards of offense with no touchdowns! In an entire game! And when you hear that the final score was 24-6, one would have to assume that Houston lost. But the didn’t. They won! They won 24-6!! In a game where they had 47 yards of offense and no touchdowns! That remains the fewest yards ever gained by a team in a winning effort. Steelers linebacker Joey Porter said it best:

Hold a team to under 50 yards offense, you’d think you’d have a chance to win at least….To get blown out when that happens, it’s tough.

Houston, of course, scored three defensive touchdowns, including two by former Jet Aaron Glenn. But what made watching the game even more confusing was that the Pittsburgh was pretty productive on offense, with 422 yards. Then again, the Steelers also had 15 drives and a whopping 95 plays, thanks due Houston recording eight 3-and-outs.

So why am I bringing that game up now? After watching the crazy Seahawks/Cardinals game last week, I was stunned by how Arizona was somehow kept out of the end zone all night. The Cardinals ran a whopping 90 plays, but the game ended in a 6-6 tie.

So I ran the numbers, and guess what? The only time in NFL history that a team ran more plays and failed to score a touchdown was Pittsburgh in that game against Houston.

The table below shows every game in NFL history where a team had 80 plays and zero offensive touchdowns: [continue reading…]

{ 4 comments }

Joe Flacco’s Career, My Graphic Novel

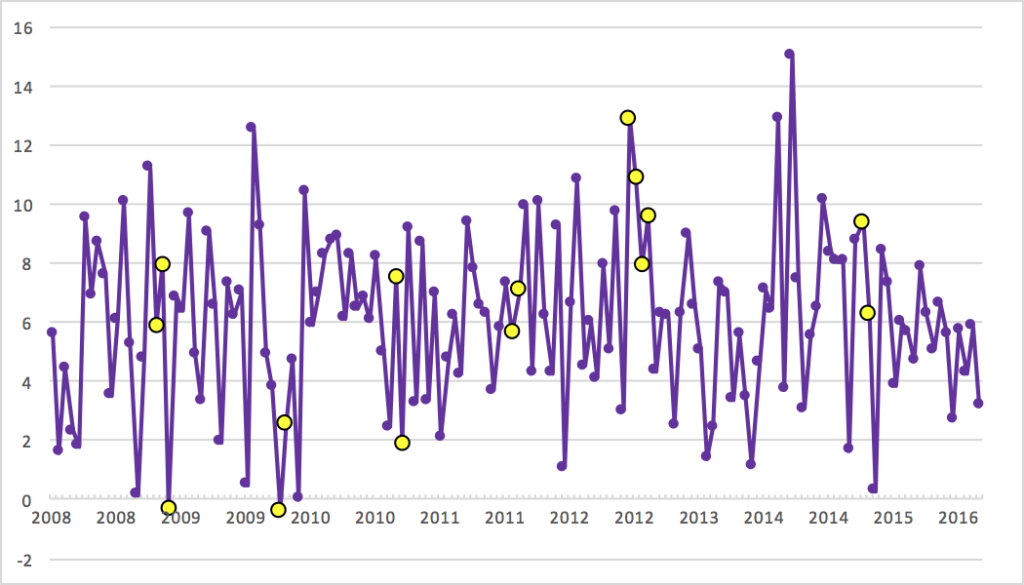
My favorite measure of quarterback play is Adjusted Net Yards per Attempt. For new readers, ANY/A is simply yards per attempt, but it includes sacks (both in the denominator and with those yards lost deducted from the numerator) and adjustments for touchdowns (20-yard bonus) and interceptions (45-yard penalty).

I am going to use a modified version of that formula today, by basing my formula around yards per dropback rather than yards per attempt. The only difference? Spikes are discarded, scrambles (and yards gained on scrambles) are included, but those are both improvements to the formula.

With that said, here is Joe Flacco‘s modified ANY/A average in every game of his career, plotted from his first game in week 1 of 2008 through week 7 of 2016.  I have made the data points that represent playoff games larger and in yellow.  The four dots next to each and relatively high on the graph represent, of course, his Super Bowl run in 2012.

flacco [continue reading…]

{ 9 comments }

538: Hue Jackson’s Browns Are 0-7

Today at 538: What Does An 0-7 Start Mean For An NFL Coach?

The Browns hired Hue Jackson to lead the team’s latest rebuilding effort in a move that was regarded as one of the best coaching hires of the offseason. In an offseason in which the Browns also brought in Paul DePodesta as chief strategy officer to turn the franchise around, it seemed like Cleveland had its coach of the future. But Jackson is now just the 20th coach since the AFL-NFL merger in 1970 to fail to win a game in his team’s first seven contests.

You can read the full article here.

{ 2 comments }

In week 1, the Chargers lost to the Chiefs despite a Game Script of +10.3. San Diego led 21-3 at halftime and 24-3 in the third quarter, but the Chiefs ultimately won in overtime.

It’s pretty unusal to lose with a +10 Game Script, or stated another way, it’s pretty unusual to win with a -10 Game Script. But that’s exactly what San Diego did in week seven, beating Atlanta with a Game Script of -10.2. The Chargers trailed 27-10 in the first half, but won in overtime, 33-30. The Chargers still had an element of balance in the game — Melvin Gordon had 22 carries for 68 yards and two touchdowns — while the Falcons were done in by the team’s last three drives ending on an interception, a missed field goal, and a turnover on downs.

Below are the week seven Game Scripts data. As is customary around these parts, I’ve lowlighted the Seahawks/Cardinals game in blue as a result of their tie (you can move your cursor over that row to see it more clearly, not that I know why you would want to). [continue reading…]

{ 7 comments }

Adam Steele is back for another guest post. You can view all of Adam’s posts here. As always, we thank him for contributing.


Previously, I introduced my new metric — Adjusted Points Per Drive — for measuring team offense. I thought it would be fun to apply the same methodology to quarterbacks, which I what I’m doing today. I highly encourage you to go back and read the previous post if you haven’t already, because I don’t want to clutter today’s post by repeating all of the calculation details.

Unfortunately, I don’t have drive stats for individual games, so there’s going to be some approximation here. To calculate a quarterback’s career Adjusted Points Per Drive (AjPPD), I simply take his team’s AjPPD from each of his playing seasons and weight those seasons by games started. This will give us a measure of a quarterback’s scoring efficiency, but it doesn’t account for volume or longevity. That’s where Adjusted Offensive Points (AjPts) comes in handy.

I assign each QB a portion of his teams’ Adjusted Points, then compare that to league average to calculate Points Over Average (POA). The formula for calculating a given season’s POA = (Tm AjPts – 315) * (GS / 16). The 315 figure is derived from multiplying my normalized baselines of 1.75 AjPPD by 180 drives per year, meaning the average team scores 315 Adjusted Points per season.

I’ll use Ben Roethlisberger’s 2015 season as an example: Pittsburgh scored 400 Adjusted Points and Ben started 11 games, so his 2015 campaign is worth (400 – 315) * (11 / 16) = 30 POA. Do this for every season and we have Career POA, which is the primary metric I’ll be using here. However, some people prefer to rank quarterbacks based on their peak years rather than their entire career, so I added the “Peak” column which is the sum of each quarterback’s three best POA seasons.

This study includes all QB’s who started their first game in 1997 or later, and made at least 40 starts between 1997 and 2015 (partial numbers from 2016 are not included). These criteria leaves us with 56 quarterbacks. Before we dig into the results, it’s worth noting that the correlation between Career POA and ANY/A+ is a healthy 0.92. We all know that the NFL is a passing league, but drive efficiency is even more dominated by the passing game than I thought. According to r2, 85% of the variance in Adjusted Points Per Drive is explained by a basic measure of passing efficiency. That doesn’t leave much room for the running game to have an impact. In fact, I’ll go as far to say that rushing efficiency has no appreciable impact on scoring for the majority of teams. That’s not to say running the ball is useless; offenses must run occasionally to keep the defense honest, and running comes in handy for converting short yardage and bleeding the clock. But, to quote Ron Jaworski, “Points come out of the passing game!”

Time for the rankings… [continue reading…]

{ 8 comments }