≡ Menu

Week 3, 2016 Game Scripts: Tampa Bay Turns To Winston

Previously:

In week 3, only one team won with a negative Game Script. That was early season Game Script favorite Washington, who trailed 21-9 in the first half but came back to win against the Giants, 29-27. In the process, Washington produced its most run-heavy game of the year, with 30 carries (including two kneels) against 37 passes (excluding one spike). Was there a correlation between running more and winning? Washington running backs weren’t very effective — they had 27 carries for 97 yards — but the balance may have helped Kirk Cousins have his best game of the year (9.60 AY/A, 75.1 QBR).

Given that there were no other teams that won with negative Game Scripts, let’s get to the results: [continue reading…]

{ 8 comments }

Today at 538:

The Baltimore Ravens and Minnesota Vikings are both 3-0 to start the year, two of just five undefeated teams remaining in the NFL. But given the way that both teams have played so far, there are a lot of questions about how sustainable their success will prove to be as the season continues.

Let’s start with the Ravens. Although 27 other teams wish they had Baltimore’s record, I’m not sure 27 other teams wish they had Baltimore’s team. Being 3-0 is great, but the Ravens have managed to achieve their perfect record while racking up about as few style points as possible.

You can read the full article here.

{ 23 comments }

The early AFL was unstable, which probably isn’t too surprising. This was most clear in 1963, which must be one of least sticky league seasons in pro sports.  The Oakland Raiders, under new coach Al Davis, jumped from 1-13 to 10-4. The San Diego Chargers, who added quarterback Tobin Rote and had a breakout season from second-year wide receiver Lance Alworth, went from 4-10 to 11-3 and league champions.

Meanwhile, three of the eight teams in the AFL had huge declines.

  • The Houston Oilers had been the class of the early AFL, winning the title in ’60 and ’61, before falling in the championship game in ’62. But in ’63, Houston dropped from 11-3 to 6-8.
  • Houston lost in the ’62 AFL title game to Lamar Hunt’s Dallas Texans, who went 11-3 behind coach Hank Stram and quarterback Len Dawson. But  after moving to Kansas City in the off-season, the team went just 5-7-2.
  • Denver went 7-7 in 1962,  with a pass offense and a pass defense that was both about average.  But in ’63, both ranked last in the league, and the Broncos fell to 2-11-1.

The graph below shows each team’s winning percentage in 1962 (on the Y-Axis) and in 1963 (the X-Axis), along with a trend line.  In a stable leage, the teams would form a diagonal line that starts on the bottom left and goes up to the bottom right; i.e., as win percentage rises in Year N, it rises it Year N+1. Yet here, the trend line is the exact opposite.  That’s because there was a strong negative correlation (-0.49) between winning percentage in the two years. [continue reading…]

{ 14 comments }

Bill Belichick and the Patriots are now 3-0. That has increased Belichick’s career record to 226-113-0, for a 0.667 winning percentage. He moved into a tie with Curly Lambeau for fourth-place in career wins, and already ranks third in career wins over .500.

The table below shows the career leaders in wins; Belichick trails only Shula, Halas, and Landry in wins,  Shula and Halas in wins over 0.500, and Halas, Shula, and Brown (among coaches in the top ten in wins) in winning percentage.


Rk Coach Yrs Yr-Yr G W
L T W-L% G > .500 Yr plyf G plyf W plyf L plyf W-L% Chmp
1 Don Shula+ 33 1963-1995 490 328 156 6 .677 172 19 36 19 17 .528 2
2 George Halas 40 1920-1967 497 318 148 31 .682 170 8 9 6 3 .667 6
3 Tom Landry+ 29 1960-1988 418 250 162 6 .607 88 18 36 20 16 .556 2
4 Bill Belichick 22 1991-2016 339 226 113 0 .667 113 14 33 23 10 .697 4
5 Curly Lambeau 33 1921-1953 380 226 132 22 .631 94 5 5 3 2 .600 6
6 Paul Brown 25 1946-1975 326 213 104 9 .672 109 15 17 9 8 .529 7
7 Marty Schottenheimer 21 1984-2006 327 200 126 1 .613 74 13 18 5 13 .278 0
8 Chuck Noll+ 23 1969-1991 342 193 148 1 .566 45 12 24 16 8 .667 4
9 Dan Reeves 23 1981-2003 357 190 165 2 .535 25 9 20 11 9 .550 0
10 Chuck Knox 22 1973-1994 334 186 147 1 .558 39 11 18 7 11 .389 0

Halas started coaching (and owning, and well, lots of other things) back in 1920, so he’s really from a different era.  But it’s interesting that Shula has more wins, a better winning percentage, and has more wins above 0.500 than Belichick, but I don’t think many people would say he was a better coach.  I want to investigate why.

Shula has a 2-0 career record against Belichick, with those wins coming on the road in 1992 and 1993. But, of course, Belichick’s first run in Cleveland came when he was a much less successful coach. Let’s take a look at Belichick’s year-by-year winning percentage, through 2015. A fun note: Belichick has never gone 8-8 in his career: he was above .500 just once in five years in Cleveland, and below .500 just once in 16 (and counting) years in New England: [continue reading…]

{ 35 comments }

Previously: Week 1 Game Scripts

The Chargers produced a Game Script of +20.0 in a blowout win over the Jaguars that was worse than the final score indicated; San Diego was up by 21 points before the 21-minute mark of the game! The Cardinals (+15.9 vs. Tampa Bay) and Patriots (+15.6 in a 7-point win over Miami) also had monster Game Scripts in week 2.

Two teams did pull off massive comebacks on Sunday. The first was in Cleveland, where the Ravens came back from a 20-0 deficit to beat the Browns, 25-20. Cleveland became just the 5th team to score 20+ points in the 1st quarter, and then lose while getting shut out for the rest of the game.  The game seemed to turn on a blocked extra point returned by Tavon Young for two points after Cleveland’s final score; that was just the second time an extra point has been returned for two since the rule change was instituted last year.  The other comeback was in Detroit, where the Titans scored 13 4th quarter points to beat Detroit, 16-15, and tank my survivor dreams in the process.

Below are the week 2 Game Scripts: [continue reading…]

{ 0 comments }

538: What Is Wrong With Aaron Rodgers?

Today at 538: What is wrong with Aaron Rodgers?

From 2008 to 2014, Rodgers averaged 7.34 yards per dropback,1 according to ESPN’s Stats & Information Group. Rodgers’s rate was the second-best during that time period and just 0.01 yards per dropback behind Peyton Manning’s. That sort of dominant play earned Rodgers two MVP awards and helped the Packers win a Super Bowl.

Recently, things haven’t gone quite so well. Rodgers has averaged 5.79 yards per dropback since the start of 2015. Since November of last year, the Packers are just 5-7. And Rodgers is in the middle of a cold spell prolonged enough to prompt his coach to chip in with a vote of confidence — never a great sign. But what’s to blame for the decline — a change in scheme? Rodgers’s skills? The steady physical destruction of his most trusted receivers? That’s tough to untangle, but we can give it a try.

You can read the full article here.

{ 4 comments }

Adrian Peterson Was Declining Before His Injury

Adrian Peterson has a torn meniscus, which is expected to keep him out until at least December. Given Peterson’s age — he’s 31, with his half-birthday coming yesterday — it’s reasonable to start thinking about whether the end is near for Peterson.

In his last 8 games (excluding playoffs), he rushed 150 times for 529 yards (3.52) with 5 TDs, one fumble, and 26 first downs. Prior to this stretch, Peterson had averaged 159 carries, 786 yards (4.95), 6.5 TDs, 2.24 fumbles, and 37 first downs. Given his performance in the one playoff game during that stretch (23 for 45 with one fumble), including that would only make the numbers look worse.

I came up with a relatively simple adjusted rushing yards metric to measure running back performance (note that in the formula below, rushing TDs are actually worth 20 yards because all rushing TDs are also rushing first downs):

(rushing yards + rushing first downs * 9 + rushing TDs * 11 – fumbles *30) minus (rush attempts * 5)

This is basically a mix of rush efficiency and rush quantity: we take rushing yards, add some other information, and then provide a penalty for each attempt used. The graph below shows Peterson’s game-by-game results for his career, along with, in black, a trailing-8-game average: [continue reading…]

{ 15 comments }

Sam Bradford, Career Passing By Game

On Sunday night, Sam Bradford had a great game in his first start with the Minnesota Vikings. He completed 22 of 31 passes for 286 yards, and while he was sacked 4 times (for -32 yards), he also threw for 11 first downs and 2 touchdowns with no interceptions. That translates to an 8.40 Adjusted Net Yards per Attempt average, giving 20 yards for every touchdown and deducting for sacks. If you also give him 9 yards for his other 9 first downs (remember, touchdowns are first downs), that means Bradford a 10.7 average.

Was that the best game of Bradford’s uneven career? I thought it might be up there, so I decided to run the numbers. Turns out, Bradford’s had more good games in his 65-game career than I had remembered.

  • In October 2013, Bradford had the most efficient game of his career: he went 12 of 16 for 117 yards with 3 TDs and 9 first downs, and no sacks or interceptions in a blowout over Houston. That gave him a career-high 13.8 ANY/A with the first down bonus included. (
  • As a rookie against the Broncos, Bradford might have had the best combination of quantity and quality in his career: He went 22 of 307 for 308 yards with 3 TDs with 16 first downs, and no interceptions or sack yards lost (he did take two sacks). That gave him a 12.4 ANY/A with the first down bonus, the second highest rate of his career.

The graph below shows all of Bradford’s games and how well he performed (using ANY/A with the first down bonus), in order, and color-coded to match the team he was playing for. I have also included a black line which represents league-average play that season. [continue reading…]

{ 8 comments }

538: Post-Week 2, 2016: Two’s A Trend

Today at 538: if Week 1 is National Jump to Conclusions Week, then Week 2 is when we can begin to trend spot.  For example:

Denver was a one-dimensional team last year, as the Broncos dominant defense overcame the team’s historically inept passing attack en route to a Super Bowl title. This year? The Denver defense looks just as fantastic. Consider:

  • In Week 1, Denver held Carolina to 333 yards and 20 points; in Week 2, Carolina gained 529 yards and scored 46 points (albeit with one touchdown coming on defense) while playing a 49ers defense that had recorded the only shutout on opening weekend.
  • In Week 2, Denver held Indianapolis to just 253 and 20 points, while the Broncos defense scored two touchdowns of its own! In Week 1, Indianapolis gained 450 yards and scored 35 points.

You can read the full article here.

{ 1 comment }

Guest Post: Linebackers and the Hall of Fame

Today’s guest post comes from one of the longest followers of this blog (and its predecessor), Richie Wohlers. Richie is 44-year-old accountant from Southern California who is a Dolphins fan despite never being to Florida. As always, we thank our guest posters for contributing.


This is the first part in my series looking at the NFL Hall of Fame.  I am going to take a look at which players are in the HOF, and look at some objective attributes of HOFers.  I am only going to focus on players who played any part of their career after the AFL-NFL merger in 1970.  While this will include many players who played in the pre-merger days, the bulk of the careers will have at least been played since 1960 with at least 21 combined teams.  Before the AFL came along there were generally many fewer teams, so things like draft position and Pro Bowl/All Pro honors are more difficult to compare.  Also, the game of pro football was much different before the 1950s.  I am mostly going to stick with looking at the few statistics that can be compared across positions, such as All Pros, Approximate Value, etc.

I created a very quick and simple formula to give each player a career score based on the average of six statistical categories (All-Pros, Pro Bowls, Weighted AV, Total AV, Super Bowl Appearances, Super Bowl wins) at a position.  Each category is weighted equally (though, the categories are related, and winning a Super Bowl essentially becomes worth 2 categories).  The average HOF player at each position will have a score of 100.  This makes an easy (though not exhaustive) way to rank careers, and to quickly see if anybody is missing from the HOF.  I feel that using honors (Pro Bowl, All Pro) helps factor in peak value, AV factors in total value and Super Bowls helps factor in players on winning teams, who HOF voters seem to favor.

Today I am taking a look at linebackers. [continue reading…]

{ 68 comments }

Regular readers know all about Game Scripts, but you can learn more about them here. Essentially, Game Scripts is the term I’ve used to represent the average margin of lead or deficit over the course of every second of a game.

Last year, I detailed the Game Scripts each week, and I’ll do that again this year.  At the top right of every page, you can see the 2015 Game Scripts, and the dropdown arrow will bring up the 2014 and 2013 results, too.

In week 1, six teams won with negative Game Scripts, including a few big comebacks. The Panthers led 17-7 at halftime in Denver, but the Broncos came back behind two C.J. Anderson touchdowns.  Oakland trailed 24-10 with 20 minutes left in New Orleans, but scored 25 points in the final 20 minutes to pull out a last-minute  win over the Saints.

But the big comeback, of course, was in Kansas City.   With 20 minutes left in that game, the Chiefs trailed 24-3.  With 3:57 left, Kansas City faced a 4th-and-5 at the San Diego 25-yard line; at that time, the Chiefs win probability was less than two percent.  Starting then, Alex Smith went 22 for 29 for 208 yards with 2 TDs and 14 1st downs, along with one interception, and ran three times for 14 yards and a touchdown.

The table below shows the week 1 Game Scripts: [continue reading…]

{ 5 comments }
Decker after another score

Decker after another score

For his career, Eric Decker has 5,222 receiving yards and 52 receiving touchdowns.  That means he’s grabbed one touchdown catch for every 100.4 receiving yards, an incredible ratio for a non-tight end.  And while touchdons can be fluky, that doesn’t feel the way with Decker, who has been a touchdown machine for his entire career across two teams and multiple quarterbacks.

To put this into perspective, I looked at all wide receivers who entered the NFL since 1978 who have at least 2,000 receiving yards through the end of the 2015 season.  Decker has the third lowest (i.e., most touchdown-heavy) rate at a touchdown every 100.4 receiving yards [1]For Decker, I included 2016, but for every other player, I have not updated their numbers, if any, with the results of this year.  The only two players ahead of him? Randy Moss and Dez Bryant.

In the graph below, I’ve plotted career receiving yards (’78-’15) on the X-Axis, and Receiving Yards/Receiving Touchdowns( ’78-’15) on the Y-Axis. In that case, lower = more of a touchdown machine. [continue reading…]

References

References
1 For Decker, I included 2016, but for every other player, I have not updated their numbers, if any, with the results of this year.
{ 3 comments }

538: Chiefs, Texans, Try to Join AFC’s Upper Crust

Today at 538: a look at the Chiefs and Texans game this weekend, with both teams trying to vault into the top tier in the AFC.

The AFC has an established hierarchy. The New England Patriots have appeared in the title game in five consecutive seasons, and teams only become legitimate AFC contenders after proving they can defeat the Pats. Denver has beaten New England three of the last four times the teams have played — including in last year’s title game — and won the AFC West in five straight seasons. And whichever team emerges from the top-heavy AFC North can’t be ignored, either: Baltimore won the Super Bowl four seasons ago, the Bengals have won 44 games since 2012, and the Steelers look like the second-best team in the AFC.

Two other teams are threatening to break into the AFC’s upper crust, and they happen to face off in Week 2. Kansas City has won 11 consecutive regular-season games, the longest active streak in the NFL. Houston finished 2015 on a hot streak of its own, winning seven of its final nine games; after an opening-day win in Chicago, the Texans join the Chiefs as the only AFC teams to win at least eight of their last 10 regular-season games. Yet despite those results, neither of these teams are viewed as part of the AFC’s top tier. And that’s because both teams are viewed as having relatively low ceilings. So the question for this season is, can either team raise its ceiling?

You can read the full article here.

{ 0 comments }

NFL Survivor Pool Thoughts, Week 2(2016)

Last week, I decided to pick Houston at home against Chicago, which worked out (as would have the other teams I was considering: Kansas City and Seattle). As long as you didn’t pick the Cardinals or Colts, you probably advanced last week, so let’s move on to week 2:

Date & TimeFavoriteSpreadUnderdog
9/15 8:25 ETNY Jets-1.5At Buffalo
9/18 1:00 ETAt Detroit-6Tennessee
9/18 1:00 ETAt Houston-2.5Kansas City
9/18 1:00 ETAt New England-6.5Miami
9/18 1:00 ETBaltimore-6.5At Cleveland
9/18 1:00 ETAt Pittsburgh-3.5Cincinnati
9/18 1:00 ETAt Washington-3Dallas
9/18 1:00 ETAt NY Giants-4.5New Orleans
9/18 1:00 ETAt Carolina-13.5San Francisco
9/18 4:05 ETAt Arizona-6.5Tampa Bay
9/18 4:05 ETSeattle-6.5At Los Angeles
9/18 4:25 ETAt Denver-6Indianapolis
9/18 4:25 ETAt Oakland-5Atlanta
9/18 4:25 ETAt San Diego-3Jacksonville
9/18 8:30 ETGreen Bay-2At Minnesota
9/19 8:35 ETAt Chicago-3Philadelphia

There are five teams that are 6.5-point favorites or greater, but I’m way too scared of Seattle against Los Angeles or of Baltimore on the road to take either of those teams. Miami is at New England, but I see no reason to take the Patriots now when Tom Brady and Rob Gronkowski are not around. Save the Patriots for later. [continue reading…]

{ 9 comments }

When Weaker Teams Sweep Stronger Teams

On Thursday, the Jets travel to Buffalo to face the Bills. Last year, New York went 10-6, but was swept by a Buffalo team that went 8-8. But that wasn’t even the oddest result of last year: 10-6 Seattle got swept by 7-9 St. Louis, and that wasn’t the oddest result last year, either.

The Ravens swept the Steelers last year, which wouldn’t ordinarily be notable. Except Baltimore went just 5-11 last year, while Pittsburgh went 10-6! Both games were very close: the first of those games was started by Mike Vick, involved two missed field goals by Josh Scobee in the final four minutes, and required kicks by Justin Tucker of 42 yards at the end of regulation and of 52 yards in overtime to secure the win.

The second one, though, was the true shocker: even though the game was in Baltimore, it was started by Ryan Mallett. For Pittsburgh, Ben Roethlisberger struggled mightily, completing just 24 of 34 passes for 220 yards with 0 TDs and 2 interceptions. The Steelers were 10-point road favorites, but lost, 20-17, when Roethlisberger’s 4th-and-15 pass fell incomplete.

Pittsburgh won 62.5% of its games last year, and Baltimore won just 31.3% of its games; that’s a difference of 31.3%, which ranks as the 5th weirdest result among division sweeps. The weirdest? That came in 1988, when the 11-5 Vikings were swept by the 4-12 Packers. The table below shows the top 100 or so weirdest division sweeps, and the Jets/Bills example from last year only ranks 51st: [continue reading…]

{ 15 comments }

538: Post-Week 1, 2016: Close Games Define Week 1

Today at 538, a look at why Week 1 (prior to Monday Night) was extraordinarily competitive:

But this year’s Week 1 results aren’t just close by Week 1 standards. The Broncos (over the Panthers), Bengals (Jets), Raiders (Saints) and Giants (Cowboys) all won by just 1 point: That’s the first time that four games in one week have been decided by a single point in 34 years.

Since 1993, only one week has been as close on average as the 5.1-point margin tallied so far on opening weekend — Week 5 of the 2001 season. Since 1993, the standard deviation of from the previously mentioned 11.6-point average margin of victory was 2.3 points. That makes this season’s Week 1 a true outlier: At 5.1 points (pending tonight’s games), it is 2.3 standard deviations from average. The graph below shows the average margin in each week of the regular season since 1993:

You can read the full article here. Good thing this was filed before Monday night’s games! The Steelers (38-16) and Rams (28-0) won by a combined 50 points, while the first 14 games were decided by just 72 combined points.

{ 1 comment }

Instant Analysis: Bowles Blunders Boosts Bengals

There were no shortage of characters worthy of finger-point when it comes to the Jets 23-22 loss to the Bengals yesterday.

  • Nick Folk missed an extra point and had a 22-yard field goal attempt blocked.  The latter error was just the second missed field goal from inside the 5-yard line since 2013. Obviously those missed points came back to haunt the Jets.
  • Brandon Marshall had just 3 receptions for 37 yards, and failed to haul in/dropped what could have been a game-saving catch on the final drive.

[continue reading…]

{ 29 comments }

Final 2016 NFL Division Odds

I never quite know what to post on the first Sunday of the season, so here are the final NFL 2016 Division Odds (as of prior to the Thursday night game). In each case, I’ll be showing the odds for each team to win its division as of May 23rd and as of September 8th, along with their vig-adjusted percentage based on those odds. Let’s start with one of three divisions with a clear favorite, and one of just two divisions with only one team having at least a 15% chance of winning the crown.

AFC East

Team5/23 Odds9/8 Odds5/23 Perc9/8 Perc
New England Patriots     5/115/1261.5%64.6%
Buffalo Bills            21/46/114.3%13.1%
New York Jets            21/413/214.3%12.2%
Miami Dolphins           8/18/19.9%10.2%

The Patriots raw odds actually went up over the last few months, even with the Tom Brady suspension becoming official. But because the Jets and Bills have seen their percentage drop, New England’s odds of winning another AFC East crown have increased. Buffalo’s had a rough offseason due to injuries, but it’s a little harder to explain why the Jets odds have gone down. New York has a very difficult schedule, which may play a part in that.

AFC North

Team5/23 Odds9/8 Odds5/23 Perc9/8 Perc
Pittsburgh Steelers      5/46/539.6%41.8%
Cincinnati Bengals       7/42/132.4%30.7%
Baltimore Ravens         11/47/223.8%20.4%
Cleveland Browns         20/112/14.2%7.1%

These odds have been pretty static, but a (very) small Cleveland hype train has emerged. Vegas sees the top 3 teams as very strong, but does have a clear 1-2-3 order, too. [continue reading…]

{ 0 comments }

Yes, The NFL Is Getting Younger

An interesting article from Kevin Clark at The Ringer this week, arguing that the NFL has an age problem. Let’s start by acknowledging that there are two claims in that statement: one, that the NFL is getting younger, and two, that this is a problem. I am only going to address the first one, but feel free to discuss either one in the comments.

The reason I’m not going to address the second point is that it is much tougher to analyze objectively. While Clark’s argument could be true, it’s no more convincing than Jason Lisk’s argument to the contrary: i.e., if a league is getting younger, that may be a sign that a league is getting stronger. A youth movement could be a signal that the prior generation of stars was unable to sustain their dominance as they aged because talented new blood was replacing them. Had a bunch of less-talented players entered the last few drafts, those aging stars would have held on, so a young league means a stronger league. Of course, that is just a theory, too. In reality, I feel very comfortable stating that the rookie wage scale is playing the dominant role in the youth movement in the NFL.

And yes, getting back to the first claim, there most certainly is a youth movement in the NFL. Here is a graph showing the weighted (by AV, naturally) age of the entire NFL for each year since 1970, with age being calculated as of 9/1 of each year.

age-nfl

As you can see, there has been a noticeable decline over the last five years, coinciding with the new CBA in 2011. In 2010, the average age was 27.5 years; last year it was down to 27.1, with nearly all of that decline happening in 2011, 2012, and 2013. [1]I’m not sure exactly what caused the spike in the early ’90s. My initial thought was free agency, but it’s really ’91 and ’92 that had the big jumps, which is just … Continue reading

And, to further support some of the claims in Clark’s article, yes, offensive linemen are getting younger, too. Here’s the same graph again, but with two changes: one, the Y-Axis goes from 26 to 28 instead of 25 to 29, and two, I have included just the average AV-weighted age of offensive linemen in orange.

age-nfl-ol

So it does seem that offensive linemen are getting younger at a pretty dramatic rate. But again, I’m not so sure that’s a bad thing, or even whether a decrease in quality is something we can measure. Consider that Clark’s article argues that the quality of play at the position is going down, and that Packers coach Mike McCarthy “is particularly concerned about the end of veteran lines, which were staples of the league when he entered as an assistant in 1993.” In another part, John Harbaugh is quoted as bemoaning that offensive linemen don’t know where “blitzers are coming from.”

Okay, but then in a different section, Clark quotes longtime NFL executive Phil Savage bemoaning the decline of defenders in the front seven:

“Look at edge pass rushers, outside linebackers,” Savage said. “A lot of them are one-trick ponies in college. They rely on speed, then they go to the NFL and get locked up and they don’t have a counter move. They can’t get reps at full speed, you can’t replicate this stuff in practice, and then when it’s a real game it’s very difficult.”

If line play is worse on both sides of the ball, is that something really detectable? It seems odd to me to argue that both offensive line play and the quality of play in the front seven are both in decline. That would seem to wash itself out, and certainly be hard to see with the naked eye.

What do you think?

References

References
1 I’m not sure exactly what caused the spike in the early ’90s. My initial thought was free agency, but it’s really ’91 and ’92 that had the big jumps, which is just before the start of free agency.
{ 12 comments }

Today’s guest post/contest comes from Thomas McDermott, a licensed land surveyor in the State of California, a music theory instructor at Loyola Marymount University, and an NFL history enthusiast. As always, we thank him for his hard work. You can read all of his guest posts at Football Perspective at this link.


The following is a bunch of data I’ve gathered regarding home-field advantage; hopefully some of you will find it useful for analysis, or for picking winners against the spread in your pick’em games this year!

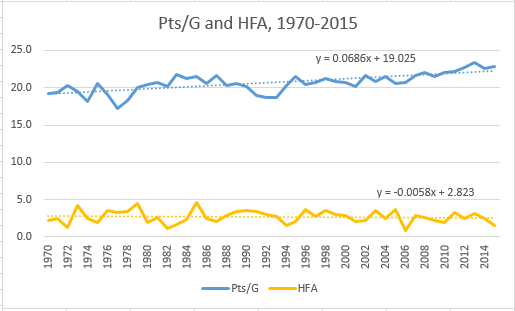
The general consensus is that the home team in a typical NFL game has an advantage of around 2.5 to 3 points, and this is right on: since 1970, the average team wins their regular season home games [1]The HFA number during the playoffs over that same period is 6.5, but that’s probably due to playoff seeding than fan/stadium involvement; it might be interesting to look into this further. by 2.7 points, [2]As far as what causes home teams to have an advantage at home, Brian Burke suggests in this article that it has more to do with environmental familiarity, and other factors, than the effect of … Continue reading with a high of 4.6 in 1985 and a low of 0.8 in 2006. If we do a linear regression, we can see that HFA appears to be in decline, but only slightly compared to points per game, which is obviously increasing:

pts hfa [continue reading…]

References

References
1 The HFA number during the playoffs over that same period is 6.5, but that’s probably due to playoff seeding than fan/stadium involvement; it might be interesting to look into this further.
2 As far as what causes home teams to have an advantage at home, Brian Burke suggests in this article that it has more to do with environmental familiarity, and other factors, than the effect of screaming fans.
{ 30 comments }

538: Carolina, Denver and Super Bowl Rematches

Today at 538, a look at the history of the Thursday Night Opener and how teams fare in Super Bowl rematches.  Also, in researching for this piece, I found one of my new favorite pieces of trivia:

On January 31, 1993, the Cowboys obliterated the Bills 52-17 in Super Bowl XXVII.  364 days later, Dallas beat Buffalo in the Super Bowl again, 30-13, the only time the same teams have ever met in consecutive Super Bowls.  But in between those historic games, the teams also met in Dallas during Week 2 of the 1993 regular season. The Cowboys, missing Emmitt Smith because of a contract dispute, lost 13-10 on a late field goal. It was a result symbolic of that entire Bills era: in games started by Hall of Fame quarterback Jim Kelly from 1990 to 1993, Buffalo went 14-0 in the regular season against the NFC, including a 4-0 mark against Dallas, New York, and Washington. Against those same teams in the Super Bowl, of course, the Bills went 0-4.

You can read the full article here.

{ 16 comments }

Football Perspective’s 2016 NFL Contest

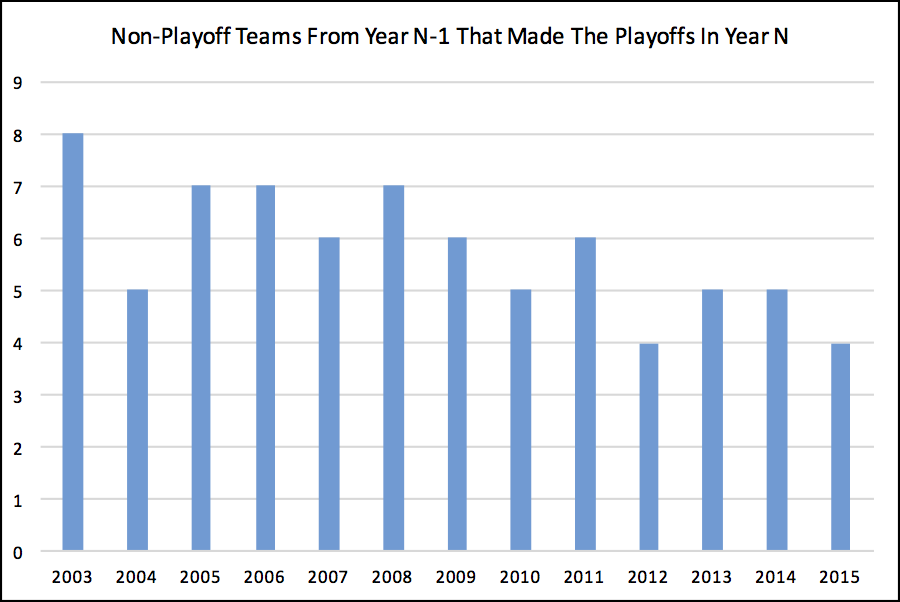
In 2002, the league realigned its division format with the addition of the Houston Texans. From 2003 to 2015, of the 156 teams that made the playoffs, 75 of them were not in the playoffs a year ago. In other words, about 5.8 teams each year make the leap from out of the playoffs to into the playoffs, with the remaining 6.2 teams being repeat entrants.

If we had run this study four years ago, those numbers would be flipped: from ’03 to ’11, 6.3 of the playoff teams each year were new, but in recent years, there has been less turnover among playoff teams. Last year, only four teams — Kansas City, Houston, Minnesota, and Washington — took the leap. The graph below shows the number of teams to make the jump from out of to into the playoffs in each year:

playoff tms [continue reading…]

{ 46 comments }

Projected Age of Each Team’s Receiving Game in 2016

In 2012, the Houston Texans went 12-4 and sent a whopping 7 offensive players to the Pro Bowl: QB Matt Schaub, RB Arian Foster, WR Andre Johnson, TE Owen Daniels, LT Duane Brown, LG Wade Smith, and C Chris Myers. But the success of that group probably feels like a distant memory, especially if you’ve looked at the Texans roster recently. Of that group, only Brown is still a Texan. In fact, Brown and RT Derek Newton are the only offensive players on the opening day rosters in both 2012 and 2016.

The Houston Texans threw a lot of money at Brock Osweiler this offseason, and also signed running back Lamar Miller. But a big reason for the turnover is that the wide receiver position has been completely remodeled: DeAndre Hopkins (24 years old, a first round pick in 2013), Will Fuller (22, 2016-1), Braxton Miller (24, 2016-3), Jaelen Strong (22, 2015-3), Keith Mumphery (24, 2015-5) are the five wide receivers on the team, while the tight end group (Ryan Griffin (26, 2013-6), C.J. Fiedorowicz (24, 2014-3), and Stephen Anderson (undrafted 2016) from Cal) is similarly young and new to Houston. [continue reading…]

{ 7 comments }

Running Back Production By Birth Year

Barry Sanders was born in 1968. Emmitt Smith was born in 1969. The next two years were pretty quiet — Dorsey Levens and Garrison Hearst were born in ’70 and ’71 — but business was about to pick up. Terrell Davis and Jerome Bettis were born in 1972, and Curtis Martin, Eddie George, Marshall Faulk, and Priest Holmes were all born in 1973. That’s a 6-year period that gave us some of the most important running backs in NFL history.

And it came at a really important time. Because the previous five years were not nearly as fruitful.

  • In 1967, there were no notable [1]Okay, this sounds kind of mean, but I mean notable in the sense of having historical importance to the game of football. running backs born.
  • In 1966, Thurman Thomas was born, but other than him, not much else.
  • In 1965, there were no notable running backs born.
  • In 1964, Neal Anderson [2]Note that the notable bar is very low. was born and that’s about it.
  • In 1963, Rueben Mayes was the most notable running back born.

[continue reading…]

References

References
1 Okay, this sounds kind of mean, but I mean notable in the sense of having historical importance to the game of football.
2 Note that the notable bar is very low.
{ 6 comments }

Bryson Albright was a defensive end for Miami (Ohio) who went undrafted in 2016, but has made the Buffalo Bills roster. Albright is a relatively unknown, so when he made the final cut, the Bills media asked Rex Ryan about him:

Q: How much do you like those stories? You know the odds for undrafted guys. To have a guy like that’s got to feel pretty good, right?

A: Well it does and I think that’s where you really saw our scouting department and our coaching department get together and focus on a couple of these guys and we hit on one. So we’ll see how it is, the kind of career he has, but yeah, you’re right. And I mention it every year to these guys that there’s more guys that went undrafted that have a 10 year or more career than there are first round picks. So I think every now and then you hit a guy that—and I’m not saying he’s going to be that, that would be great if he is—but as much effort and everything else that goes into the drafting of players, there’s some exceptions. And we’ll see if this young man will be one of those exceptions.

Mike Schopp, who works for WGR in Buffalo, tweeted me after hearing this claim, and wondered if it was true. And, well, I was pretty curious, too.

If we want to measure 10+ year careers, we need to look at players who entered the NFL in 2006 or earlier. To have a large enough sample, I picked 20 years, which means we’ll be looking at all players who entered the NFL from 1987 to 2006. There were 1,062 players who entered the league during that time frame and played for 10+ years, or roughly 53 per year.

255 of those players, or 24%, were first round picks. Undrafted players? Well, that’s limited to just 182 players. [continue reading…]

{ 4 comments }

Resting Starters Database

Adam Steele is back for another guest post. You can view all of Adam’s posts here. As always, we thank him for contributing.


In the same vein as Bryan Frye’s kneel, spike, and first down data and Tom McDermott’s adjusted SRS ratings, I want to contribute some corrections in data distortion. From a stat geek’s perspective, there’s nothing more annoying than strong teams resting their starters in the final week of the season, as it pollutes season long statistics with a game’s worth of junk data. In a 16 game season, even one meaningless outlier can have a big impact on season totals and averages. The most egregious example is the 2004 Eagles, who stormed out to a dominant 13-1 start only to mail in their final two games by a combined score of 58-17. Philly’s season totals look far better (and far more accurate) once those two meaningless games are removed from the sample. I went back to 1993 and noted every game where one team sat their starters and/or played vanilla football with no intention of trying to win. In some instances, a team was clearly going full bore in the first half, then waved the white flag after halftime. In these games, I pulled out the junk data from the second half only.

There are obviously going to be some judgment calls in deciding whether or not a team was really trying to win a given game. For example, this past season’s week 17 matchup between Seattle and Arizona could be viewed two different ways – Arizona was trying to win (at least in the first half) and Seattle just stomped them, or the Cards weren’t really trying even though their starters played the first half. I chose the latter. The one notable game I purposely left out was the week 17 Packers/Lions shootout from 2011. The game was technically meaningless for both teams, and Green Bay kept Rodgers on the bench, but otherwise all the starters played and were clearly playing to win. If the Packers didn’t care, Matt Flynn would not have thrown six TD passes. If you dispute any of the games I’ve listed, I’m happy to discuss and reconsider!

How to read the table: The first five rows are self-explanatory; “Type” designates whether the whole game should be discarded or just the second half; Points, PaTD, and RuTD indicate the points and offensive touchdowns scored during junk time (the stats I believe should be removed from the season data). Defensive numbers can be found by simply looking at the offensive numbers from the team’s opponent.

Team-OppYearWkTypePtsPaTDRuTD
TEN@IND201517Full2412
INDTEN201517Full3020
SEA@ARI201517Full3631
ARISEA201517Full610
WAS@DAL201517Half1010
DALWAS201517Half910
BUF@NE201417Full1711
NEBUF201417Full900
DEN@OAK201317Half300
OAKDEN201317Half1420
BAL@CIN201217Full1702
CINBAL201217Full2310
TB@ATL201117Full2420
ATLTB201117Full4523
OAK@KC201017Full3112
KCOAK201017Full1001
TB@NO201017Half1310
NOTB201017Half600
CIN@NYJ200917Full000
NYJCIN200917Full3704
GB@ARI200917Full3312
ARIGB200917Full710
IND@BUF200917Full701
BUFIND200917Full3030
NYJ@IND200916Half2601
INDNYJ200916Half601
TB@NO200916Half1701
NOTB200916Half000
NE@HOU200917Half1401
HOUNE200917Half2112
NO@CAR200917Full1001
CARNO200917Full2311
ARI@NE200816Full710
NEARI200816Full4732
TEN@IND200817Full000
INDTEN200817Full2310
TEN@IND200717Full1601
INDTEN200717Full1010
SEA@ATL200717Half2421
ATLSEA200717Half2730
IND@SEA200516Full1310
SEAIND200516Full2822
CIN@KC200517Full300
KCCIN200517Full3713
ARI@IND200517Full1310
INDARI200517Full1720
SEA@GB200517Full1711
GBSEA200517Full2311
MIA@NE200517Half1510
NEMIA200517Half1620
PHI@STL200416Full710
STLPHI200416Full2011
ATL@NO200416Full1301
NOATL200416Full2611
ATL@SEA200417Full2620
SEAATL200417Full2822
IND@DEN200417Full1420
DENIND200417Full3321
PIT@BUF200417Full2910
BUFPIT200417Full2402
NYJ@STL200417Full2910
STLNYJ200417Full3231
CIN@PHI200417Full3813
PHICIN200417Full1010
DEN@GB200317Full300
GBDEN200317Full3112
PHI@TB200117Full1720
TBPHI200117Full1301
TEN@PIT199917Half1610
PITTEN199917Half2921
STL@PHI199917Half1420
PHISTL199917Half2110
SF@SEA199717Full900
SEASF199717Full3841
PIT@TEN199717Full600
TENPIT199717Full1601
DEN@SD199617Full1001
SDDEN199617Full1610
SF@MIN199417Full1420
MINSF199417Full2101
DAL@NYG199417Full1001
NYGDAL199417Full1510
PIT@SD199417Half2121
SDPIT199417Half2002
PHI@SF199318Full3730
SFPHI199318Full3422

My plan is to eventually do this all the way back to 1970, then publish the “real” points scored and allowed for each team by prorating the pristine data to a full season.

{ 18 comments }

With so much content available for easy consumption, it’s easy for even really good pieces to get lost in the shuffle, or to fade out of memory soon after reading. But there is one passage, in one article, that has stuck with me more than anything I have read in 2016. And I wanted to share that with you guys.

Ezra Klein is the Editor-in-Chief at Vox, and he wrote an interesting article about Hillary Clinton in July. But today’s post has nothing to do with liberal politics, Klein, Vox, or Clinton.  Because the part that I retained from that article came from Deborah Tannen, a Georgetown linguist who studies differences in how men and women communicate.

Women, [Tannen’s] found, emphasize the “rapport dimension” of communication — did a particular conversation bring us closer together or further apart? Men, by contrast, emphasize the “status dimension” — did a conversation raise my status compared to yours?

Talking is a way of changing your status: If you make a great point, or set the terms of the discussion, you win the conversation. Listening, on the other hand, is a way of establishing rapport, of bringing people closer together; showing you’ve heard what’s been said so far may not win you the conversation, but it does win you allies.

Now, maybe you didn’t have the “mind blown” moment I had. This sort of thing may be naturally obvious to some of you.  But so much of our “communication” about sports — whether it’s from members of the media, comments on the internet, or talking with friends in a bar — is about the status dimension of conversation.  And given the dominant presence of the male gender in sports communication, it’s probably not too surprising that the status dimension of communication is the big driver.  For example, you’ve probably heard or said some variation of the following:

  • No, Joe Flacco is not elite, and let me tell you why, because I am so smart and after you hear my brilliant words, my status will be higher in your eyes.
  • Running and playing defense is the way to win football games — this is what my first NFL coach said, and because I played NFL football and you didn’t, your status will go down in my eyes if you disagree with me.
  • Here is some great stat that you didn’t know about but I did: look at how much I know! Now my status should go up in your eyes.
  • Yes, Tony Romo is a choker, look at what he did in this game; if you are going to disagree with me, I’m going to say you are crazy, and your status will decrease in your eyes.
  • If you look at what has happened over the course of NFL history, here is what you should expect to happen now: listen to me, I have studied history, and therefore my status should go up in your eyes.

Now, when you are engaging with an internet commenter, or listening to a talking head on TV, it’s easy to see why you might not think that bringing people closer together is the point of the communication.  But at least in the comments here, I do think there’s more to be had than just trying to convince someone of your point of view.  And there’s definitely more to be had when communicating in real life.

Stephen Covey wrote that most people do not listen with the intent to understand; they listen with the intent to reply. That’s something I’m guilty of, which is maybe why Tannen’s words have resonated so strongly with me. As the guy who has published an article every day for over 4 years, no one could benefit from this advice more than me.

But “listen more” doesn’t stick with me the way framing communication as either a status dimension or a rapport dimension does. It’s not listening for its own sake, but listening to bring you closer with someone. For me, there’s nothing easier than to revert to the idea that the purpose of communicating is to persuade someone of something; that’s just my default setting, and it may be yours, too. But it’s just as easy, and maybe more wise, to think of communicating as a way of getting closer to someone. And I think that may be the more important goal.

{ 12 comments }

NFL Survivor Pool Thoughts (2016)

I’m entering a Survivor Pool this year, so I plan on posting about my picks for exactly as long as I stay alive. Given the uncertainty involved in projecting an NFL season, I don’t think the payoff is there to project every week in the preseason and produce a model telling you which team to will use in each week. By week 5, a lot of our assumptions will have changed, injuries will make some teams an easy one-week play, and so. Flexibility is just as important as foresight, and there’s a lot of uncertainty about the future.

As a result, rather than getting too technical, I am simply going to place an early focus on trying to stay alive, with some emphasis on saving good teams for later. And to always look one week ahead.

Those two masters are in conflict right away, as one of the league’s most dependable teams is also the clear best choice in survivor leagues for week 1. Take a look at the current spreads: [continue reading…]

{ 16 comments }

NFC SRS Ratings, 2002 to 2015

On Friday, I looked at the SRS ratings of AFC teams. Today, let’s do the same for the NFC. And let’s start with the NFC East, which has been a consistently inconsistent division that, over time, looks average. The four NFC East teams have each won the division twice over the last 8 years, but the division as a whole has clearly declined over that period:

nfc east srs

The peak NFC East came in 2007: the Cowboys were the #1 seed, the Giants won the Super Bowl, and both Philadelphia and Washington had positive SRS grades. Last year? None of the four teams had a positive SRS grade. [continue reading…]

{ 5 comments }

Today at 538: Putting into context the fact that Dak Prescott, the 135th pick in the 2016 NFL Draft, is going to be the Cowboys starting quarterback in week 1. And that Trevor Siemian, a 7th round pick last year who has never seen meaningful action in an NFL game, is going to be the Broncos starter.

This is rarely charted territory in modern history: In the last 30 years, only three rookie quarterbacks drafted outside of the top 100 picks started their team’s season opener: Orton, Chris Weinke in 2001 and Steve Beuerlein in 1988.1 You have to go all the way back to 1977 to find a quarterback not selected in the first 130 picks of the NFL draft who then went on start his team’s season opener as a rookie.

You can view the full article https://fivethirtyeight.com/features/dak-prescott-is-not-your-average-week-1-starting-quarterback/.

{ 1 comment }