≡ Menu

2015 Team AV and Draft Value

Did you know Wilson was a 3rd round pick?

Did you know Wilson was a 3rd round pick?

The Kansas City Chiefs and the Seattle Seahawks both had very good seasons in 2015, with each team ultimately losing in the division round of the playoffs. But they got there with very different rosters when it comes to the NFL Draft.

The Chiefs have Alex Smith at quarterback, and while he wasn’t drafted by Kansas City, he was the first overall pick in 2005. Eight years later, offensive tackle Eric Fisher went first overall, while safety Eric Berry gives the team a third top-five pick, tied with five other teams for most in the league. Dontari Poe, Derrick Johnson, Marcus Peters, Jeremy Maclin, and Tamba Hali were all top-20 picks, too. Thought of another way, all of the top 5 Chiefs in Approximate Value were drafted in the top 20; the team’s next three leaders in AV are Hali and two high third round picks (Travis Kelce and Justin Houston).

Smith had 16 points of AV last year, or 7% of the Chiefs total AV. Since he was the first pick, and the first pick is worth 34.6 points, that means 7% of the Chiefs weighted “average draft value” is 34.6 points. Kelce had 8 points of AV, or 4% of KC’s AV; as a result, 4% of the Chiefs weighted “average draft value” is equal to 8.2, the value of the 63rd pick in the draft. Do this for every player on the team, and Kansas City’s average draft value is equal to 11.5 points, or in between the 37th and 38th picks in the draft.  That maybe doesn’t mean much in the abstract, but it’s the most average draft value of any team in the NFL.

Now, let’s look at Seattle. Eight Seahawks had at least 10 points of AV last year: those players were Russell Wilson (3rd round), Bobby Wagner (2nd), Richard Sherman (5th), Michael Bennett (undrafted), Doug Baldwin (undrafted), Garry Gilliam (undrafted), K.J. Wright (4th round), and Earl Thomas (14th overall). It’s easy to forget, given how talented Seattle is, but only Russell Okung, Bruce Irvin, Marshawn Lynch, and Thomas were first round picks (and only Thomas returns for 2016). And only two of the team’s regular contributors — Wagner and Justin Britt — were second round picks. In fact, Seattle’s averaged draft value using the weighting formula described above was 5.15 points, equivalent to the 101st pick in the Draft. That’s two full rounds lower than Kansas City’s average. [continue reading…]

{ 7 comments }

Memorial Day 2016

Pat  Tillman

Pat Tillman.

It is the soldier, not the reporter, who has given us freedom of the press. It is the soldier, not the poet, who has given us freedom of speech. It is the soldier, not the campus organizer, who has given us the freedom to demonstrate. It is the soldier, who salutes the flag, who serves beneath the flag, and whose coffin is draped by the flag, who allows the protester to burn the flag.
Father Dennis Edward O’Brien, USMC

Today is a day that we as Americans honor and remember those who lost their lives protecting our country. As my friend Joe Bryant says, it’s easy for the true meaning of this day to get lost in the excitement of summer and barbecues and picnics. But that quote helps me remember that the things I enjoy today are only possible because those before me made incredibly selfless sacrifices. That includes a number of football players who have lost their lives defending our country.

The most famous, of course, is Pat Tillman, the former Arizona Cardinals safety who chose to quit football to enlist in the United States army. On April 22, twelve years ago, Tillman died in Afghanistan. Over thirty years earlier, we lost both Bob Kalsu and Don Steinbrunner in Vietnam. You can read their stories here. For some perspective, consider that Hall of Famers Roger Staubach, Ray Nitschke, and Charlie Joiner were three of the 29 NFL men who served in the military during that war.

An incredible 226 men with NFL ties served in the Korean War, including Night Train Lane and Don Shula. Most tragically, World War II claimed the lives of 21 former NFL players.

Jack Chevigny, former coach of the Cardinals, and John O’Keefe, an executive with the Eagles, were also World War II casualties. The Pro Football Hall of Fame has chronicled the stories of these 23 men, too. Lummus received the Medal of Honor for his bravery at Iwo Jima, and you can read more about his sacrifice here. In 2015, the Giants inducted him into the team’s Ring of Honor. [continue reading…]

{ 2 comments }

Yesterday, I looked at the career leaders in fourth quarter/overtime game-winning field goals. It’s fun — in a purely trivial way — to see which kickers have made the most game-winners, but that’s only half the story. What about which kickers have missed the most key field goals?

I looked at all field goal attempts since 1994 that came when the game was tied or the kicking team was trailing by 1 or 2 points. I did not make any adjustments for era, or distance, or weather, since this is a trivia post on a Sunday in May. That said, man was Todd Peterson good at missing key field goals. Like, really, really good.

He missed 17 of his 34 field goal attempts in this situation; not only was that 50% rate the worst for any kicker with more than five misses, but his 17 misses truly lapped the field. [continue reading…]

{ 0 comments }

On Thursday, I looked at the quarterbacks with the most game-winning touchdown passes that came in the fourth quarter or overtime. Yesterday, I did the same for all touchdowns scored, either as a running touchdown, receiving touchdown, or otherwise. Three years ago, I looked at the same concept but for field goals: today, we revisit that post.

At the time, Morten Andersen was the career leader with 35, while Adam Vinatieri was hot on his trails with 30. Well, Vinatieri didn’t have a single game-winning field goal after the third quarter of any game in 2013 or 2014, but he then did it three times in two months last year (against Jacksonville in overtime from 27 yards, a 55-yarder against the Broncos with 6 minutes left, and a 43-yarder in the final minute against Atlanta.

Of his 33 game-winning field goals, 16 have been from 40+ yards away, with five of those being from 50+ yards, while his average game-winning field goal has come from 37.1 yards: [continue reading…]

{ 5 comments }

Three years ago, I looked at the players who have scored the most game-winning touchdowns in NFL history. Let’s be clear: tracking things like game-winning touchdowns is only interesting in a trivial sort way, but hey, it’s May.

Yesterday, I looked at which players had the most game-winning touchdown passes, so today we look at all other scores (whether rushing, receiving, via fumble recovery or later, or even non-offensive TDs). I looked at all games, regular and postseason, in all leagues, from 1940 to 2015 (and playoff games from pre-1940), and counted all touchdowns scored that put the player’s team ahead for good (with one exception: I did not count touchdowns scored when down by 7 and the team successfully went for two afterwards).

The table below lists all players with at least four such touchdowns. As he was three years ago, Marcus Allen stands alone with 10 game-winning touchdowns, including one via fumble recovery. [continue reading…]

{ 4 comments }

Three years ago, I looked at the career leaders in 4th quarter (and overtime) game-winning touchdown passes. That post is ready for an update, and there’s been some interesting movement at the top of the charts.

As a reminder: tracking things like game-winning touchdowns is only interesting in a trivial sort way. I looked at all games, regular and postseason, in all leagues, from 1940 (and before 1940 for postseason games) to 2015, and counted all touchdowns scored that put the player’s team ahead for good (with one exception: I did not count touchdowns scored when down by 7 and the team successfully went for two afterwards). The table below shows all players with at least 4 such game-winning touchdown passes.

Incredibly, Johnny Unitas is still the record-holder in this category. In 23 games, Unitas threw a touchdown pass in the fourth quarter to win the game for the Colts. His first came against Washington in 1956, with his last coming 14 years later against the Bears. The table below provides a link to all 23 such fourth-quarter, game-winning touchdown throws by Unitas: [continue reading…]

{ 20 comments }

The 2015 season was another spectacular one for wide receivers. Pittsburgh’s Antonio Brown outgained the NFL’s leading rusher by a record 349 yards. On a game-by-game basis, the leading receiver for every team in every NFL game this year, including playoffs, averaged 94.3 receiving yards, a post-merger record.

In fact, the average number of receiving yards gained by the leading receiver of each team has been steadily rising, which isn’t surprising.  The average was below 80 as recently as 1992, and below 70 in 1977, the year before the big passing rules changes went into effect.  But the 1962 NFL season had a slightly higher average, at 95.2, while the average leading receiver in a game in the ’64 AFL even broke 100.

The graph below shows the average number of receiving yards gained by each team’s leading receiver in every game in each season since 1960.  In all graphs today, the NFL line is in blue, while the AFL line is in red. [continue reading…]

{ 2 comments }

Brad Oremland is a longtime commenter and a fellow football historian. Brad is also a senior NFL writer at Sports Central. He’s also a semi-regular writer here, and you can view all of Brad’s Football Perspective writing at this page. Brad is working on a WR Project where he analyzes the best WRs over various ten year periods. That work is being produced over at Sports-Central, but Brad has offered to have it reproduced here as well. As always, we at the FP community thank him for his work.

Previous Best WRs By Decade Articles:


Last year, I wrote an article breaking down the best quarterbacks by decade, followed by in-depth profiles of the greatest QBs in history. This year, I’m combining those two themes in a look at the best wide receivers ever, broken into decades. Because careers don’t always fit cleanly into a single decade, I’ve gone in five-year increments. Last week, we introduced this series with a look at the first decade of the Modern Era, 1945-54. This is the second installment, covering 1950-59 and 1955-64. The great receivers of the early ’50s, such as Tom Fears and Pete Pihos, were in last week’s column.

Let’s begin with some specific categories and honors, then we’ll go in depth on the finest wide receivers of each decade. [continue reading…]

{ 18 comments }

A fun article at Five Thirty Eight last week noted how insanely top-heavy the NBA is this year. Just about everyone knows that the Warriors set the record for wins in a season with 73, as part of a wire-to-wire display of dominance. But the Spurs were nearly as good. In fact, based on Elo Ratings, San Antonio was the best second-best team in the league in league history. And the Oklahoma City Thunder? They’re currently (since Elo is constantly updating) the strongest 3rd-best team in NBA history. And LeBron James and the Cavs? They’re the toughest 4th-best team in NBA history, thanks in part to a scorched earth run through the Eastern Conference in the playoffs.

Which made me wonder: what NFL season was most comparable to the 2015-2016 NBA season? There are some good candidates out there:

  • In 2012, the Seahawks, 49ers, Patriots, and Broncos were far and away the best teams in the NFL. They were no flukes in this bunch: those four teams met in the conference championship games the next year, after another set of strong regular seasons.

[continue reading…]

{ 7 comments }

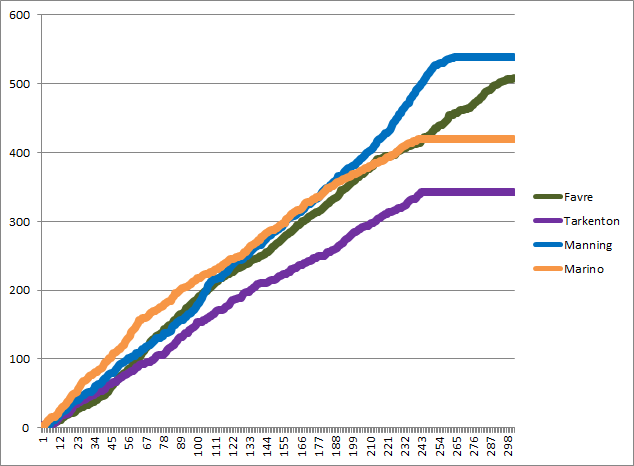
There have been four passing touchdown kings in the last 40 years: Fran Tarkenton, Dan Marino, Brett Favre, and Peyton Manning.  I thought it would be fun to plot the number of career touchdown passes each player had on the Y-Axis after each game of their career (shown on the X-Axis):

td pass leaders
[continue reading…]

{ 7 comments }

Tom Brady and Drew Brees ended the 2015 season in a pretty remarkable place: both have 428 touchdown passes, tied for the third most in NFL history.  Both threw their first touchdown pass in 2001, which makes it easy — and fun! — to compare the two players.  The graph below shows the number of career touchdown passes for each player over every week since 2001:

brady brees td

Brady took an early edge, both because he started earlier (he had 18 touchdowns in 2001; Brees had 1) and played better earlier (Brees had 28 touchdowns in ’02 and ’03 combined; Brady had that many just in ’03).  And, of course, Brady’s scorched-earth 2007 season helped see him take his biggest lead.  Consider that through 2007, Brees had thrown fewer than 30 touchdown passes in each of his first seven seasons. Since then? Brees has thrown more than 30 touchdowns in all eight seasons! [continue reading…]

{ 7 comments }

Over at TheGridFe, I just finished the single season portion of my series on the (statistically) greatest regular season quarterback performances in NFL history. I’ve discussed the stats, as they are, which always seem to paint modern quarterbacks in a much better light. I’ve prorated for season length, which can sometimes produce a few curious results. I’ve also applied both hard and soft inflation adjustments to account for the evolution of the position and increase in its usage rate. [1]I also presented TAY/P+ scores, but that’s not particularly relevant to this discussion. Check it out anyway, though. After talking with Adam Steele and agreeing that maybe even the most moderate approach still left seasons like Sid Luckman’s 1943 or Dan Fouts’s 1982 getting far more credit than they probably should. So I went ahead and made an even weaker era adjustment, which I will discuss briefly in this post, to try to mitigate the effects of the original modifications.

My main purpose for writing today isn’t to give you another list of great quarterback seasons, although I will do that as well. My goal is to solicit the opinions of the Football Perspective readers, whom I respect for their thoughtful and reasoned nature. I have two primary questions: [continue reading…]

References

References
1 I also presented TAY/P+ scores, but that’s not particularly relevant to this discussion. Check it out anyway, though.
{ 33 comments }

A Look at 2016 Vegas Futures Win Totals

Bovada has released futures wins totals for the 2016 season. Five teams are set at 10.5 wins, but not all teams with X numbers of wins are equal. For example, if you want to bet on the Packers going over 10.5 wins, you need to put down $165 to win $100, which translates to a 62.3% chance of success. If you want to bet against Green Bay, an Under bet of $100 brings back $135, implying a 42.6% chance. Those odds will always add up to over 100% because of the vig of about five percent. Remove that, and these lines have Green Bay pegged at about a 59% chance of going over 10.5 wins. Conversely, Pittsburgh is given a true 50/50 chance at going over 10.5 wins: you have to bet $115 to win $100 on the Steelers either going over or under 10.5 wins.

RkTeamWinsOverUnderOver %
1Green Bay Packers       10.5-16513559%
2New England Patriots 10.5-15012057%
2Seattle Seahawks10.5-15012057%
4Carolina Panthers10.5-130EVEN53%
5Pittsburgh Steelers      10.5-115-11550%
6Arizona Cardinals9.5-16013059%
7Cincinnati Bengals       9.5-14011055%
8Kansas City Chiefs        9.5-130EVEN53%
8Minnesota Vikings       9.5-130EVEN53%
10Dallas Cowboys    9.5EVEN-13047%
11Indianapolis Colts        9.5110-14045%
12Denver Broncos    9-115-11550%
13Houston Texans   8.5-13510554%
14Oakland Raiders   8.5-115-11550%
15Baltimore Ravens8.5110-14045%
16New York Giants  8-16013059%
17Buffalo Bills    8-115-11550%
18New York Jets8EVEN-13047%
19Jacksonville Jaguars    7.5-15012057%
20Chicago Bears 7.5-115-11550%
20Washington Redskins 7.5-115-11550%
22Atlanta Falcons     7.5120-15043%
22Los Angeles Rams7.5120-15043%
22Tampa Bay Buccaneers      7.5120-15043%
25Detroit Lions   7-130EVEN53%
26Miami Dolphins    7-115-11550%
27New Orleans Saints     7EVEN-13047%
27Philadelphia Eagles     7EVEN-13047%
29San Diego Chargers      7105-13546%
30Tennessee Titans5.5-16013059%
31San Francisco 49ers      5.5-115-11550%
32Cleveland Browns        4.5-130EVEN53%

[continue reading…]

{ 1 comment }

Guest Post: Bryan Frye on Existential Bridesmaids

Friend of the program Bryan Frye is back for another guest post. As regular readers know, Bryan operates his own fantastic site, http://www.thegridfe.com. You can view all of Bryan’s guest posts here, and follow him on twitter @LaverneusDingle.


As the sickle of death swings ever-closer to your head, and you sit and ponder the meaninglessness of it all, it can be easy to think of all those times you crawled and scratched but still failed to reach the mountaintop. Kurt Vonnegut once mused that many people desperately need to hear the message that they are not alone. I’m here to deliver that message. Here are a bunch of other losers who, like you, gave their all and were found wanting. [1]To be more specific, these are the highest ranking seasons in history, in various categories, that failed to top their own year.

Completed PassesDrew Brees, 2010

In 2010, Drew Brees completed 448 passes, which stands as the fifth highest mark in history. However, Peyton Manning set the all-time record that year, completing 450 passes. Don’t feel bad for Brees. He broke the record the following year and passed Manning’s total again in 2014. [continue reading…]

References

References
1 To be more specific, these are the highest ranking seasons in history, in various categories, that failed to top their own year.
{ 11 comments }

Brad Oremland is a longtime commenter and a fellow football historian. Brad is also a senior NFL writer at Sports Central. He’s also a semi-regular writer here, and you can view all of Brad’s Football Perspective writing at this page. Brad is working on a WR Project where he analyzes the best WRs over various ten year periods. That work is being produced over at Sports-Central, but Brad has offered to have it reproduced here as well. As always, we at the FP community thank him for his work.


Best WRs By Decade: 1945-54

Last year, I wrote an article breaking down the best quarterbacks by decade, followed by in-depth profiles of the greatest QBs in history. This year, I’m combining those two themes in a look at the best wide receivers ever, broken into decades. Because careers don’t always fit cleanly into a single decade, I’ve gone in five-year increments. This first piece covers 1945-54. Next week, we’ll do 1950-59 and 1955-64, continuing with 1960-69 and 1965-74 the following week, and so on.

Let’s begin with some specific categories and honors, then we’ll go in depth on the finest wide receivers of the era. 1945-54 represents the beginning of the NFL’s modern era. It was around this time that receivers stopped stopped doubling as defensive players, and started playing a major role on offense. In short, it was in the late 1940s and early 1950s that the modern position of wide receiver emerged. [continue reading…]

{ 10 comments }

The 2000 NFL Draft was supposed to bring an incredible infusion of wide receiver talent. Peter Warrick, Plaxico Burress, and Travis Taylor were top-10 picks, making it one of only four classes since 1970 were three wide receivers drafted in the top ten. In addition, Sylvester Morris, R. Jay Soward, Dennis Northcutt, and Todd Pinkston all went in the top 36 picks, one of only seven classes since the merger with seven wide receivers in the top 36. Avion Black was the 20th wide receiver taken with the 121st pick: add it all up, and the 2000 draft had unmatched levels of quality and quantity. The graph below shows the amount of draft value spent on wide receivers (you can click here for value spent on wide receivers and tight ends) in each draft from 1970 to 2011: [continue reading…]

{ 24 comments }

When an athletic but raw player is drafted, it’s common to hear that he will succeed if he can be “coached up” in the NFL. That idea relies on the assumption that there’s going to be enough individualized coaching in the NFL for that player to reach his potential. But I’m not really sure if that is true, especially when it comes to less highly-touted prospects.

This was an interesting article about offensive linemen in the NFL who believe that the time limits on practices under the CBA “have forced NFL coaches to spend most of their time installing the offense, rather than focusing on the tricks of the trade. That’s led to sloppy play.” And Ryan Riddle, a former sixth round pick who now writers at Bleacher Report, recently tweeted something similar, saying that NFL coaches focus on the macro level rather than individual technique. [continue reading…]

{ 15 comments }

Over the last couple of days, I’ve been looking at receiving yards by class year. I’ll continue that today, with a look at the best classes in wide receiver history.

The 2014 class looks to be a very special one. It set a rookie record by gaining 18,321 receiving yards in 2014, the most by any set of rookies in NFL history. Then last year, those same players gained 23,727 last year, the most by any class in any single season in history.

Of course, while impressive, we have to remember the pass-friendly environment we are experiencing. The Class of 2014 — which includes all players selected in the 2014 Draft and all undrafted players whose first season began in 2014 — gained 14% of all receiving yards two years ago, and then 18% of all receiving yards in the NFL in 2015. Thought of another way, the class of 2014 has averaged 16% of receiving yards in their first two seasons.

thru 2 years

The 1987 class was a bit inflated by the replacement players who all register as rookies. The only other class since the merger with at least 15% through two years was the 1974 class, which got strong rookie seasons from Charlie Wade, Nat Moore, Paul Seal, Joel Parker, Harrison Davis, and Roger Carr, and then had Lynn Swann, Ken Payne, Moore, Ray Rhodes, Carr, Charlie Smith, and John Stallworth play well in 1975.

The 18% number produced by the 2014 class in year 2 was the highest rate since by a sophomore class since 1958.  That year, second-year players Del Shofner led the NFL in receiving yards, while R.C. Owens and Tommy McDonald finished in the top ten, with Joe Walton, Jon Arnett, and Billy Ray Barnes rounding out the class.

We can also look at the best classes as rookies, and over 2-, 3-, 5-, 7-, and 10-year periods. Finally, the last column simply sums the percentage of receiving yards from each class in every year of their careers.

Year1First 2First 3First 5First 7First 10Total
195018.5%20.7%20.4%19.3%17.3%14.5%147.9%
195118.3%17.9%16.6%16%14.7%11.9%123.2%
195215.8%16.9%15.9%16.8%16.6%14.5%156.2%
195311.8%10.3%10.4%11.4%10.5%8.7%97.5%
195416.1%13.4%14.3%12.8%11.9%9.7%105.1%
195512.9%10.7%9.1%7.3%6%4.4%43.6%
195610.9%13.3%14.5%14.3%13.8%11.6%118.9%
195711.4%16.2%16.7%16.2%16%13.7%144.3%
195810.4%13.2%15.8%15.6%15.3%13.5%137.7%
19596.4%8.2%8.5%9%8.1%7.2%75.5%
19608.6%10%10.1%9.4%8.3%6.7%70.8%
19618.6%12.1%12.7%13.2%12.5%10%102.1%
19625.8%6.9%7.6%8.1%7.6%6.6%67.2%
196310.5%9.8%10.9%11.9%11.6%8.8%90.2%
196413.1%13.3%14.6%14.4%13.3%10.7%112.2%
19658.7%11.8%13.8%15%15.1%13.1%136.7%
19663.9%7%8.4%8.8%8.4%6.6%67%
19678.7%11%12%11.3%10.3%8.2%84.6%
19688.4%9.9%11%10.9%9.8%8.2%89.9%
196911%13.9%14.8%15.1%13.2%10.5%114.6%
197010.7%12.5%13.7%13.7%12.3%9.8%101.3%
197111.5%13.2%14%13.4%11.9%9.7%103.4%
19727.9%10.1%10.7%10.9%9.9%8.1%85%
197310.9%13.9%14.1%13.2%11.2%8.8%90.6%
197413.7%15.2%16.7%17.1%15.7%12.3%129.8%
197511.5%12.3%12.7%12%10.5%8.6%89.4%
197612.7%14.1%15.2%15.6%14.5%12%124.6%
19779.3%11.8%12%12%10.9%9%94.1%
197810.8%12.1%11.8%11.8%11%9.4%100.2%
197910.7%13.8%15%15.9%14.5%11.9%127%
19809.6%9.9%10.8%11.4%9.9%7.7%81.5%
19818.4%9.8%10.8%11%9.8%7.9%80.4%
19828.1%10.4%10.8%10.9%9.8%8%85.6%
198311.7%13.4%14.4%14.2%13.4%11.4%120.3%
19849.8%11.7%11.3%11.6%10.7%8.8%97.4%
19859.6%13%13.3%13.5%13.1%11.6%130%
198612.1%12.7%12.5%12.7%12%10.3%106.4%
198716.5%16.2%15.9%14.4%12.4%9.7%103.2%
198811.1%12.4%12.8%13.9%13.5%11.6%123.4%
198910.9%11%10.7%10.3%9.5%8.3%87.4%
19909%11.1%12.2%12.7%11.6%10.1%110.3%
19917.2%10.4%11.3%12.9%12.8%11.4%123.5%
19925.5%6.6%7.6%7.8%7.6%6.2%66.1%
199310.3%10.5%11.2%10.9%10.3%8.6%90.3%
19948.4%10.4%11.5%11.3%10.8%9.2%98.6%
199510.8%12.3%12.8%12.3%11.5%9.4%100.3%
199610.6%11.4%12.4%13.3%12.9%12%137.1%
19976.5%8.4%9.4%9.8%9.1%7.8%88.8%
19989.5%11.6%11.8%11.2%9.9%8%86.3%
19998%9.5%10.1%10.6%9.6%8.2%87.5%
20009.2%10.3%11%10.5%9.4%7.4%75%
200110.3%12.3%13.7%13.9%12.9%10.9%118.3%
200211%11.6%12.7%12.7%11.5%9.1%91%
200310%11.5%11.9%12%11.5%9.8%107.2%
20049.5%11%12.5%12.4%11.1%8.8%92.2%
20058.6%9.3%9.9%9.6%8.8%7.3%74.9%
200610.2%11.7%12.3%12.1%11.5%9.7%97.4%
20079.3%11.1%12.4%12.2%11%86.6%
200810.2%12.3%12.8%12.6%11.5%85.4%
200911.3%13.7%13.5%12.4%10.9%76%
201012.1%13.7%14.2%13.7%77.4%
201111.7%12.6%13.1%12%60.1%
201211.8%13.4%12.9%48.7%
201313.4%14.3%14%42%
201414.2%16%32.1%
201512.6%12.6%

The 1996 class, with Marvin Harrison, Terrell Owens, Keyshawn Johnson, Muhsin Muhammad, Joe Horn, Eric Moulds, Amani Toomer, et. al., is often considered one of the best classes ever. That’s not quite so clear early on — a number of classes have them beat through 7 years — but the longevity is incredible.  Take a look at this graph, which just shows the total percentages; that’s obviously going to be biased against active classes, but it’s a fun graph to look at anyway:

overall wr perc

As always, please leave your thoughts in the comments.

{ 1 comment }

A quick data dump today following up on yesterday’s post. The table below shows the percentage of receiving yards gained by 1st-year, 2nd-year, 3rd-year…. and 11th-year and more senior NFL players, in each year since 1950 (excluding 1987). [continue reading…]

{ 2 comments }

For a variety of reasons, I was curious to know what percentage of receiving yards was gained by each class of players. As it turns out, second-year players gain the most receiving yards of any class. Year two players have the advantage of added experience over rookies, and also are less likely to be out of the league even if they aren’t very good, relative to older players. Even bad players usually make it to the field in year two.

One reason to study this data is to analyze receiver production versus draft class. Because of passing inflation, you can’t simply compare the receiving yards gained by the 1973 class to the receiving yards gained by the 2003 class. But what you *could* do is measure the percentage of yards gained by each class, which should control for era. For example, the famed 2014 rookie class (with Odell Beckham, Sammy Watkins, Mike Evans, Allen Robinson, et al.) was responsible for 13% of NFL receiving yards in 2014 and then 19% of receiving yards last year. Those numbers are both really, really good. [continue reading…]

{ 4 comments }

Last offseason, Adam Steele helped administer a Wisdom of Crowds experiment on running backs and quarterbacks. Today, an update from Adam, along with some news. Below are Adam’s words:


Thanks to the opportunities Chase has given me at FP to publish my research and writing, I’ve decided to branch off and start my own website, quarterbacks.com. Ultimately, my mission for this site is to build the most complete database of NFL quarterbacks on the internet, a resource for statistics, history, opinion pieces, and FP-esque engagement among the readership. However, I can’t do this alone, so consider this an open invitation to the FP faithful to collaborate with me for this admittedly ambitious project. I welcome all types of submissions, including custom stats you’d like to publish and op-eds about anything related to NFL quarterbacks. If you think a certain QB is overrated or underrated and want to make a case for him, send it to me! At this juncture, the site is still under construction, and it will be a month or two before anything is published, so consider this the foundation building stage. For any aspiring writers out there, I’d like to help give you the same opportunity Chase gave me. Please email all inquiries and submissions to quarterbacks1031@gmail.com.


Wisdom of the Crowds: Ideas

Last offseason, Football Perspective ran crowdsourcing experiments to determine the greatest quarterbacks and running backs of all time. Given the amount of interest the community showed in WotC, I will be running more crowdsourcing projects this offseason! Before any votes are cast, I want your feedback on what you’d like to see in this year’s iterations. I definitely want to run a WotC for wide receivers (didn’t happen last year) and quarterbacks again (draws by far the most interest), but I’m certainly open to doing more if the readership desires. What other positions or units would you like to see crowdsourced?

Last year there were three main problems that I’d like to address and fix before the next go-around:

1) Lack of precision from ordinal rankings. An ordered list may be the simplest method to evaluate players, but it’s not the most accurate. Ordinal rankings don’t allow the voter to show the magnitude of difference between players. For example, if you think two players are head and shoulders ahead of the pack, that won’t be reflected in the linear gap between #2 and #3. My proposed solution is to switch from rankings to ratings, most likely on a 1-10 scale.

2) Difficulty comparing players across eras. It’s hard to compare a modern player with someone from the 50’s, and a number of participants last year voiced their struggle in dealing with this. I think the best solution is to separate players into groups based on their era, then rate all the players from each era together. This would help voters put players in proper context, knowing that we’re evaluating them only in relation to their direct peers. I would then take the winner from each era and put him in a pool for the overall GOAT title, which would involve a re-vote.

3) Voters accidentally leaving players off their ballot. Even for a football historian, it’s a daunting task to pick out X number of players from everyone in history who’s ever played the position. With an open ballot, it’s easy to forget a few players by accident, which several participants lamented in last year’s edition. This year, I’d strongly prefer to use a ballot with a predetermined pool of players for each participant to rate. I’m thinking maybe 15-20 players per era depending on the position. This solves the issue of forgetting players, forces voters to think about players they might not otherwise have, and provides statistical symmetry since every player will receive the same number of ratings.

Now I’ll open the forum to the FP readership. What do you think of my proposed changes? For those of you who participated last year, what did you like and dislike about it? I welcome any suggestions to make Wisdom of the Crowds a better experience for all!

Oh, and one note from Chase: does anyone have any recommendations on how to automate this process? That would obviously save us lots of time on the back end.

{ 23 comments }

2017 Super Bowl Odds

With free agency and the NFL Draft behind us, it’s a good time to take stock of the NFL landscape. Over at ESPN, Bill Barnwell is recapping each division, starting today with the AFC East. I thought I’d post the latest Super Bowl odds, courtesy of Bovada, along with the odds from the end of season (February 8th) and after the first rush of free agency (March 14th).

All odds have a vig associated with them; for example, the Patriots, at 7/1, would have a 12.5% chance (1 divided by 7 + 1) to win the Super Bowl if there was no vig; but if you take the odds of all 32 teams, they sum to 124.8%, not 100%. As a result, every team’s implied odds are divided by 1.248 to get their vig-adjusted Super Bowl odds, shown in the last column. [continue reading…]

{ 20 comments }

It’s easy to think that as the NFL becomes more of a passing league — a statement that’s undeniably true — that the best teams would be passing most frequently. But that just isn’t the case. The three best teams in Adjusted Net Yards per Attempt last year were Arizona, Cincinnati, and Seattle; those three teams ranked 19th, 26th, and 28th, respectively, in pass attempts. The Saints and Patriots did rank in the top five in both pass attempts and pass efficiency, but that just balances things out; it doesn’t mean the best passing teams are the most pass-happy teams.

There’s a pretty easy way to track this throughout history. The common way to calculate league-average Adjusted Net Yards per Attempt is to measure the league totals of its components: figure out how many league-wide passing yards, touchdowns, interceptions, sacks, and sack yards lost there were in any given season, and run through the calculation.

Another way, though, is to measure each team’s ANY/A average, and take an average of those averages. This approach gives each team the same weight when calculating league-average ANY/A; as a result, if this approach leads to a higher average than the traditional approach, that means the best passing teams are passing less frequently. And if the traditional approach has a higher average, that means the better passing teams are passing more often, because giving those teams extra weight (because of more pass attempts) is leading to a higher average. [continue reading…]

{ 10 comments }

In the 2016 Draft, the Jets selected Christian Hackenberg with the 51st pick. It was a curious move, given Hackenberg’s underwhelming college career; the book on him, though, is that he needs some time to be “rehabilitated” as a quarterback, whatever that means. [1]This anecdote about him making easy conversation about the Masters doesn’t exactly settle my fears about his inability to read defenses or throw accurately under pressure.

But how much time will he get? On average, how many games until a 2nd round quarterback starts his first game? There were no quarterbacks drafted in the second round in 2015, while in 2014, Derek Carr and Jimmy Garoppolo were selected. Carr started his first game as a rookie, while Garoppolo will get his first start in the 33rd team game of his career, thanks only to a Tom Brady suspension.

In 2013, only one quarterback was drafted in the 2nd round…. and it was Geno Smith. The Jets didn’t exactly hand Smith the job, but he won a quarterback competition with Mark Sanchez by default when Sanchez suffered a season-ending shoulder injury in the fourth quarter of the team’s third preseason game against the Giants.

The Jets don’t plan on starting Hackenberg in 2016, but they didn’t plan on starting Geno Smith as a rookie, and they didn’t plan on starting Ryan Fitzpatrick last year, either, until Smith was on the receiving end of a, um, training camp injury. Smith or Fitzpatrick is the likely week 1 starter for the 2016 Jets, and even Bryce Petty probably has better odds than Hackenberg of starting the opener. But with New York, strange things tend to happen.

The table below shows how many team games it took until a player started. For non-16 game seasons, I pro-rated them for 16 seasons, to make that applicable to modern times. So, for example, a 53 (like next to Ken Stabler) means a player started in the 5th game of his 4th year (i.e., after 48 games had passed), regardless of the actual facts. [continue reading…]

References

References
1 This anecdote about him making easy conversation about the Masters doesn’t exactly settle my fears about his inability to read defenses or throw accurately under pressure.
{ 3 comments }

You remember the 1987 Draft, right? It was a terrible draft for pass catchers.  The first TE drafted was Robert Awalt in the third round; only two more, Ron Hall and Jim Riggs, went before the sixth round, and Ron Embree was the final TE selected before the seventh round. At wide receiver, Haywood Jeffires was the first off the board at #20; the only other first rounders were Ricky Nattiel and Mark Ingram. The only other receiver in the top 50 was Lonzel Hill.  Mark Carrier, Kelvin Martin,Curtis Duncan, and Bruce Hill went in the later rounds,  but it was a terrible draft for pass catchers.

Using the Draft Value Chart, there were 177.4 points of draft value used on wide receivers and tight ends in the 1987 Draft.  That was the second year in a row when the league moved away from pass catchers.  Well, in this past draft, less draft capital was spent on wide receivers and tight ends than on any year since 1987. Take a look: [continue reading…]

{ 1 comment }

Yesterday, I looked at the number of players drafted at each position in the 2016 Draft, the draft capital spent at each position, and also the draft capital spent at each position on a per-snap basis.

Those numbers are fun, but are more meaningful with some context. So let’s look at the chart I find most useful — the per-snap data — and compare it to the drafts from 2013 to 2015. In the chart below, you can see that in the 2016 Draft (in green), there was 118 points of draft value spent on QBs (of course, only 1 QB per snap), compared to an average of 78 from 2013-2015 (in orange). This means the 2016 Draft was heavy on quarterbacks, which makes sense: after all, Jared Goff and Carson Wentz were the first two picks, and Paxton Lynch also went in the first round. In the three prior years, there was an average of just one QB in the top 3 (Blake Bortles, Jameis Winston, Marcus Mariota) and one later in the first round (EJ Manuel, Johnny Manziel, Teddy Bridgewater). [continue reading…]

{ 2 comments }

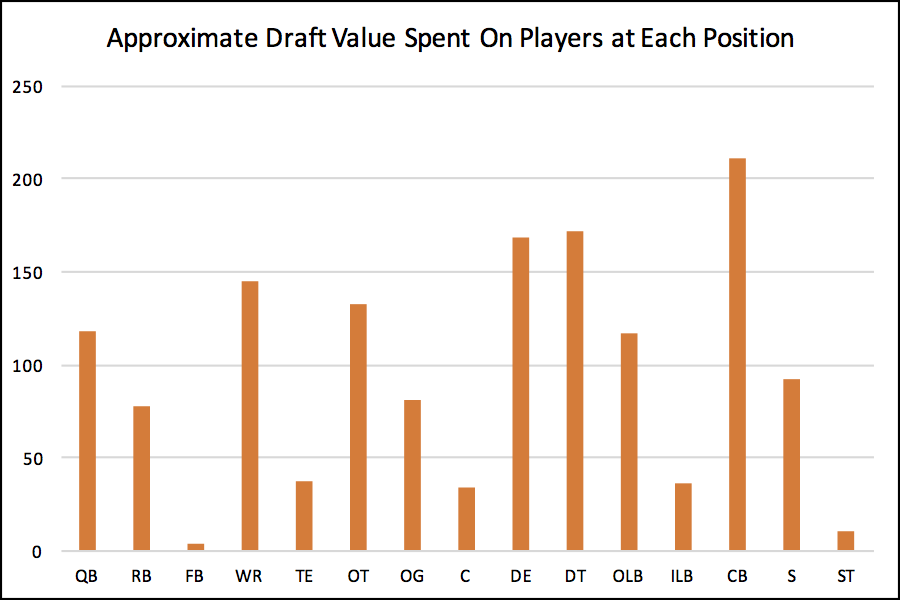
In the 2016 NFL Draft, 32 cornerbacks and 31 wide receivers were selected, making those the two most commonly-drafted positions this year. That’s not too surprising, of course, as cornerbacks and wide receivers litter the field on Sundays. But the graph below shows the number of plays drafted at each position:

players position 2016 draft

A little more interesting would be the Draft Value used on each player: after all, spending a high pick on a player means a lot more than spending a low pick on one. Here, we see that cornerback stands out: teams are more likely to use high picks on cornerbacks and late-round picks on wide receivers, at least in 2016:

value position 2016 draft [continue reading…]

{ 21 comments }

Today at 538, you can read my thoughts on Ohio State’s insane 2016 draft.  It is, by a large measure, the best in modern history.  And while some have noted that the Buckeyes dominated the draft, I don’t think people have realized exactly how impressive it truly was:

Incredibly, Ohio State had five players drafted in the top 20 and another five in the top 100. As a result, a total of 151.2 points of draft value was used on Buckeyes players. That’s the most — by a very large margin — in 70 years. The table below shows the top 25 draft classes as measured by points of draft value used to select players:

You can read the full article here.

{ 13 comments }

Longtime commenter Jason Winter has chimed in with today’s guest post. Jason is a part-time video game journalist and full-time sports fan. You can read more of him at his blog: https://jasonwinter.wordpress.com/, and follow him on twitter at @winterinformal.

As always, we thank Jason for contributing.


The 2016 NFL Draft is over, and that means just one thing: It’s time to start talking about the 2017 NFL Draft! Or at least, it’s time to start publishing 2017 mock drafts, for all those sweet, sweet clicks.

A lot can happen in a year, of course. Draft status can go up or down based on a number of factors, from a player’s performance during his final college season to injuries to combine performance to… well, whatever happened to Laremy Tunsil. The draft order – whether set by a team’s record or trades – also plays a significant part. Is it really possible to accurately predict how the draft will go a year in advance? Or is it just a cheap ploy to get people to look at your website?

In the two weeks following last year’s draft, I copied first-round mock drafts from 10 different sources around the web, to see how they would stack up with the real results a year later. Sample size warnings are obvious; this is just one year, just 10 people’s mock drafts, and maybe the draft class was especially predictable or unpredictable. Still, it was a fun project, and I plan to do the same thing with mock drafts this year and see how they stack up in 2017.

All the mock drafts from a year ago were published before Deflategate penalties were handed out, so they have 32 picks, including one from New England. As such, for this article, when I refer to “first round,” I’ll be including the first 32 picks of the 2016 draft, including Emmanuel Ogbah, selected by Cleveland with the first pick of the second round.

I applied two different scoring systems to each mock draft. The first, which I call the “Strict” method, better rewards exact or very close hits: 10 points for getting a pick’s position exactly right; 8 points for being 1 pick off; 6 for being 2 off; 4 for being 3-4 off; 3 for being 5-8 off; 2 for being 9-16 off; and 1 for being 17-32 off. [continue reading…]

{ 6 comments }

At 538 on Friday, I looked at the trades in round 1 of the NFL Draft. Today, let’s look at the trades that happened on Day 2.

1)

Jacksonville receives: second-round pick (No. 36 overall) (UCLA LB Myles Jack)
Baltimore receives: second-round pick (No. 38 overall) (Traded to Miami), fifth-round pick (No. 146 overall) (Grand Valley St. DE Matt Judon)

Football Perspective Draft Value Chart: Baltimore received 121 cents on the dollar
Jimmy Johnson Draft Value Chart: Baltimore received 102 cents on the dollar

Jack was an outstanding college player who many thought would go in the top five of the first round if he had a clean bill of health.  Unfortunately, that’s not the case, and Jack’s injured right knee caused him to slide to the second day of the draft. It’s tempting to call this a steal for Jacksonville, but remember that many teams that could use a player like Jack — including Baltimore — felt he wasn’t worth the risk.  The Jaguars paid a decent price to get him, but this trade will be a home run for the Jaguars if Jack stays healthy. As for Baltimore, the team traded down just two picks later, and did even better….

2)

Miami receives: second-round pick (No. 38 overall) (Baylor CB Xavien Howard)
Baltimore receives: second-round pick (No. 42 overall) (Boise St. DE Kamalei Correa), fourth-round pick (No. 107 overall) (Cincinnati WR Chris Moore)

Football Perspective Draft Value Chart: Baltimore received 137 cents on the dollar
Jimmy Johnson Draft Value Chart: Baltimore received 108 cents on the dollar

The Ravens wound up dropping from 36 to 42 and collected a fourth and a fifth to drop six slots; that’s a great haul, as it landed the team three players rather than one. The Dolphins gave up a lot to move up four slots, which is emblematic of an organization that puts little emphasis on depth relative to star power. [continue reading…]

{ 2 comments }