≡ Menu

Single-Season Passing Records in Jeopardy

With one game remaining, the NFL is having yet another record-breaking season through the air. Teams are averaging over 259 gross passing yards per game, which would break the record of 252, set last year. Teams are completing 63.1% of passes this year, which would break the record of 62.6%, also set in 2014. And teams are averaging 1.7 passing touchdowns per game, the first time in NFL history (it was 1.6 each of the last two years, and also in 1965).

As a result, a number of single-season franchise records are in jeopardy of falling this year, too, depending on what happens today. Let’s go through the list. [continue reading…]

{ 19 comments }

Teddy Bridgewater and Quarterback Help

No offense has had it easier this year than the Denver Broncos. What do I mean by that? Denver ranks 4th in points allowed, at 276, but that’s a little misleading. The Broncos have thrown three pick sixes, all from Peyton Manning, and those have put 20 points on the scoreboard (one pick six was followed by a failed two-point attempt). In addition, Denver’s defense/special teams has scored six touchdowns. Those obviously go in the “Points Scored” column for Denver, but in terms of the offense, they didn’t earn those points. So instead, let’s subtract all non-offensive touchdowns scored by the Broncos by the points allowed by Denver. Do that, and the Broncos defense has allowed 214 net points, after excluding pick sixes and crediting the defense for non-offensive touchdowns.

That’s the fewest in the NFL. Last offseason, I wrote an article about Andrew Luck and quarterback help.  It was pretty basic, but I found it interesting enough to recreate today.  Here is the methodology: [continue reading…]

{ 13 comments }

New York Times Checkdowns: Blake Bortles, TDs, and INTs

This week at the New York Times, a look at the surprisingly good — and unusual — season of Jaguars second-year quarterback Blake Bortles.

Curiously, Bortles also ranks second in the N.F.L. in interceptions this season, with 16, and is one behind the injured Manning for the league lead. Since 1970, only three quarterbacks have led the N.F.L. in both touchdown passes and interceptions: Drew Brees in 2012, Lynn Dickey in 1983 and Brian Sipe in 1979. Bortles has a decent chance of joining that list, but even finishing in the top three in both categories is unusual.

You can read the full article here.


{ 4 comments }

Pre-Week 17 WP: Awards Banquet

This week at the Washington Post, I hand out my 2015 awards, including my thoughts on the Carson Palmer/Cam Newton debate.

Most Valuable Player: Tie (Cam NewtonCarson Palmer)

Choosing between Newton and Palmer is an exercise in pickin’ nits. The two have drastically different styles and playing in very different offenses, making it difficult to compare the two players. Arizona would be worse with Cam Newton, and Carolina would be worse with Carson Palmer, so both teams should be happy that they have the co-most valuable players of the 2015 season.

You can read the full article here.

As always, please leave your thoughts in the comments. One point to open up the discussion. Is declaring the MVP vote a tie akin to fence-sitting and worthy of criticism? Or does it make sense to acknowledge that football is a far too complicated game to try to derive meaningful bits of information out of minute differences?

{ 5 comments }

Nobody wants to watch this Saints defense with their eyes open

Nobody wants to watch this Saints defense with their eyes open

In short, maybe.

New Orleans has allowed 4,217 passing yards this year (which includes yards lost by the opposing team on sacks) on 538 dropbacks, which is already pretty bad.  That translates to a 7.84 Net Yards per Attempt allowed average, which is the worst in the NFL by half a yard per attempt.  But where things get really bad is in touchdowns and interceptions.  New Orleans has allowed an unbelievable 43 passing touchdowns through 15 games, the most in NFL history. In addition, the Saints have intercepted just 8 passes, tied for third fewest in the league this year.

That translates to an 8.77 Adjusted Net Yards per Attempt average, after giving 20 yards for each touchdown pass and subtracting 45 yards for each interception.  That is, by a decent measure, the worst rate in NFL history.  The current record belongs to the 0-16 Detroit Lions, who allowed 8.53 ANY/A.  Only three other teams — the ’81 Colts, the ’69 Saints, and the ’63 Broncos — have even allowed 8.00 ANY/A over a full season. [continue reading…]

{ 4 comments }

Chip Kelly, Fired After 3 Years and a 26-21 Record

Not NFL coaches

Good college coaches

The Eagles dropped a news bomb on Tuesday night, firing Chip Kelly after just three seasons.  Kelly went 10-6 in each of his first two seasons in Philadelphia, and he used that success to gain even more power in the front office.  Many of Kelly’s roster decisions this offseason backfired — adding DeMarco Murray, Ryan Matthews, and Sam Bradford, while letting Jeremy Maclin go unreplaced — and they look even worse now than they did at the time.  In a rare moment of prescient thought, here is how I ended a May article on how unusual the Eagles offensive turnover was:

But with all these aggressive and unusual changes to a very productive offense, Kelly has opened himself up to a lot of criticism if things don’t run smoothly in Philadelphia in 2015.

After a 6-9 season, it’s fair to say things didn’t run smoothly.  But how unusual is it to fire a head coach who has posted a winning record after just three years? Pretty unusual.

Kelly will be the 10th head coach since 1950 to be with a team for 3 seasons, produce a winning record, and not come back for year four.  Let’s look at the first 9, from best winning percentage to worst: [continue reading…]

{ 12 comments }

Week 16 Game Scripts: Denver Flips The Game Script

In week 14, no team lost with a better Game Script than Denver. The Broncos dominated the Raiders in the first half, although the team only took a 12-0 lead into the locker room. Oakland came back to win, 15-12, despite Denver posting a +3.5 Game Script.

In week 15, no team lost with a better Game Script than Denver. The Broncos held a 27-10 lead over the Steelers in the 2nd quarter, but wound up losing, 34-27, despite a Game Script of +5.0.

In week 16, no team won with a worse Game Script than Denver. The Bengals dominated the game early, jumping out to a 14-0 lead that looked even more impressive than on the scoreboard. But Denver battled back, and won, 20-17, in overtime, despite a Game Script of -5.2.

And yet, despite three straight weeks of crazy comebacks, it was five weeks ago that produced the oddest game of Denver’s season: against New England, the Broncos won with a Game Script of -7.1.

There have been just 18 games this season where the winning team posted a Game Script of -3.5 or worse, and Denver has been involved in four of those games.

Below are the Game Scripts data from week 16. As always, you can view the full season results here. [continue reading…]

{ 1 comment }

New York Times, Post Week-16 (2015): Cardinals Dominant Run

This week at the New York Times: the Arizona Cardinals are really, really good.

The Carolina Panthers have been the story of the N.F.L. this season, easily surpassing preseason expectations on the way to a 14-0 record. But after Carolina’s loss at Atlanta on Sunday, the Panthers are not going to become the first N.F.L. team to finish a season 19-0. Even so, that does not mean there is not a historically dominant team this season: It just happens to be a different N.F.C. team.

The Arizona Cardinals lead the league in scoring, with an impressive 32.2 points per game average. The team ranks fourth in points allowed, at 18.5, and, if things break Arizona’s way in Week 17, it could wind up leading the league in that metric, too. More impressive, Arizona has outscored its opponents by 206 points, or 13.7 points a game. That is the third highest margin of any team in the last 10 years, behind only the Patriots teams in 2007 and 2012. From 1970 to 2014, only 17 teams have outscored their opponents by such a margin; eight of them wound up winning the Super Bowl.

You can read the full article here.

{ 1 comment }

The graph below shows Washington’s winning percentage after each game this season:

wash winp

The season began with a home loss to Miami, the start of a loss-win-loss-win-loss pattern that defined the team’s first five games. The sixth game was a loss to the Jets, followed by a win-loss-win-loss-win-loss pattern that brought the team’s record to 5-7. Finally, after three straight wins, Washington now has a winning record at 8-7. In the process, the team clinched the disappointing NFC East: that’s because the Eagles and Cowboys will finish with losing records, while the Giants would lose a tiebreaker (based on NFC record) to Washington at 8-8.

The last time Washington made the playoffs, it was with a quarterback drafted in 2012 and following a slow start, too: that year, the team began 3-6 but finished 10-6. There are more than a few similarities between those two teams, particularly at quarterback. Over his last 9 games, Kirk Cousins has completed 72% of his passes for 2,570 yards (8.57 Y/A), with 20 TDs and 3 INTs, while also rushing for four touchdowns. In RG3’s last 10 games of his rookie season, he threw for 2,039 yards (8.0 Y/A) with 16 TDs and 4 INTs, while also rushing for 574 yards with three scores. [continue reading…]

{ 0 comments }

Antonio Brown has 1,586 receiving yards, most in the NFL, which puts him on pace for 1,813 receiving yards this season.

Adrian Peterson has 1,314 rushing yards, most in the NFL, which puts him on pace for 1,502 rushing yards in 2015.

That’s pretty weird.  In general, the rushing leader usually gains more rushing yards than the receiving yardage leader picks up through the air.  From 1970 to 2014, the receiving yards leader  “outgained” the rushing yards leader in only 10 of 45 seasons.  And in only three of those years did the receiving leader “win” by more than 100 yards: in 1999 (Marvin Harrison had 1663 receiving yards; his teammate Edgerrin James had 1553 rushing yards), 1990 (Jerry Rice over Barry Sanders, 1502 to 1304), and 1982 (Wes Chandler over Freeman McNeil in the strike-shortened season, 1032to 786). On a per-game basis, it’s tough to beat what Chandler did, but Brown is on pace to become the first receiving leader since the merger (in fact, the first in the NFL since 1952) to “outgain” the rushing leader by over 300 yards. [continue reading…]

{ 7 comments }

Merry Christmas (2015)!

Just a quick note from me today.  Hopefully each and every one of you has a chance to sit back, relax, and enjoy a much-needed day off.  I know I have a lot of reasons to be thankful and happy, and that includes the very loyal community here.  From the Football Perspective family to yours, here’s wishing you a Merry Christmas!

Oh, and if you want some Christmas-related football nuggets, there’s always this post!

{ 0 comments }


This week at the New York Times, a look at 2015 Pro Bowlers and team winning percentage:

Perhaps more surprising is that at offensive tackle the players’ teams have an average winning percentage of 0.417; the only position with a worse average winning percentage was at punter. Part of this is because offensive tackles cannot make an offense: An elite left tackle is not going to help a team win games if the quarterback or receivers are below average. In some ways, a top-notch offensive lineman is only as valuable as the players he is protecting.

Another reason, though, is that offensive tackles are routinely selected year after year based on reputation: The six offensive tackles selected to the Pro Bowl were the Cleveland Browns’ Joe Thomas (nine Pro Bowls), the Philadelphia Eagles’ Jason Peters (eight), the San Francisco 49ers’ Joe Staley (who made his fifth straight Pro Bowl), the Washington Redskins’ Trent Williams (fourth straight Pro Bowl), the Dallas Cowboys’ Tyron Smith (third straight Pro Bowl) and the Cincinnati Bengals’ Andrew Whitworth (second career Pro Bowl, but a second-team All-Pro selection in 2014). The 49ers, Eagles and Cowboys are having down years, but that did not stop Staley, Peters, or Smith from receiving their customary Pro Bowl nod. As for Thomas? He has made the Pro Bowl in each of his nine seasons in the league, but the Browns have never made the playoffs during his career.

You can read the full article here.

{ 1 comment }

Week 15 Game Scripts: Carolina Goes Pass-Heavy

Let’s get to the Week 15 Game Scripts data! As always, you can view the full season data here.

TeamH/ROppBoxscorePFPAMarginGame ScriptPassRunP/R RatioOp_POp_ROpp_P/R Ratio
WASBUFBoxscore35251013.7292751.8%323150.8%
STLTAMBoxscore3123813.2193336.5%502665.8%
NWETENBoxscore33161713372658.7%392066.1%
SDGMIABoxscore30141612.6373650.7%371966.1%
DET@NORBoxscore3527812.4282354.9%531874.6%
KAN@BALBoxscore34142010.2282850%471971.2%
CIN@SFOBoxscore24141010.1253641%541776.1%
MINCHIBoxscore38172110.1213537.5%422067.7%
ARI@PHIBoxscore4017239.9353947.3%432068.3%
CAR@NYGBoxscore383538.8482863.2%462763%
SEACLEBoxscore3013176.3323547.8%351767.3%
GNB@OAKBoxscore3020105.8412859.4%502566.7%
ATL@JAXBoxscore231764.9363352.2%402066.7%
NYJ@DALBoxscore191630412661.2%352162.5%
HOU@INDBoxscore16106-3.3313745.6%351964.8%
PITDENBoxscore34277-5581777.3%462465.7%

Let’s break teams down into two categories: [continue reading…]

{ 1 comment }

New York Times, Post Week-15 (2015): Antonio Brown

This week at the New York Times, a look at Pittsburgh’s wide receiver extraordinaire, Antonio Brown:

Third down, 5 yards to go.

The Steelers led the Denver Broncos by 7 points with 1 minute 30 seconds remaining and the ball at the Pittsburgh 46-yard line.

Denver had just used its final timeout. Most teams, in this situation, would run the ball. That’s because a conservative run, followed by a punt, would most likely give the Broncos the ball inside their 20-yard line with about 40 seconds remaining.

But unlike all other teams, the Steelers have Antonio Brown. Pittsburgh called for a pass and Ben Roethlisberger found Brown for an 8-yard gain, allowing the Steelers to kneel out the clock. It was the final reception in another marvelous game for Brown, who caught 16 of the 18 passes thrown his way for 189 yards and two touchdowns. When a receiver can convert 89 percent of his targets into catches while averaging 11.8 yards per catch, conventional coaching methods go out the window. Put simply, a pass to Brown is one of the surest plays in football.

You can read the full article here.

{ 1 comment }

In 2014, the Denver Broncos ranked 4th in Adjusted Net Yards per Attempt; in case you forgot, Peyton Manning‘s “struggles” last year were really confined to the back end of the season. This year, the Broncos rank 31st in ANY/A, as Manning has been terrible and Brock Osweiler has been far below average. The Broncos ANY/A has dropped from 7.67 to 4.90, a decline of 2.77 ANY/A.

But that’s not even the biggest decline of 2015. Last year, the Dallas Cowboys ranked 2nd in ANY/A at 7.96; this year, without Tony Romo, the team is dead last at 4.76, for a decline of 3.20 ANY/A. Here is the full list of how passing offenses have improved/declined from 2014, which also shows why Carson Palmer is a pretty good choice for MVP: [continue reading…]

{ 7 comments }

Marshall and Decker, following one of many touchdowns

Marshall and Decker, following one of many touchdowns

Brandon Marshall and Eric Decker have quickly become one of the best wide receiver duos in the NFL. In their first game together this season, against the Browns, both scored a touchdown. The next week, the duo repeated that act against the Colts. A month later, both caught touchdowns against Washington. Then, Marshall and Decker each scored in back-to-back games against the Jaguars and Bills, and have since caught touchdowns against the Dolphins and Titans.

That’s seven games where both players have scored touchdowns in the same game.  They are just the second pair of receivers to pull off this feat. And with two games remaining, it’s still possible for them to tie the NFL record for any pair of teammates. Today, let’s look at all duos to score a touchdown in at least seven games.

Nine Games

In 1995, Emmitt Smith rushed for 25 touchdowns, while Michael Irvin caught 10 touchdowns. Of course, Smith set a record by scoring a touchdown in 15 regular season games, the only player to ever do that. Irvin’s 10 touchdowns came in 10 games, and while he did catch a touchdown in the lone game in which Smith was left out of the end zone, that still leaves 9 games where both players scored a touchdown. Incredibly, Smith then scored in all three playoff games, while Irvin caught touchdowns in the Cowboys wins over Philadelphia and Green Bay, giving the duo 11 games that season where both scored a touchdown. [continue reading…]

{ 1 comment }

A great article from Bill Barnwell this week, as he chronicled the rise of the improving Oakland Raiders.  At 6-7 and not playing in the NFC East or AFC South, the Raiders are not in the playoff hunt, but that’s not the only measure of a team’s success. Remember, Oakland started 0-10 last year.  Even that may be a bit of an understatement of where the team was, because the Raiders also lost their final six games of the 2013 season. [continue reading…]

{ 1 comment }

New York Times Checkdowns: Martin vs. Gurley Battle

A little late, but here is a link to my Thursday Night Football preview: 

http://www.nytimes.com/2015/12/18/sports/football/thursday-nfl-game-has-running-backs-to-savor.html

{ 0 comments }

Pre-Week 15 WP: Carolina’s 13-0 Record

This week at the Washington Post,  a look at the other nine teams to begin a season 13-0.

The Carolina Panthers are 13-0. The team leads the NFL in points scored, with 411, and in points differential, at 168. Carolina has won an incredible 17 consecutive regular season games, and boasts arguably the best pass defense in the NFL, the most productive running game, and maybe even the best quarterback. In short, if you want to make an interesting comparison between the Panthers and another team, you’re going to need a time machine.

There have been 10 teams to begin a season 13-0. And, at least among those teams, Carolina falls near the bottom of the pack. The Panthers’ plus-168 points differential ranks ninth in that group, ahead of only the 2009 Colts that won seven of its first 13 games by eight or fewer points (the Panthers have won six such games).

You can read the full article here.

{ 0 comments }

Checkdowns: Carson Palmer and MVP Voting

Since twitter limits me to 140 characters, and I’m having fun debating with guys like Bryan Frye (@LaverneusDingle) and Adam Hartstad (@AdamHarstad), I thought I’d crunch some numbers here.

Is Carson Palmer the best choice for MVP this year? Let’s put aside the Cam Newton argument and just focus on Palmer’s place in post-merger history.   As Adam pointed out, 2015 Carson Palmer is currently 7th on the list of Adjusted Net Yards per Attempt leaders, and the six players in front of him all won the AP MVP (that would be Peyton Manning 2004, Aaron Rodgers 2011, Dan Marino 1984, Tom Brady 2007, Manning 2013, and Rodgers 2014).

Of course, ANY/A is biased in favor of modern players, so let’s look at ANY/A+. Here, he doesn’t drop as far as you might think: Carson is still tied for the 11th best season since 1970, and a few non-AP MVPs sneak in there ahead of him (Mark Rypien 1991, Randall Cunningham 1998, and a quarterback who lost to another quarterback a having historic season: Montana ’84 and Ken Anderson 1981). [continue reading…]

{ 32 comments }

This week at the New York Times, a look at the dominant display by Russell Wilson over the last month:

The Seahawks have won four consecutive games, with the bulk of the credit going to Wilson. He has completed 89 of 118 passes (75 percent) for 1,171 yards (9.9 yards per attempt), with an incredible 16 touchdowns and zero interceptions. He has taken just five sacks in this time after struggling in that department for most of his career. He has averaged 11.93 adjusted net yards per attempt over his last four games, the best stretch of his career.

The graph below displays Wilson’s ANY/A average in each of his 69 career games, including playoffs. The blue dot represents each game, while the green line displays a rolling four-game average:

You can read the full article, and see the fun graph, here (or here).

{ 0 comments }

After ten weeks, I calculated the pass identities of every team in the NFL. At the time, I noted that it was weird how Denver was the 4th most pass-happy team in the NFL despite, you know, Peyton Manning playing like the worst quarterback in football and the Broncos owning the league’s top defense. Of course, there’s one problem: the Broncos rushing attack is pretty bad, too.

Since then, the Broncos have played three games. The first came against the Bears, who have a terrible rush defense. As a result, Ronnie Hillman and C.J. Anderson rushed 33 times for 161 yards, and the Broncos ran on over half of their plays. The next week, against the Patriots, things changed dramatically after Dont’a Hightower went down:

As masslive.com’s Kevin Duffy noted, the Broncos ran the ball 15 times for a total of just 43 yards with Hightower in the lineup. After Hightower left, Denver ran the ball 17 times for a whopping 136 yards, averaging an even 8 yards per carry. Three of Denver’s four touchdowns came on the ground, including a sweep that produced two long scores from short yardage on second-and-1 and third-and-1.

Denver trailed 21-7 at the start of the 4th quarter, but wound up winning the game, in large part thanks to the rushing attack. Of course, with #QBWinz being what they are, Brock Osweiler received a lot of credit for running his record to 3-0. Then, the Raiders game happened.

Denver dominated the Raiders in the first half, as Oakland gained negative 12 yards — that’s NEGATIVE TWELVE YARDS — in the first 30 minutes. But the Broncos only led 12-0, in part because of the team’s struggles on the ground. Hillman and Juwan Thompson finished the game with 17 carries for just 28 yards. Meanwhile, Osweiler recorded 56 pass attempts! In some ways, it is incomprehensible that a team could have a positive Game Script, a 12-0 half time lead, and yet put the ball in the hands of its first-year starting, below-average quarterback 39 more times than in the hands of all of your running backs combined. But when your running backs are averaging 1.6 yards per carry, there may not be much of an alternative.

Osweiler struggled, of course, finishing with 4.92 ANY/A on his 56 pass attempts, and also taking a safety, while Denver went just 4-18 on third downs. The Broncos passed a ton under Manning despite Manning struggling all season; now, with the running game ineffective, the same thing is happening under Osweiler (to be fair, there were a number of drops by the Broncos receivers, making this more of a passing game issue than a pure quarterback issue). The Broncos defense is awesome, but the team may not be able to get very far if the offense is throwing on 70%+ of its plays. Anderson missed the Raiders game with an ankle injury, and while he hasn’t been the star back he was at the end of last year, the Broncos offense sorely needs a healthy Anderson.

Below are the week 14 Game Scripts data:
[continue reading…]

{ 1 comment }

The 2007 Patriots set all sorts of records, and are as good as you remember.  In fact, that New England team was even great when compared among great teams.  Through 13 games, the Patriots outscored opponents by 281 points, by far the best differential among teams since 1970.  Carolina’s +168 points differential, while good enough to lead the league in 2015, looks downright unimpressive by comparison.

But what’s often forgotten about that New England team is that it slowed down considerably during the season, perhaps due to age (the Patriots were the third oldest team in the NFL that year, by AV).  In case you forgot:

  • The 2007 Patriots outscored opponents by 25.4 points per game in New England’s first 10 games.
  • In the team’s final six games, the Patriots outscored opponents by 10.2 points per game.
  • In three playoff games, New England outscored opponents by 5.7 points per game.

We think of the ’07 Patriots as a dominant team, and they of course were.  But they were also a team that ran out of gas as the season went along, culminating in the Super Bowl loss.  New England covered the point spread, often by large amounts, in nine of the team’s first ten games. Then, the Patriots covered the spread in just one of New England’s final nine games.   While the ’07 Patriots were one of the greatest teams in football history, it’s also true that their story was a tale of two halves: an absurdly dominant first half, and a less-than-overwhelming second half, that failed to meet expectations. [continue reading…]

{ 20 comments }

Back in week 3, Jimmy Clausen was the Bears starting quarterback when Chicago traveled to Seattle. The Bears offense was abysmal that day, with Chicago punting on all ten drives. Clausen has since been released, pick up by the Ravens, and now will start his second game of the season for Baltimore against… Seattle.

Clausen becomes the fifth quarterback to start against the same opponent twice in the same season, but with different teams. The first four? [continue reading…]

{ 1 comment }

Final 2015 College Football SRS Ratings/Bowl Preview

With the college football regular season now officially over, let’s look at the final SRS ratings from 2015:

RkTeamConfDivConf RkGMOVSOSSRSREC
1OklahomaB12B1211220.34262.311-1
2AlabamaSECSEC-West11317.842.960.712-1
3Ohio StateB10B10-East11218.839.157.911-1
4ClemsonACCACC-Atl11315.941.757.613-0
5Notre DameIndInd11211.843.25510-2
6Florida StACCACC-Atl21214.84054.810-2
7StanfordP12P12-North11312.941.754.711-2
8North CarolinaACCACC-Coas31315.738.454.111-2
9BaylorB12B1221216.337.854.19-3
10TCUB12B1231213.739.45310-2
11Michigan StB10B10-East21310.942.15312-1
12MississippiSECSEC-West21212.84052.89-3
13MichiganB10B10-East31211.940.352.29-3
14TennesseeSECSEC-East31210.740.551.28-4
15IowaB10B10-West41312.238.851.112-1
16Southern CalP12P12-South2136.843.750.58-5
17Oklahoma StB12B1241210.439.750.110-2
18LSUSECSEC-West4116.343.549.88-3
19West VirginiaB12B125127.641.549.17-5
20ArkansasSECSEC-West5126.242.8497-5
21Mississippi StSECSEC-West612939.948.88-4
22Bowling GreenMACMAC-East11314.134.748.810-3
23NavyAmerAmer-West11213.535.148.610-2
24HoustonAmerAmer-West21317.131.448.412-1
25WisconsinB10B10-West51211.636.648.29-3
26WashingtonP12P12-North3128.239.8486-6
27UtahP12P12-South4127.740.3489-3
28MemphisAmerAmer-West31212.735.147.89-3
29FloridaSECSEC-East7137.140.647.610-3
30OregonP12P12-North5126.740.647.39-3
31UCLAP12P12-South6126.540.446.98-4
32ToledoMACMAC-West21113.133.746.89-2
33PittsburghACCACC-Coas4124.342.546.78-4
34CaliforniaP12P12-North7125.141.546.67-5
35Texas A&MSECSEC-West8125.640.4468-4
36North Carolina StACCACC-Atl5128.237.545.77-5
37Western KentuckyCUSACUSA-East11316.32945.311-2
38LouisvilleACCACC-Atl612441.245.17-5
39GeorgiaSECSEC-East912837459-3
40NorthwesternB10B10-West6124.740.344.910-2
41TempleAmerAmer-East4131133.944.910-3
42Texas TechB12B126122.641.844.47-5
43Virginia TechACCACC-Coas7123.840.544.36-6
44South FloridaAmerAmer-East51210.334.144.38-4
45Brigham YoungIndInd21210.13444.19-3
46NebraskaB10B10-West7123.54043.55-7
47Penn StateB10B10-East812240.742.87-5
48Georgia TechACCACC-Coas812-0.142.842.83-9
49Miami FLACCACC-Coas9121.241.342.58-4
50AuburnSECSEC-West1012-0.842.7426-6
51Washington StP12P12-North8123.638.341.98-4
52Arizona StP12P12-South9120.840.941.76-6
53Boise StMWCMWC-Mntn11212.628.841.48-4
54Kansas StB12B127120.540.741.26-6
55DukeACCACC-Coas10124.436.540.97-5
56TexasB12B12812-4.144.540.45-7
57Western MichiganMACMAC-West3125.135.240.37-5
58San Diego StMWCMWC-West21312.327.339.710-3
59Appalachian StSunSun11215.224.339.510-2
60Georgia SouthernSunSun21210.42939.48-4
61Northern IllinoisMACMAC-West4136.932.339.28-5
62IndianaB10B10-East912-1.340.3396-6
63IllinoisB10B10-West1012-241395-7
64Iowa StB12B12912-7.145.738.63-9
65ArizonaP12P12-South10120.537.938.36-6
66CincinnatiAmerAmer-East6124.833.438.27-5
67VirginiaACCACC-Coas1112-5.843.637.84-8
68Central MichiganMACMAC-West5124.733.137.77-5
69Air ForceMWCMWC-Mntn3138.529.137.78-5
70Southern MissCUSACUSA-West21313.224.237.49-4
71MinnesotaB10B10-West1112-4.541.837.35-7
72Boston CollegeACCACC-Atl1212-1.438.236.93-9
73East CarolinaAmerAmer-East7120.436.436.85-7
74MarshallCUSACUSA-East31212.523.936.59-3
75MissouriSECSEC-East1112-3.239.436.25-7
76Arkansas StSunSun31210.425.736.19-3
77SyracuseACCACC-Atl1312-5.541.435.94-8
78Utah StMWCMWC-Mntn4122.133.735.86-6
79MarylandB10B10-East1212-9.845.535.83-9
80South CarolinaSECSEC-East1212-5.841.435.73-9
81Louisiana TechCUSACUSA-West4128.626.835.48-4
82Wake ForestACCACC-Atl1412-7.341.734.33-9
83ConnecticutAmerAmer-East812-1.435.233.86-6
84VanderbiltSECSEC-East1312-5.539.233.74-8
85Middle Tennessee StCUSACUSA-East512627.633.77-5
86Ohio U.MACMAC-East6123.629.232.88-4
87KentuckySECSEC-East1412-4.136.532.35-7
88ColoradoP12P12-South1113-4.235.731.54-9
89AkronMACMAC-East7122.828.431.37-5
90TulsaAmerAmer-West912-2.533.731.36-6
91PurdueB10B10-West1312-11.142.331.22-10
92RutgersB10B10-East1412-7.738.330.64-8
93TroySunSun412-0.830.629.84-8
94San José StMWCMWC-West512-0.529.929.45-7
95BuffaloMACMAC-East812-0.829.328.55-7
96Colorado StMWCMWC-Mntn6122.126.228.27-5
97Georgia StSunSun512-0.226.626.46-6
98Oregon StP12P12-North1212-15.641.926.32-10
99New MexicoMWCMWC-Mntn7120.625.125.77-5
100NevadaMWCMWC-West812-1.627.225.66-6
101UNLVMWCMWC-West912-5.829.723.83-9
102SMUAmerAmer-West1012-15.739.323.62-10
103MassachusettsMACMAC-East912-8.832.223.43-9
104Florida Int'lCUSACUSA-East612-1.925.223.45-7
105ArmyIndInd312-6.529.823.32-10
106Ball StMACMAC-West1012-11.534.222.63-9
107Florida AtlanticCUSACUSA-East712-6.529.122.63-9
108South AlabamaSunSun612-9.630.420.85-7
109TulaneAmerAmer-West1112-1434.420.43-9
110Louisiana-LafayetteSunSun712-5.325.620.34-8
111KansasB12B121012-25.345.420.10-12
112Kent StMACMAC-East1112-10.930.9203-9
113RiceCUSACUSA-West812-6.425.919.55-7
114IdahoSunSun812-10.629.919.44-8
115Miami OHMACMAC-East1212-11.83119.13-9
116Texas-San AntonioCUSACUSA-West912-9.628.118.53-9
117Fresno StMWCMWC-West1012-13.63218.43-9
118Texas St-San MarcosSunSun912-11.128.717.63-9
119WyomingMWCMWC-Mntn1112-1431.317.32-10
120Hawai`iMWCMWC-West1213-15.23115.83-10
121New Mexico StSunSun1012-13.128.815.73-9
122Louisiana-MonroeSunSun1113-13.228.615.42-11
123Old DominionCUSACUSA-East1012-10.62615.45-7
124Eastern MichiganMACMAC-West1312-15.630.514.91-11
125UTEPCUSACUSA-West1112-1024.814.85-7
126Central FloridaAmerAmer-East1212-20.635.414.80-12
127North TexasCUSACUSA-West1212-21.533.111.61-11
128UNC-CharlotteCUSACUSA-East1312-15.326.711.32-10

[continue reading…]

{ 2 comments }

2015 And Unique Scores

A fun couple of articles for you to read today, courtesy of Eldorado (@eldo_co) (with a hat tip to Football Outsiders).

Part I

Part II

The full articles are worth your read, but the premise: a record number of made field goals, a high number of missed extra points, and a ton of successful two-point conversions have lead to a record low number of “Football Scores.”

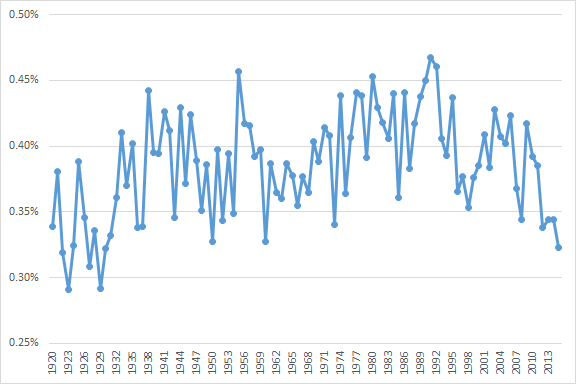
I wanted to run my own numbers on this, and while the effect using my methodology isn’t quite as extreme, 2015 does still stand out. I looked at the likelihood of every score occurring in NFL history (for example, (20-17 has occurred 1.6% of the time throughout NFL history, 17-14 and 27-24 1.3%, 23-20 and 13-10 at 1.1%, and so on). I then took the average likelihood of each score in each season, plotted below:
unique scores

From 1995 to 2014, the “average” final score score had a 0.38% likelihood of occuring; this year number has dropped to 0.32%. Again, that’s not quite as extreme as Eldorado’s results, but it is consistent in direction: 2015 is having some very unusual scores. In fact, the last time the average rate was at 0.32% was in 1930. This year, Tennessee beat Jacksonville 42-39, Pittsburgh beat San Francisco 43-18, and Pittsburgh beat Seattle 39-30; in each instance, those scores had never occurred before in NFL history.

{ 1 comment }

Cam waits for the 4th quarter to arrive

Cam waits for the 4th quarter to arrive

In the 4th quarter and in overtime this year, Carolina quarterback Cam Newton has been really, really good.  Newton has completed 54 of 83 passes for 733 yards with 6 touchdown throws and just one interception, along with five sacks for -35 yards.  Newton is therefore averaging an impressive 8.78 Adjusted Net Yards per Attempt after 45 minutes have gone by in each game; among quarterbacks with at least 40 pass attempts this year, that’s the second best average in the league, a hair behind Tom Brady (8.81) and just ahead of Carson Palmer (8.59). (Although I will note that noted clutch quarterback Tony Romo is averaging 9.77 ANY/A on 21 4th quarter/overtime pass attempts this year.)

Below are the passing stats from every quarterback this year in the 4th quarter and overtime so far in 2015: [continue reading…]

{ 7 comments }


This week at the Washington Post, a look at how the Chiefs have turned into one of the best teams in the NFL.

Alex Smith has gone nine straight games without throwing an interception, tied for the third longest streak (minimum five pass attempts) since 1960.  He’s thrown 305 consecutive passes since his last interception, also the third longest streak in NFL history.  And while there’s a significant amount of luck involved in maintaining turnover-free play for so long, the Chiefs and Smith operate a conservative offense that is more focused on ball control than explosive plays.  Smith’s average pass this season has been just 6.32 yards downfield, the shortest distance in the NFL, and short passes have a much lower chance of being intercepted.

You can read the full article here.

{ 1 comment }

Last Thursday, the Lions hosted the Packers, and jumped out to a 17-0 lead before the end of the first quarter. A field goal attempt midway through the 3rd made it 20-0, although the Packers then responded with two quick scores. With seven minutes left in the 4th, Detroit made it a 9-point game, and seemed to have this one locked up. In fact, when the clock hit triple zeroes, the Lions were ahead, 23-21.

Of course, a phantom face mask penalty meant the game was not yet over, and Green Bay won on the final play of the game. For the game, Green Bay had a Game Script of -10.1, which represents the average score in the game, from the Packers perspective, across the 3600 seconds of action. That’s the worst Game Script by a winning team since San Diego won in similarly remarkable fashion against the 49ers in week 16 of the 2014 season.

Below are the Game Scripts data for week 13: [continue reading…]

{ 3 comments }

Antonio Brown, after hearing he leads the league in ACY/TmAtt

Antonio Brown, after hearing he leads the league in ACY/TmAtt

Last year, Antonio Brown edged Jordy Nelson in Adjusted Catch Yards per Team Attempt by a few thousands of a yard. Brown beat Nelson for the True Receiving Yards crown in 2014, too, repeating as champion after a great 2013 campaign. Antonio Brown is awesome, so seeing him lead the league in a metric isn’t very surprising anymore. But let’s run through the process for new readers.

  • We begin with each player’s number of receiving yards. Then, we add 20 yards for every touchdown catch, and 9 yards (here’s why) for every first down gained (other than first downs that resulted in touchdowns). For Brown, this gives him exactly 1,900 Adjusted Catch Yards, as he has totaled 1,310 receiving yards, 57 first downs (including touchdowns), and 7 touchdowns this season.
  • Next, we divide that number by the number of team pass attempts, excluding sacks, [1]Why am I excluding sacks? Just to save time. In the offseason, I will re-run these numbers and include sack data. by that player’s offense in the games he played. Now Brown hasn’t missed a game this season, so it’s pretty simple: Pittsburgh has thrown 426 passes so far in 2015, which means Brown is averaging 4.46 ACY/TmAtt. By comparison, Julio Jones — who leads all players in Adjusted Catch Yards with 2,016 (1,338 receiving yards, 68 (!) first downs, 6 touchdowns) — is averaging “only” 4.21 ACY/TmAtt, because the Falcons have thrown 479 passes. Think of it this way: Jones has essentially played in one more, super high-volume passing game than Brown, yet has “only” 116 more Adjusted Catch Yards than him (and Brown is averaging 158 ACY/G). As a result, after adjusting for pass attempts, Brown is number one in this metric.
  • One player who really stands out by looking at Adjusted Catch Yards per Attempt but excluding games that player missed is Alshon Jeffery. The Bears wide receiver has had a somewhat quiet season: after all, he’s scored just two touchdowns and has missed five games. But the Bears have been pretty run-heavy this year, and Jeffery has been a first down machine. He has 47 catches for 690 yards and 37 first downs, good enough for 1,045 Adjusted Catch Yards in seven games. Chicago has thrown only 236 pass attempts in those games, giving Jeffery a remarkable 4.43 ACY/TmAtt average this year. Thought of another (perhaps simpler) way, Jeffery ranks 3rd in the NFL in receiving yards per game. In fact, the Bears have totaled just 49% of the pass attempts in Jeffery games as the Falcons have in Jones games, while Jeffery has 52% as many ACY. As a result, he slides past Jones into the number two slot.

[continue reading…]

References

References
1 Why am I excluding sacks? Just to save time. In the offseason, I will re-run these numbers and include sack data.
{ 4 comments }