≡ Menu

Previously:

There are only a handful of games a year where a quarterback throws 35+ passes and still picks up a first down on half his dropbacks. NFL fans were treated to two of them this week.

On Sunday, 49ers backup Nick Mullens had an outstanding performance despite playing with a depleted roster. The 49ers did not punt or turn the ball over and scored 36 points. The 49ers were just the 14th team since 1970 to pull off that hat trick, and Mullens was a big reason why. Mullens averaged nearly ten yards per attempt, and of his 25 completions, 19 went for first downs. PFR’s passing first down data only goes back to 1999, but this was the most pass attempts in a game by San Francisco in a game where the team picked up a first down on
at least half of their dropbacks (including sacks).

Of course, the next night, Patrick Mahomes had to one up him. Mahomes had 42 pass attempts and did not take a sack; he threw for a first down on 22 of his pass attempts as the Chiefs punted just one time. Mahomes also scrambled four times and picked up two more first downs, including a touchdown. The final tally for Mahomes: 46 plays, 24 first downs, 5 TDs.

Below are the week 3 passing stats. [continue reading…]

{ 0 comments }

NFL Stats Through Week 3 — Fun With Stathead

As many readers know, Pro-Football-Reference.com produced remarkable search tools that let readers access that remarkable database to answer all sorts of trivia questions. PFR has now migrated that function to Stathead, and I thought I’d help my readers get use to the Stathead tools, too. So let’s go around the NFL and use the Stathead player and team tools to examine some of the interesting stats through three weeks of the 2020 season. [continue reading…]

{ 0 comments }

Week 2 (2020) Game Scripts: The Jets Stay Grounded

Previously:

[continue reading…]

{ 0 comments }

You may have heard that the New Orleans Saints have now gone 45 straight games without allowing a 100-yard rusher. That’s very impressive: it includes 40 straight regular season games since Samaje Perine of Washington rushed 23 times for 117 yards in an overtime loss when Kirk Cousins was still the team’s quarterback; it also includes 5 straight playoff games (including three losses, naturally).

The defense with the longest streak without allowing a 100-yard rusher, since at least 1950, appears to be the Cleveland Browns. On opening day of the 1951 season, Verl Lillywhite of the 49ers rushed 17 times for 145 yards, including runs of 20, 28, and 33 yards. But from 1951 to 1955 — a span of 60 games during the 12-game era — no other player rushed for more than 83 yards against the mighty Browns. No player rushed for 100 yards in any of the Browns five playoff games during that era, too, although Doak Walker came very close. During Cleveland’s streak of 59 straight games without allowing a 100-yard rusher, the other 11 teams allowed 109 different 100-yard rushing games.

A few years ago, I looked at longest streaks without allowing a 100-yard rusher. At the time, I didn’t have individual player rushing data from the ’50s, so the longest streak was 53 straight games by the early ’90s Eagles. If the Saints go the full season without allowing a 100-yard rusher, that would bring them to 54 straight games, breaking the modern era record.

The table below shows all regular season streaks since 1950 of at least 33 games, along with the individual rusher who broke the mark. [continue reading…]

{ 0 comments }

Week 2 (2020) Passing Stats: Kirk Reaches A New Low

Previously:

Kirk Cousins had a very bad day on Sunday. He averaged -1.38 ANY/A against the Colts, an unspeakably bad performance from an above-average quarterback most weeks. Since 2010, there have been just 22 other times where a quarterback finished with below -1.00 ANY/A, and most of those quarterbacks were very bad.

It was bad on all fronts. He threw 3 interceptions and took 3 sacks, so there were plenty of negative plays. He also threw for only five first downs. His completion percentage was bad, too, and he only averaged 10 yards per completion. The passing offense gained just 95 net yards, and obviously negative adjusted net yards.

How bad was it? Carson Wentz was a disaster on Sunday, throwing for only 242 yards on 43 pass attempts, with 0 TDs, 2 INTs, and only 13 first downs. But in terms of passing value added relative to average, Cousins’s performance was twice as bad as Wentz’s was.

How bad was it? The Vikings finished with a passer rating of 13.0. The last time a team won with a passer rating under 15.0 and their opponent did not have a passer rating under 15.0, was way back in 2008, when the Panthers and Jake Delhomme threw 4 INTs but still beat the Andrew Walter-led Oakland Raiders. If you are wondering why that previous sentence had to be so clunky, it’s because yes there was in fact a game where both teams had passer ratings under 15.0 in recent memory: a 2010 disaster of a game featuring Todd Collins, Matt Moore, and Jimmy Clausen.

On the plus side, we have Bills quarterback Josh Allen, who had the best passing game of his career in week two. The 2018 first round pick finally had his first 300-yard game in week 1 of the 2020 season, and promptly followed that up with his first 400-yard game on Sunday. The 2020 season represents just 6.7% of Allen’s career games played to date, but 12.3% of his career passing yards. Allen became just the 20th player to throw for 400+ yards and have a passer rating of 145.0+ in NFL history; of course, just one of those games came before 1984, with the majority coming in the last ten years.

Below are the full week 2 passing stats. As a reminder, the new formula to calculate Adjusted Yards per Dropback is (Passing Yards + 9 * Pass 1st Downs + 11 * Pass TDs – 45 * INTs – 50 * Fumbles Lost) divided by (Pass Attempts + Sacks). In week 2, the average was 9.37, slightly up from 9.20 in week 1. So for each passer, we multiply his number of dropbacks by the difference between his AdjYd/DB average and 9.37 to create a passing value.
[continue reading…]

{ 0 comments }

History of the Career Receiving Touchdowns Record

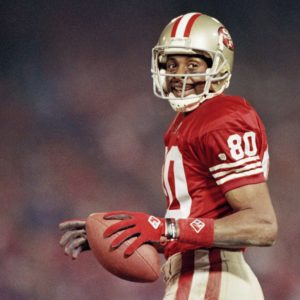
Wide Receiver Jerry RiceI’ve written several histories of NFL career records, but the history of the career receiving touchdowns record is the most fascinating to me. Twelve men held the receptions title, and eleven held the receiving yards record. Seven different players held the record for rushing yards and for rushing touchdowns. Eleven quarterbacks held the passing yardage crown, while ten captured the touchdown title. This record is different. Thanks, primarily, to Don Hutson and Jerry Rice, only four players have held the record for receiving touchdowns since the NFL started keeping official statistics in 1932.

Receivers to Hold the Career Receiving Touchdowns Record

Johnny Blood (7 years as record-holder)

By the end of 1932, the first season in the official NFL record book, Blood had scored 25 receiving touchdowns. Most of those occurred in the “pre-stat” era, with 22 of his scores coming between 1926 and 1931. That includes a career high (by far) eleven touchdowns in 1931—he never had another season with more than five touchdowns. He played until 1938, slowly racking up touchdowns and retiring with 37 through the air.

Don Hutson (49 years, 3 months as record-holder)

Huston finished the 1939 season with 36 receiving touchdowns, just one shy of Blood’s record. To begin 1940, he tied the record in the third quarter of a blowout loss to the Bears, and he broke it in the opening quarter of a blowout win over the Cardinals. He got a fortunate break when WW2 took much of the talent from the NFL; during the war-depleted years, Hutson had by far his most productive touchdown seasons (1941-43 were his only three season with double-digit receiving scores). He ended his career with 99 receiving touchdowns, a number that wasn’t approached for decades.

Steve Largent (3 years as record-holder)

Largent was two touchdowns shy of the record coming into the 1989 season. Things looked dim for the receiver, who scored in week one but followed with ten straight weeks in which he failed to find the end zone. However, he was able to tie the record in game twelve and subsequently break it in week 14. The last touchdown of his storied Hall of Fame career was the one that gave him sole possession of the record. He didn’t hold the record for long, because the most prolific player of all time was already on his heels.

Jerry Rice (27 years, 10 months as record-holder, so far)

Through seven seasons (1985-91), Rice had already compiled 93 receiving touchdowns. [1]He did this despite a slow start, hauling in just three touchdown passes as a rookie. Rice then scored 15, 22, 9, 17, 13, and 14 receiving touchdowns, averaging a touchdown per game over that span. In week 12 of 1992, Rice tied Largent’s record in a victory over the Eagles. The following week, in a dominant win over the Dolphins, World gained sole possession of the record, becoming the first player in history to top the century mark. He added an incredible 96 touchdowns after that, walking away with 197 and a distant lead over anyone before or since. [2]The second and third place receivers, Randy Moss and Terrell Owens, were incredibly productive for several years. Moss finished with 156, and Owens finished with 153. The two of them have a sizable … Continue reading

Future of the Career Receiving Touchdowns Record

This record seems like it’s going to last for a pretty long time. As of today, the top ten active leaders in touchdowns are:

Larry Fitzgerald – 120
Rob Gronkowski – 79
Jimmy Graham – 75
Antonio Brown – 75
Jason Witten – 72
A.J. Green – 63
Demaryius Thomas – 63
Greg Olsen – 60
Julio Jones – 57
DeSean Jackson – 55
DeAndre Hopkins – 55

Fitzgerald is 37 and is still 77 touchdowns short of the record. Gronk needs 118 to tie, which would more than double his career output to date. Given his injury history, it’s a little outlandish to expect him to come anywhere close. Graham is 122 shy and is just not very good anymore, and he hasn’t been for some time now. Brown is also 122 away, and he is both 32 years old and out of the league for being a total head case.

Witten has looked and played like an old man since he entered the league. Green looks like he aged a decade overnight. Thomas can’t find a team, and Olsen looks his age. Jones famously doesn’t score touchdowns, while Jackson is 33 and not the threat he once was.

Looking for younger players on the right track, I don’t see anyone. But let’s discuss a few anyway. How about DeAndre Hopkins, Mike Evans, Odell Beckham Jr., Davante Adams, and Travis Kelce.

Hopkins is 28 and has 55 touchdowns. His career high was 13 in 2017. For reference, Rice had eight seasons with at least that many touchdowns (and six with more). He’d have to replicate his best season eleven times to own the record!

Evans is just 27, and he has 50 scores. He has also only had two seasons in which he played the full 16 games. With 9 touchdowns per 16 games over his career, he’d have to reproduce his career average—without missing a game—for over 15 more years. Or average 14.7 touchdowns a year over the next decade.

Beckham started his career on fire, scoring 35 touchdowns in his first three seasons. He’s one of just six players in history to accomplish that. But from 2017 to present, he has played in just 34 games and scored a mere 14 touchdowns. That means after his tremendous start he is now 148 touchdowns short of the record with no signs of reclaiming past glory.

Adams is 28 and has 46 touchdowns. Most of that came from 2016-28, during which time he scored 35 times. He had a down year in 2019, scoring just five touchdowns. That might not seem like an issue, but things have to go perfectly to take the crown from the king. Rice started slow with three touchdowns, but after that, he didn’t have a season as low as five until he was 35 years old and played in just two games. During his “peakiest” peak, from ages 24-33, his touchdown output looked like something from a video game: 15, 22, 9 (his down year), 17, 13, 14, 10, 15, 13, and 15.

Kelce will be 31 in a few weeks. He’s a scoring machine for a tight end, but with 38 touchdowns he is still 159 shy of Rice. If he was guaranteed to match his career high every year until he broke the record, he’d have to play until he was 47.

Maybe Reek Hill is a sleeper. He is a big play threat and a favorite target of a guy who throws a lot of touchdown passes. I don’t think he stands a chance. At 26, he’s already older than he seems. And he has just 33 touchdowns. Rice had 49 by that age and added 97 over the following seven seasons. Then he threw in another 51 just for funsies.

What I’m saying is this: I don’t believe any active player will break Rice’s record, even with expanded schedules.

References

References
1 He did this despite a slow start, hauling in just three touchdown passes as a rookie. Rice then scored 15, 22, 9, 17, 13, and 14 receiving touchdowns, averaging a touchdown per game over that span.
2 The second and third place receivers, Randy Moss and Terrell Owens, were incredibly productive for several years. Moss finished with 156, and Owens finished with 153. The two of them have a sizable lead over fourth place Cris Carter (130), but neither is within 40 of Rice.
{ 0 comments }

When the Jets decided to hire Adam Gase as head coach, I noted that it was an unusual hire because Gase’s teams had been outscored significantly when he was the Dolphins head coach.  His record in Miami was 23-25, the result of winning a number of close games.  So what did that mean for Gase’s prospects going forward?

And we could look at this two ways: did he coach a terrible team that got lucky to have a few more wins than they should have (in which case Gase should be considered a bad coach), or did he oversee a talent-poor team and coached them up to win more often than they should have (in which case Gase should be considered a good coach)?

From 2016 to 2018, Miami went 18-5 in games decided by 7 or fewer points, and 20-6 in games decided by 8 or fewer points.  Both records were comfortably the best in the league.  So, is that sparkling record in close games a positive for Gase — hey, he’s a great coach who wins when the talent level is close! — or a negative for Gase (he’s a terrible coach who is lucky his teams won as often as they did).

Unfortunately for Jets fans, nearly all the research on this subject suggests that a team’s record in close games is not reflective of skill, but of luck.  The Jets have been terrible in close games in recent years, while Gase has been great: you would expect some regression to the mean in either instance, and I would project the Jets to be about .500 in close games during Gase’s tenure.

The bigger cause for concern, then, would be this: Gase went an almost unfathomable 3-19 in games decided by more than 8 points during his time in Miami.

A few months later, I dove even deeper into Gase’s weird splits in close and non-close games. Over his three years in Miami, Gase’s teams had the best record in the NFL in close games, and the second-worst record in non-close games.  Based on how the other highly-regarded coaches fared in this split, I wrote that “if Adam Gase is a great coach who was overachieving with a bad roster, he’s pretty unique in that regard.”

Fast forwarded 18 games later, and the evidence is more convincing than ever that Adam Gase is not a great coach.  The evidence is also still there that Gase has this weird split between close and non-close games. In New York, Gase is 2-9 in games decided by more than 8 points, and 5-2 in games decided by 8 or fewer points.  And that includes a game where the Jets trailed the winless Dolphins by 11 points with 20 seconds left, and kicked a field goal to cut the lead to 8 in the hopes of recovering an onside kick, scoring a touchdown, converting a 2-point attempt, and outscoring Miami in overtime.  If not for that meaningless field goal, Gase would be 2-10 in non-close games and 5-1 in close games with the Jets.

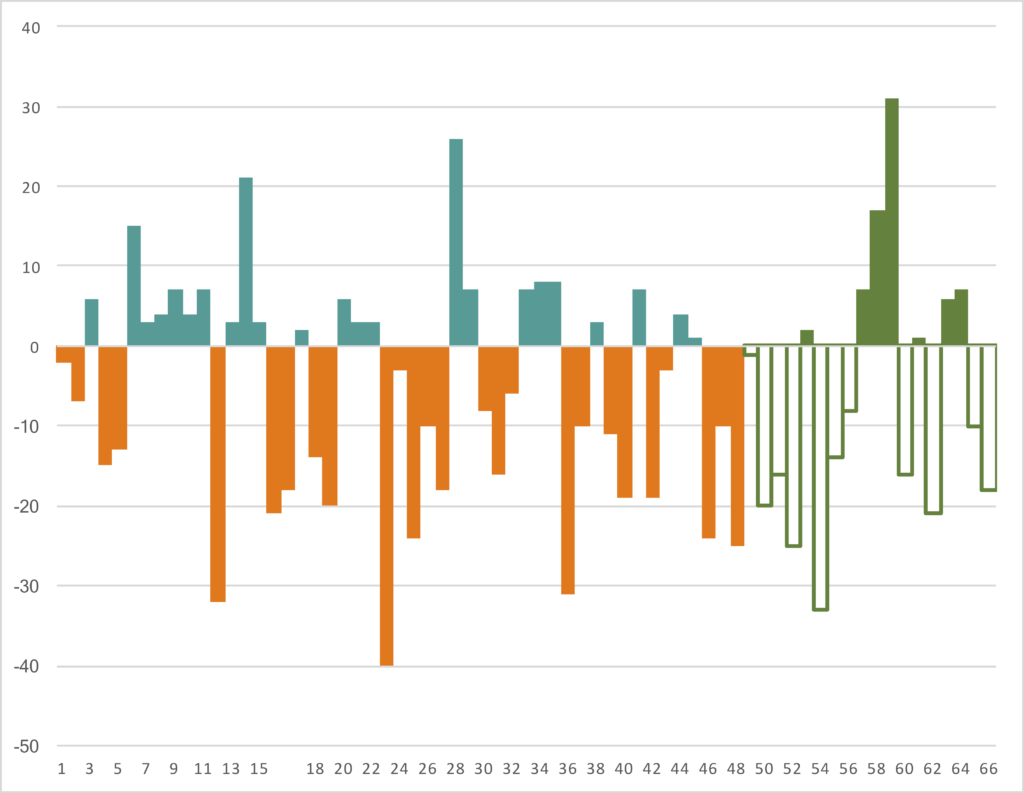
But ultimately, Gase is 5-28 in games decided by more than 8 points in his now 4+ year head coaching career.  He’s also 25-8 in close games!  The graph below shows the points differential for Gase’s teams in each of his 67 games as head coach.  If you think this graph looks like an iceberg, you are right: most of the action takes place below the surface.

[continue reading…]

{ 0 comments }

The Jets and Eagles both lost division games in week one by the same 27-17 score. But don’t let the final score deceive you: these two games were as different as can be. With 5 minutes left in the 2nd quarter of both games, the Jets trailed Buffalo 21-0 while the Eagles led 17-0 over the Washington Football Team. The final scores were not at all indicative of how the game unfolded: the Bills dominated the game start to finish, and only a late Jets touchdown kept the final score respectable. Buffalo finished with a +12.4 Game Script, meaning the Bills led — on average — by 12.4 points over every second of the game. Meanwhile, Washington had a -5.3 Game Script — trailing big early, trailing entering the 4th quarter, and only taking a lead with less than 7 minutes remaining — in the comeback win.

Every year, I calculate the game scripts each week for each NFL game. The Game Script is simply the name I assign to the points differential over every second of the game. Last year, Baltimore had the highest Game Script of week 1, and they repeated that feat on the opening weekend of 2020. There were several notable comebacks in week 1 of the 2020 season, but Washington and Chicago stood out with huge comebacks. The full Game Scripts data below. [continue reading…]

{ 0 comments }

Week 1 (2020) Passing Stats: Lamar Does It Again

In week 1 of the 2019 season, Lamar Jackson had a breakout performance that foreshadowed his MVP season. And while his performance in week 1 of the 2020 season wasn’t quite as dominant, it still was the most effective passing performance — at least, statistically — of any quarterback in week one.

I like to post the weekly passing numbers and analyze which quarterbacks had the most valuable stat lines. I am going to tweak the formula a bit this year. The normal formula is based on Adjusted Net Yards per Attempt, which is (Passing Yards + 20*Passing TDs – 45*INTs – Sack Yards Lost) divided by (Pass Attempts + Sacks). But this year, I will make a couple of changes. I will incorporate a first down bonus of 9 yards, and since all touchdowns are also first downs, that means the multiplier on touchdowns will be 11 instead of 20. In addition, I am going to include a penalty of 50 yards for fumbles. So the new formula is (Passing Yards + 9 * Pass 1st Downs + 11 * Pass TDs – 45 * INTs – 50 * Fumbles Lost) divided by (Pass Attempts + Sacks).

Baltimore’s third-year quarterback went 20/25 for 275 yards with 3 TDs and 0 INTs against the Browns, while taking 2 sack and losing 14 yards. That means Jackson had 429 Adjusted Yards on 27 dropbacks, or 15.89 Adjusted Yards per Dropback. Overall, passers in week 1 averaged 9.20 Adjusted Yards per Dropback. To calculate passing value, we multiply that difference (15.89 – 9.20) by Jackson’s 27 dropbacks. Therefore, Jackson added 181 adjusted yards over average this week, the best of any passer. The way this formula works, all passers will sum to zero value over the week, since we are measuring value compared to average.

That means some quarterbacks will have to fare poorly, and nobody did worse than Carson Wentz. The Eagles passer went 24/42 for 270 passing yards, with 2 TDs, but that’s where the good stats end. Wentz threw 2 INTs and lost a fumble, and was sacked a whopping 8 times and lost 62 yards, and only picked up 13 first downs on his 50 dropbacks. Wentz averaged 4.14 Adjusted Yards per Dropback, which means he produced -253 Adjusted Yards relative to league average.

The full week 1, 2020, passing stats below: [continue reading…]

{ 0 comments }

History of the Career Passing Yards Record

This is an update and revision to a post I wrote after Peyton Manning’s retirement following the 2015 season. I originally penned it to celebrate Manning’s triumph over the record books and look back at the history of the record. Since then, Drew Brees and Tom Brady have broken that record, and both look to push it to new heights as they battle for the crown. Brees beat Brady to the mark and hasn’t looked back yet. The Saint has a history of beating the odds. He has been lauded by an adoring media and legions of fans, and deservedly so. However, with all the attention given to modern players, we often fail to properly remember former greats – legends of the game who paved the way for the sports celebrities of today.

More than relics from days past, these men were trailblazers who helped legitimize the sport we have grown to love. Unlike the iconic sports figures of today, many of these players were actual heroes, serving in the military and coming home to work full-time jobs to support their families. Before quarterbacks were millionaires, they were mostly indistinguishable from the everyman. Except on Sundays. On Sundays, they became giants. [continue reading…]

{ 1 comment }

The Grand List, part 16

Get ready for part 16 in my neverending series The Grand List, or: the top 1000 players in history in the opinion of one guy on the internet. This is an offense-heavy section of the list, with 37 of the 50 players on that side of the ball. There are quarterbacks whose own fans didn’t seem to care for them, a stylistic variety of running backs, receivers spanning nearly the whole of the league’s history, a group of underrated tight ends, and something for everyone along the offensive line. While there aren’t many defenders, each main corps is represented. Maybe you’ll like it.

Previous articles in the series

The Grand List, part 1: Includes honorable/special mentions and players 1000-990.
The Grand List, part 2: Includes players 989-965.
The Grand List, part 3: Includes players 964-940.
The Grand List, part 4: Includes players 939-901.
The Grand List, part 5: Includes players 900-876.
The Grand List, part 6: Includes players 875-851.
The Grand List, part 7: Includes players 850-810.
The Grand List, part 8: Includes players 809-780.
The Grand List, part 9: Includes players 779-750.
The Grand List, part 10: Includes players 749-700.
The Grand List, part 11: Includes players 699-650.
The Grand List, part 12: Includes players 649-600.
The Grand List, part 13: Includes players 599-550.
The Grand List, part 14: Includes players 549-500.
The Grand List, part 15: Includes players 499-450.

Let us go then, you and I.

[continue reading…]

{ 0 comments }

The Grand List, part 15

It’s time for the fifteenth installment of The Grand List, or: the top 1000 players in football history. Or something like that. This is an ideal post for long ball fetishists, nose tackle aficionados, and fans of linemen who were underrated because of the skill players for whom they blocked. Please send all hate mail to Chase. He loves reading that stuff.

Previous articles in the series

The Grand List, part 1: Includes honorable/special mentions and players 1000-990.
The Grand List, part 2: Includes players 989-965.
The Grand List, part 3: Includes players 964-940.
The Grand List, part 4: Includes players 939-901.
The Grand List, part 5: Includes players 900-876.
The Grand List, part 6: Includes players 875-851.
The Grand List, part 7: Includes players 850-810.
The Grand List, part 8: Includes players 809-780.
The Grand List, part 9: Includes players 779-750.
The Grand List, part 10: Includes players 749-700.
The Grand List, part 11: Includes players 699-650.
The Grand List, part 12: Includes players 649-600.
The Grand List, part 13: Includes players 599-550.
The Grand List, part 14: Includes players 549-500.

Enjoy.

[continue reading…]

{ 0 comments }

Lynn Swann’s Peak Was Short But Brilliant

Bradshaw’s career took off when Swann entered the starting lineup.

Lynn Swann played for only nine seasons, and he had an even shorter peak: there was just the 6-year stretch in the middle of his career (1975 to 1980) where he was Lynn Swann. But during that period, he was arguably the most talented — and productive — wide receiver in the NFL. Film analysis of Swann leaves little doubt about the man’s talent, but be playing on a run-heavy team in a dead ball era, his statistics tend to look unimpressive to the modern eye. That goes double for his career statistics, which were produced in only 116 games, the fewest of any modern receiver in the Hall of Fame. The 1970s was a brutal time to be a wide receiver, as the rules of that day made passing much more challenging than it is today. But when he was actually on the field, and his teams dialed up a pass play, Swann was easily one of the best receivers in the NFL.

Let’s start with Swann’s breakout year in 1975. In only his second season, he caught 11 touchdowns, tied with the Mel Gray for the league lead. Swann also ranked 8th in the NFL in receiving yards, and he did so while playing on a run-heavy Steelers team. While Swann’s raw numbers may not look great to the 2020 eye, he had 31% of all Steelers receiving yards and over 50% of his team’s receiving touchdowns. The most productive wide receiver in 1975 was Houston’s Ken Burrough, who that year became the last player in NFL history to gain over half of his team’s receiving yards. Gray had more yards than Swann, and Oakland’s Cliff Branch had a huge year on a run-heavy team, too. But I put Swann as the 4th most productive receiver in the NFL this year based on the following formula:

[ (Receptions * 5) + (Receiving Yards) + (Receiving TDs * 20) ] / (Team Pass Attempts, pro-rated for games played]

Let’s look at that formula again. Swann had a stat line of 49-781-11, which translates to 1,246 adjusted catch yards. Pittsburgh threw 337 passes in 1975, tied for the third fewest in the NFL. That means Swann averaged 3.70 adjusted catch yards per team pass attempt — which is one useful measure of receiver efficiency. Here were the top 15 receivers in 1975 in ACY/TPA: [continue reading…]

{ 0 comments }

The Grand List, part 14

It’s time for the fourteenth part in my series The Grand List, or: the top 1000 pro football players in history. [1]Who made their mark in the NFL or the pre-NFL pros. Anthony Calvillo will not be making an appearance. By the end of the article, we will finally be at the halfway mark. When I began this project, the plan was to fit the full thousand in thirteen posts, so you see how good I am at planning ahead. This section is heavy on offensive skill players (18) and trench players (19), so if you enjoy reading about those positions, you’re in luck. If not, there are a few other fellows in there too, so don’t feel left out. This is yet another post that includes Pro Football Hall of Fame members outside of the top 500. [2]I believe there are eight, but I don’t feel like counting. My hope is that, as the list unfolds, I will have adequately given my reasoning why such acclaimed individuals are so far out of line with the popular view.

Previous articles in the series

The Grand List, part 1: Includes honorable/special mentions and players 1000-990.
The Grand List, part 2: Includes players 989-965.
The Grand List, part 3: Includes players 964-940.
The Grand List, part 4: Includes players 939-901.
The Grand List, part 5: Includes players 900-876.
The Grand List, part 6: Includes players 875-851.
The Grand List, part 7: Includes players 850-810.
The Grand List, part 8: Includes players 809-780.
The Grand List, part 9: Includes players 779-750.
The Grand List, part 10: Includes players 749-700.
The Grand List, part 11: Includes players 699-650.
The Grand List, part 12: Includes players 649-600.
The Grand List, part 13: Includes players 599-550.

Let’s get down to business.

[continue reading…]

References

References
1 Who made their mark in the NFL or the pre-NFL pros. Anthony Calvillo will not be making an appearance.
2 I believe there are eight, but I don’t feel like counting.
{ 0 comments }

Update: Top Receiving Seasons By Age

Five years ago, I noted the age when receivers produced their best season in terms of receiving yards. Today, I am going to revisit that study.

Irving Fryar is the biggest outlier in NFL history in this regard. He was a top college star and a prized NFL prospect who wound up going first overall in the USFL-depleted 1984 NFL Draft. He spent his 20s on some inconsistent Patriots teams, and then in 1991, at the age of 29, he had his first 1,000-yard season while playing with a below-average quartebrack in Hugh Millen. Fryar then went to Miami, and while playing with Dan Marino, had a career-season at age 31 in 1994. Eventually, Fryar landed in Philadelphia during the lean, pre-Reid/McNabb years. And yet in 1997, at the age of 35, while playing with journeymen Ty Detmer and Bobby Hoying in a Jon Gruden offense, Fryar had the first 1,300-yard season of his career.  In fact, it remains the lone season of 1,300+ yards by a player 35 years or older… which is pretty remarkable given the quarterback presence.

There are 141 players in NFL history who have reached 7,000 career receiving yards.  Fryar is the only one to have his best season (measured by receiving yards) at the age of 35; only four other players — Pete Retzlaff, Charlie Joiner, Bobby Engram, and Joey Galloway — had their best season at age 34.

The graph below shows the age where each of the 141 players with 7,000 career receiving yards had their best season. [continue reading…]

{ 0 comments }

While we often focus on the rules changes that have helped make passing offenses much more efficient over the years, there’s another small reason for the improvement in aerial attacks: better climates. Let’s compare the stadiums in the NFL now to the stadiums of the early 1970s.

Expansion/Re-Location

There are 7 new cities (and one deserted city) that have joined the NFL since the early ’70s, when the league still had just 26 teams.  Five of these new cities helped the passing game by bringing in more mild-climate games due to warm weather locations or indoor stadiums. [1]Note that I am ignoring the California changes here. The Rams played in southern California in the ’70s and now, even if there was a St. Louis stop in the middle (which that was mostly indoors, … Continue reading

  • There was no team in Indianapolis, which has an indoor stadium. [2]Of course, the Colts played in Baltimore, and no longer do; but for purposes of looking at geography, there was a team in Baltimore in the ’70s and a team in Baltimore now; Indianapolis is the … Continue reading
  • The Cardinals did not play in Arizona, which has an indoor stadium, but instead played outdoors in the 1970s in St. Louis (the deserted city).
  • There was no team in Tampa Bay, a warm-weather city
  • There was no team in Carolina, a warm-weather city
  • There was no team in Jacksonville, a warm-weather city

While those fives changes made passing easier by decreasing the impact of the elements in the northern cities, two changes increased the impact of the weather.

  • There was a team in Houston playing indoors at the Astrodome, but the franchise founded by Bud Adams now play outdoors in Nashville, Tennessee. Of course, they were replaced by another team playing inside in Houston.
  • There was no team in Seattle, which is a cold-weather city.

[continue reading…]

References

References
1 Note that I am ignoring the California changes here. The Rams played in southern California in the ’70s and now, even if there was a St. Louis stop in the middle (which that was mostly indoors, anyway).  I am also ignoring the Raiders bouncing between Oakland and Los Angeles and Oakland and now Las Vegas, the Chargers moving to L.A. from San Diego, and the 49ers going from San Francisco to Santa Clara.
2 Of course, the Colts played in Baltimore, and no longer do; but for purposes of looking at geography, there was a team in Baltimore in the ’70s and a team in Baltimore now; Indianapolis is the new city, even if for expansion purposes, it didn’t quite work out that way. Similarly, there was a team playing indoors in Houston in the ’70s and now, regardless of whether it was the Oilers or the Texans.
{ 0 comments }

The Grand List, part 13

Strap in for the unlucky thirteenth installment of my endless summer series The Grand List, or: the best 1000 pro football players in (mostly) NFL history. There are a few Hall of Famers who probably seem way too low, along with some likely head scratchers who you will feel are too high. I don’t think there is a right or wrong answer on lists like these. We just use the evidence available to us to make the most informed decision we can, bringing our preferences and biases along for the ride. [1]I have spent years trying to understand my own biases and build safeguards into my work in order to catch them. I promise that I will still fail in that regard, like all other humans, but hopefully … Continue reading

Previous articles in the series

The Grand List, part 1: Includes honorable/special mentions and players 1000-990.
The Grand List, part 2: Includes players 989-965.
The Grand List, part 3: Includes players 964-940.
The Grand List, part 4: Includes players 939-901.
The Grand List, part 5: Includes players 900-876.
The Grand List, part 6: Includes players 875-851.
The Grand List, part 7: Includes players 850-810.
The Grand List, part 8: Includes players 809-780.
The Grand List, part 9: Includes players 779-750.
The Grand List, part 10: Includes players 749-700.
The Grand List, part 11: Includes players 699-650.
The Grand List, part 12: Includes players 649-600.

In the immortal words of Al Bundy: let’s rock.

[continue reading…]

References

References
1 I have spent years trying to understand my own biases and build safeguards into my work in order to catch them. I promise that I will still fail in that regard, like all other humans, but hopefully not miserably so. Completely unbiased opinions don’t exist, and I don’t trust those who claim otherwise.
{ 0 comments }

The Grand List, part 12

It’s time for the dirty dozenth episode in my endless series The Grand List, or: the top 1000 pro players in history in one fool’s opinion. This section of the list is heavily populated with trench players, but it should have enough skill players to keep casual fans moderately interested (they told me I should sell myself, so I hope that worked). The writeups are probably going to be a little shorter from now on. What can I say? I’m tired.

Previous articles in the series

The Grand List, part 1: Includes honorable/special mentions and players 1000-990.
The Grand List, part 2: Includes players 989-965.
The Grand List, part 3: Includes players 964-940.
The Grand List, part 4: Includes players 939-901.
The Grand List, part 5: Includes players 900-876.
The Grand List, part 6: Includes players 875-851.
The Grand List, part 7: Includes players 850-810.
The Grand List, part 8: Includes players 809-780.
The Grand List, part 9: Includes players 779-750.
The Grand List, part 10: Includes players 749-700.
The Grand List, part 11: Includes players 699-650.

Let’s get into it, friendos.

[continue reading…]

{ 0 comments }

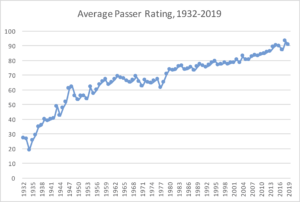
Over the last few years, I have been updating the career passer ratings for NFL quarterbacks to adjust for era. Over the last 100 years, the NFL has consistently approved rules changes to make passing easier, and as a result, passer rating has consistently spiked:

[continue reading…]

{ 1 comment }

Our plan was not to run… We didn’t come in here and say, “Let’s put the blade down and take these guys on.” You’ve got to be realistic in your game preparation. We came to throw the football.

— Detroit Lions Head coach Darryl Rogers, post-game press conference, October 9th, 1988.

In week 6 of the 1988 season, the 4-1 Bears and 1-4 Lions squared off in Detroit’s Pontiac Silverdome. And coach Rogers knew that running the ball was unlikely to be the key to victory: since the Bears emerged as the league’s dominant defense in ’84, Detroit was 0-7 against Chicago and had rushed 139 times for just 421 yards in those seen games, a pitiful 3.03 yards per carry average. [1]The 8th game was lost in the 1987 strike. And while the ’88 version wasn’t quite the ’85 Bears, Chicago’s run defense was red hot, allowing just 34 rushing yards on 26 carries *combined* in the previous two weeks. And let’s dispel with any sense of wonder: on this day, the Lions would rush 13 times for 42 yards. [continue reading…]

References

References
1 The 8th game was lost in the 1987 strike.
{ 0 comments }

Rob Gronkowski, Tom Brady, and WOWY Stats

Tis better to be with Gronk than without.

Rob Gronkowski played for the New England Patriots from 2010 to 2018. It was one of the wildest and most celebrated rides in NFL history. But today I want to build on the great work done by Adam Harstad and analyze Gronk’s career through the lens of how Tom Brady fared — with and without Gronk. [1]As always, thanks to Adam for the inspiration and much of the methodology behind this post. For defining what is included in my data set, please jump to the end of this post to see how Gronk games and non-Gronk games are defined.

I am going to not going to spend much time discussing Gronk’s first and last seasons, for two reasons. In 2010, rookie Gronk was not yet Gronk(TM); he also didn’t miss any games. And 2018 Gronk was BrokenGronk; outside of 2010 and 2018, he was pretty much always a dominant force when healthy.

So let’s focus on the prime 7 years of Gronk’s career. In 2011, 2014, and 2015, Gronkowski was almost always healthy. There was only one missed game of note there, and it was one where Brady and the entire Patriots team struggled. [2]Technically there was a second missed game, but it was a week 17 game where Gronkowski sat out to rest and Brady only played a half. In those three seasons, Gronkowski was a unanimous first-team All-Pro selection each season among major voting publications.

So, for WOWY purposes — that is, With Or Without You — the seasons we have to analyze for Gronkowski and Brady are 2012, 2013, 2016, and 2017. And the results are staggering in each year.

2012

The Patriots had 10 Gronk games and 8 non-Gronk games this season, which ended in a loss without Gronk to the Ravens in the AFC Championship Game. The stats:

  • In the Gronk games, New England had a 0.700 winning percentage, averaged 35.8 (!) points per game, picked up 28.4 first downs and 16.4 passing first downs per game, and the passing offense averaged 7.73 Adjusted Net Yards per Attempt (ANY/A).
  • In the non-Gronk games, New England had a 0.750 winning percentage, averaged 31.6 points per game, picked up 26.5 first downs and 15.8 passing first downs per game, and averaged 6.84 ANY/A.

Notably, that’s a difference of 4.2 points per game and 0.89 ANY/A per game without Gronk. And while the record was slightly worse, it’s worth noting that the three losses came by a combined four points.

2013

The Patriots had 7 Gronk games and 11 non-Gronk games this season, which ended in a loss without Gronk in the AFCCG to the Broncos.  The stats:

  • In the Gronk games, New England had a 0.714 winning percentage, averaged 32.0 points per game (and allowed 27.1 PPG), picked up 26.6 first downs and 16.3 passing first downs per game, and averaged 6.98 ANY/A.
  • In the non-Gronk games, New England had a 0.727 winning percentage, averaged 25.4 points per game (and allowed 17.8 PPG), picked up 21.3 first downs and 12.3 passing first downs per game, and averaged 5.64 ANY/A.

The offense nearly fell apart without Gronk, dropping 6.6 points per game and gaining 5.3 fewer first downs.  The passing offense declined by 1.34 ANY/A. And while I presume this is mostly (all?) due to randomess, this begins a trend of New England allowing significantly fewer points in non-Gronk games. Which is just weird.

2016

The Patriots had 5 Gronk games and 10 non-Gronk games this season — which was perhaps Brady’s best season outside of ’07.  New England won the Super Bowl without Gronkowski.  The stats:

  • In the Gronk games, the Patriots posted a 4-1 record [3]With Gronk unable to haul in the game-tying touchdown catch, or the victim of pass interference, depending on your perspective., averaged 32.0 points per game (and allowed 20.4 PPG), picked up 23.6 first downs and 13.8 passing first downs, and had a ridiculous 9.93 ANY/A average.
  • In the non-Gronk games, the Patriots went 1o-0, averaged 30.4 points per game (and allowed 14.8 PPG), picked up 24.0 first downs and 14.9 passing first downs, and averaged 7.67 ANY/A.

It’s hard to argue with 10-0, and the team gained more first downs without Gronk… but the record was driven in large part by that defense, too.  The Patriots averaged 1.6 more points per game with Gronk and 2.26 ANY/A per game with Gronk.  In the 5 Gronk games, Brady’s stat line was just ridiculous, and the offense scored 20 touchdowns and had just 18 punts and one interception. That was, of course, an unsustainable pace, but it just highlights how dominant Brady and Gronk were in ’16; in the 10 non-Gronk games, the offense had 34 touchdowns and 47 punts. In these 5 games, Gronkowski caught 24 passes for 19 first downs, 529 yards and 3 touchdowns.

2017

The Patriots had 16 Gronk games and 3 non-Gronk games this season, which ended with a loss in the Super Bowl to the Eagles (but don’t blame the Patriots passing attack or Gronkowski, who had 116 yards and 2 touchdowns). The stats:

  • In the Gronk games, the Patriots had a 0.813 winning percentage, averaged 30.4 points per game, picked up 25.8 first downs and 15.7 passing first downs, and averaged 8.22 ANY/A.
  • In the non-Gronk games, the Patriots went 2-1, averaged 21.0 points per game, picked up 19.7 first downs and 13.3 passing first downs, and averaged 5.81 ANY/A.

That sounds like a huge drop — 9.4 points per game and 2.42 ANY/A — but the sample size is small.  Brady played poorly in the two regular season non-Gronk games, an upset loss to Miami and a narrow win over Tampa Bay.   Those were two of his worst games of the season, which probably wasn’t just a coincidence. I don’t want to make much out of a 3-game sample size, but putting aside the magnitude, the direction is consistent with other years.

Gronk WOWY Stats

Here are the full stats for Brady and the Patriots offense in each season, in both Gronk games (top rows) and non-Gronk games (bottom rows).

What Is A Gronk Game and What is Not A Gronk Game?

Finally, let me explain how I identified what is a Gronk game and what is not a Gronk game. Let’s work in reverse order:

  • 2018: Gronk missed the games in weeks 8, 10, and 11 due to ankle and back injuries.  While he was not necessarily his former self, he played in at least 67% of the snaps in every other game this season.
  • 2017: Gronk missed 3 games here.  He missed a game on a short week against the Bucs due to a thigh injury, was suspended for the second Dolphins game, and suffered a concussion in the first half against the Jaguars in the AFC Championship Game.  He finished that game with just 1 target and 26 snaps, representing 41% of the team’s snaps.  I am counting this as NOT a Gronk game (which the Patriots won).  Note that in the regular season finale against the Jets, Gronk played most of the game (68% snaps) but functioned solely as a blocker: he did not record a single target. That still counts as a Gronk game, as it was more importantly for the Patriots offense, a Bryce Petty game.
  • 2016: Gronk missed the first two games of the season with a hamstring injury, and played just 11 snaps (blocking on 10 of them) in the week 3 game against Houston.  However, I am going to exclude all of the first four games of the 2016 season for New England, since Brady was suspended; those games are eliminated from this study and don’t count as a Gronk game or a non-Gronk game, since we are analyzing Brady’s WOWY stats. Then in week 12 against the Jets, Gronk suffered a season-ending back injury and played just 7 snaps. New England won, 22-17; this game is counting as NOT a Gronk game. So games 5 through 9 are the only Gronk games this year.
  • 2015: Gronkowski missed one game (against the Eagles) due to a knee injury.
  • 2014: Gronkowski began the year missing the preseason as he recovered from a torn ACL/MCL (more on this below); he wound up playing between 40 and 45% of the Patriots offensive snaps the first two weeks, where New England went 2-0.  I am counting these games as Gronk games (he had 17 combined targets), but just wanted to note the injury.  Gronkowski sat out the week 17 game, which would normally mean that’s a non-Gronk game.  But because the Patriots had clinched the #1 seed before the week 17 game and Brady only played for the first half, so I am excluding that game as a non-Gronk game, too.  That is the fifth and final game in this study I am eliminating entirely (along with the four suspension games for Brady).
  • 2013: Gronkowski suffered a season-ending knee injury on a hit by T.J. Ward early in the 3rd quarter of a week 14 game against the Browns.  Since Gronk played 49% of the snaps and made it into the third quarter, I will still count this as a Gronk game (as opposed to the Jaguars AFCCG).
  • 2012: Gronk broke his forearm late in a win over the Colts in week 11; that game counts as a Gronk game.  However, he barely played (31% of snaps) in his return, a tune-up, week 17 game to get ready for the playoffs, and then re-injured his arm seven snaps into the team’s first playoff game.  He would miss the rest of the season.  Both of those final two games are being counted as non-Gronk games. Therefore, the first 10 games of ’12 were Gronk games, and the last 8 games were non-Gronk games.
  • 2011: No missed games.
  • 2010: No missed games.

As always, please leave your thoughts in the comments.

References

References
1 As always, thanks to Adam for the inspiration and much of the methodology behind this post.
2 Technically there was a second missed game, but it was a week 17 game where Gronkowski sat out to rest and Brady only played a half.
3 With Gronk unable to haul in the game-tying touchdown catch, or the victim of pass interference, depending on your perspective.
{ 0 comments }

The Grand List, part 11

Hello, friends and enemies, and welcome to the eleventh installment of the Grand List, or: the top 1000 robust gentlemen ever to participate in gridiron activities. It’s been a while. With everything going on in the country over the past month, I haven’t found any joy thinking about something as trivial as football. Many use sports as an escape from the slings and arrows of the world, but I’ve never been able to do that. For me, football has always been more of a mirror than a door. When I began this project, my goal was to finish this series by the beginning of the 2020 regular season, and I still plan to make it – even if my heart isn’t really in it. I hope you enjoy reading it more than I enjoy writing it. [1]I was kind of banking on a long season postponement to help me out. Aside from jobs affected by it, in a pure abstract sense, I think it would be neat to have a one year break in action after the … Continue reading

Question for those reading along: what is the ideal number of entries in a single article? I’ve done as few as ten and as many as fifty. A small number would theoretically result in more frequent posting, while larger articles take more time but give you more to chew on. I don’t plan to write more than a paragraph for any single player, because a thousand is a big number, and I’m a lazy guy (and how many different ways can you say a tackle blocked well or a corner covered well?).

Previous articles in the series

The Grand List, part 1: Includes honorable/special mentions and players 1000-990.
The Grand List, part 2: Includes players 989-965.
The Grand List, part 3: Includes players 964-940.
The Grand List, part 4: Includes players 939-901.
The Grand List, part 5: Includes players 900-876.
The Grand List, part 6: Includes players 875-851.
The Grand List, part 7: Includes players 850-810.
The Grand List, part 8: Includes players 809-780.
The Grand List, part 9: Includes players 779-750.
The Grand List, part 10: Includes players 749-700.

Without further ado, let’s endeavor to find meaning in the meaningless. [continue reading…]

References

References
1 I was kind of banking on a long season postponement to help me out. Aside from jobs affected by it, in a pure abstract sense, I think it would be neat to have a one year break in action after the first hundred years of the league.
{ 0 comments }

Trading 2 First Round Picks For A Player

The Seahawks gave up how much for Adams?

There have been 8 trades in the 21st century where an NFL veteran was traded for two first round picks. [1]I understand that this is an arbitrary way to look at trading players. The Vikings received the 7th pick in the 2005 Draft for Randy Moss; that’s a more valuable draft haul than getting first … Continue reading Today I am going to analyze those trades.

In half of those cases — the older ones — the player was traded before the NFL Draft, which allowed the trading team to get some immediate draft picks. In the other half (which have all occurred in the last three years), the team trading away two first round picks wouldn’t lose any picks until the next season; presumably, that helped incentivize them to make the deal, as there is always a discount rate applied to trading future picks.

Let’s look at these 8 trades, from who gave up the least to who gave up the most. Note that I am only looking at draft value (or players, when included in the trade) sent over for the player; I am ignoring the contract part of the analysis, along with how good the player actually was. On to the list… [continue reading…]

References

References
1 I understand that this is an arbitrary way to look at trading players. The Vikings received the 7th pick in the 2005 Draft for Randy Moss; that’s a more valuable draft haul than getting first round picks in 2006 and 2007 from a team that’s expected to be very good. For purposes of this post, I will note players traded after the NFL Draft, and applying a discount (10% in the next season, 20% for two seasons away) when appropriate.
{ 0 comments }

Super Bowl Champions and Elite Safeties

In light of the Jets trading Jamal Adams to Seattle — more on this later — I wanted to take a look at the correlation between top level safety play and Super Bowl champions.

Hall of Fame Safeties and Super Bowl Champions (15)

There have been 15 Super Bowls won by safeties who would make the Hall of Fame. Six HOF safeties won two Super Bowls: Willie Wood with the Packers, Troy Polamalu with the Steelers, Steve Atwater with the Broncos, Ronnie Lott with the 49ers, Cliff Harris with the Cowboys, and Donnie Shell with the Steelers. In addition, Johnny Robinson won with the ’69 Chiefs, Rod Woodson won with the ’00 Ravens, and Ed Reed won with the ’12 Ravens.

Defensive Player of the Year and Super Bowl Champions (3)

In addition to Polamalu, Rod Woodson, and Ed Reed, Bob Sanders won a Super Bowl with the ’06 Colts and was the AP DPOY in ’07. Dick Anderson was the AP DPOY in ’73, and won Super Bowls with Miami in ’72 and ’73. Both players were huge parts of their team’s titles.

First-Team All-Pro and Super Bowl Champions (23 plus 7)

There have been even more safeties who, at one time in their career were first-team All-Pros and were starters on a Super Bowl champion. This includes all six Patriots teams — Lawyer Milloy in ’01, Rodney Harrison in ’03 and ’04, and Devin McCourty in ’14, ’16, and ’18. Dwight Hicks was an All-Pro with the 49ers during his prime and was a Pro Bowler on both the ’81 and ’84 teams. Darren Woodson is a near Hall of Famer who won two rings with the Cowboys. Mike Wagner was a very good safety who started for the ’74 and ’75 Steelers. And eleven other guys have won once.

That list is headed by likely HOFers in LeRoy Butler with the ’96 Packers, John Lynch with the ’02 Bucs, and Earl Thomas with the ’13 Seahawks… along with Darren Sharper (’09 Saints) who well, was a HOF-level player and a reprehensible person and rapist. Tyrann Mathieu (’19 Chiefs) may also one day have a Hall of Fame case, although it’s obviously early.

The rest of the list: Merton Hanks with the ’94 49ers, Malcolm Jenkins with the ’17 Eagles, Jim Hudson with the ’68 Jets, Gary Fencik with the ’85 Bears, Mark Murphy with the ’82 Washington Football Team, and Rick Volk with the ’70 Colts.

In addition, there are 7 Super Bowl champions who, in addition a blue chip safety, had another All-Pro safety. Jake Scott won two Super Bowls with Miami in ’72 and ’73 playing alongside Anderson, Mike Wagner started next to a HOFer in Shell on the ’78 Steelers, Charlie Waters and Cornell Green were All-Pro safeties who played next to Harris on the ’77 and ’71 Cowboys, respectively, Eugene Robinson started next to Butler on the ’96 Packers, and Tim McDonald was the other safety on the ’94 49ers.

The graph below shows the starting safeties for all 54 Super Bowl champions, and is color-coded to represent HOF/DPOY players, All-Pros, and 2nd-team All-Pros/Pro Bowlers.
[continue reading…]

{ 0 comments }

For the sake of argument, let’s just assume that there is no 2020 NFL season, or that a 2020 NFL season is cut extremely short after just a couple of games. How would the NFL go about preparing a 2021 Draft Order?

I have seen 3 main ideas floated around:

  • Just re-do last year’s draft order, which seems to me to be a bit unfair. It assumes that the teams that were bad in 2019 will also be bad in 2020.
  • A completely random draft order.  This has the advantage of being ex ante fair — there is no advantage to being the Jets or the Raiders or the Cowboys — but would be extremely unfair ex post: the team that gets the 32nd pick would be at a severe disadvantage to the team that gets the 1st pick.
    • Let’s say you and 31 friends came upon a bag containing $32,000.  It would be very simple and fair to split it $1K for each of you.  Now, you certainly could  engage in a winner-takes-all coin flip battle until there is one person who gets the full $32,000.  And that would be ex ante fair, as all of you would have the same chance of getting it.  But it wouldn’t feel fair after the fact.
    • This feels particularly important for the NFL, when you have a blue chip quarterback prospect.
  • Base the draft order on an average of each team’s record over the last 3 or 4 or 5 years.  This might feel fairer, but what does that have to say about how good these teams are now?  The Patriots would pick last under this scenario, and New England could turn into a below-average team in 2020.  The 49ers would have a top-8 pick.

What I would propose is a draft system that is ex post fair, or at least as fair as we can make it. In a world with no 2020 NFL or college football season, nobody can say with any confidence which teams will be the best in 2021. And you risk creating a lot of backlash among fans if a team lucks into the first overall pick. So the goal of a draft in this hypothetical should be to create an outcome that is relatively fair among all teams.

That sounds hard to do, but it is not impossible. Here is what I am thinking.

How 27 of the 32 teams would draft
Let’s ignore the top 5 picks in the Draft for now; five teams will get the first five picks, and we will deal with them later. Let’s look at the other 27 teams. What the NFL should do is give Team 1 the 6th pick in the first round, Team 2 the 7th pick, Team 3 the 8th pick, and so on, through the end of the first round…. and then go in reverse order for the second round, and keep that reverse order for the rest of the draft (which will be 8 rounds). So Team 1 would receive picks 6, 59 (the last pick in the second round), 86 (the last pick in the third round), 113, 140, 167, 194, and 221, while team 28 would have picks 32, 33, 60, 87, 114, 141, 168, and 195.

Now, is that fair? According to the traditional Jimmy Johnson chart, the teams with early picks would still do better, but not by much; and, in fact, teams at the end would tend to fare slightly better than teams in the middle. [continue reading…]

{ 0 comments }

Guest Post: QB Game Scores

Today’s guest post comes from one of the longest followers of this blog (and its predecessor), Richie Wohlers. Richie is an accountant from Southern California who is a Dolphins fan despite never being to Florida. As always, we thank our guest posters for contributing.


Inspired by Bill James’s Game Score for pitchers, I’ve been tracking something similar for quarterbacks.

This is just a simple way to look at box score stats for a quarterback to see who had the most statistically impressive games.  This is not taking things into account such as win probabilities, air yards, EPA, opponent quality, etc.  More importantly, there are no era adjustments, so this is biased in favor of modern players. That said, the goal was just to create a single number to back up the “awe” factor we may have seen while watching the game.

Methodology:

There are five components to my game score.  They are each weighted equally, though (as with passer rating) completion percentage ends up getting “double-counted” with yards per attempt.  The categories are: Total Yards, Touchdown Passes, Completion Percentage, Yards per Attempt and Interception Percentage.  Each category is worth 20 points, so a perfect game would be worth 100 points.

The threshold for each category is based on the best performance of all time.  Those thresholds are:

Yards: 554 (Norm Van Brocklin, 1951)

Touchdowns: 7 (6 times, most recently Drew Brees in 2015)

Completion Percentage (min 15 attempts): 96.7% (Drew Brees, 2019)

Yards/Attempt (min 15 attempts): 20.5 (Craig Morton, 1970)

Interception Percentage: Each percentage point deducts two points from a player’s score.  (Drew Brees is the highest-rated QB to throw an interception, when he threw for 511 yards, 7 TD and 2 Int in 2015.  It ranks as the 19th-best game.)

A player’s portion of those records is multiplied by 20.  So when Patrick Mahomes threw for 443 yards last season, that was worth ( 443 / 554 = 0.8 * 20 )  16 points.

The top 10 performances: [continue reading…]

{ 1 comment }

Let’s get it out of the way: playing with Tom Brady and Peyton Manning sure helps. From 2007 to 2013, Wes Welker had the best seven year stretch of his career, and most of that time came with Brady as his quarterback (there was one season with Matt Cassel and the 2013 record-breaking season with Manning). During those seven seasons, Welker’s teams averaged a remarkable 32.3 points per game. In 2014, Welker’s team — still the Broncos — also topped 30 points per game, but the other seasons of Welker’s career were spent on significantly less productive offenses.

Of course, in most of those other seasons, Welker himself wasn’t a significant part of the offense: he was a young backup or a past-his-prime player. I wanted to calculate how many points per game each wide receiver’s offense scored over his career. This is trickier than you’d think: what do you do for years where a player was a backup, or missed time due to injury? For Welker, he played 14 games with the 2004 Dolphins but as a returner and did not catch a pass. Would that team count in his career average?

To solve for these problems, I weighted each season by the percentage of career receiving yards he gained in that season.  Welker gained 9,924 receiving yards in his career.  In 2015 with the Rams, he gained 102 yards, or 1.0% of his career total.  That isn’t much, so the Rams production that year — 17.5 points per game, or 5.31 PPG below average — counts for 1.0% of Welker’s career score.  The 2013 Broncos averaged 37.88 PPG, 14.47 better per game than league average; since Welker gained 7.8% of his career yards that season, the 2013 Broncos stats count for 7.8% of his career total.  Welker’s best year was 2011, when he gained 1,569 yards.  That represented 15.8% of his career total, so the 2011 Patriots — 32.06 points per game, 9.88 points per game above league average — counts for 15.8% of Welker’s career grade.

If you perform this analysis for every season of Welker’s career, his team’s averaged 30.13 points per game once you weight for Welker’s production, which was 8.11 points per game above average. Here’s the math: the final two columns represent the product of multiplying his percentage of career receiving yards in that season by his team’s scoring (both raw and relative to league average): [continue reading…]

{ 0 comments }

The GWTD King.

Last week, I looked at which running backs and wide receivers have scored the most game-winning touchdowns. Today, I am reproducing the same analysis but for quarterbacks: who has thrown the most game-winning touchdowns?

As before, a touchdown qualifies as a game-winning touchdown if all of the following four criteria are met:

  • It occurs in the 4th quarter or in overtime;
  • The scoring team was not winning prior to the touchdown
  • The scoring team was winning after the touchdown, including the extra point [1]However, if a team was down by 7, scored a touchdown, went for two and converted, that touchdown does not count as a game-winning touchdown. So in this Cowboys/Giants game from 2018, Dallas was down … Continue reading; and
  • If the touchdown (plus point after) gave the winning team more points than the losing team scored all game. So if a team is down 21-17 and scores a touchdown to go ahead 24-21, and that team ultimately wins 31-27, that does not count as a game-winning touchdown. But if they win 31-21, it does.

Got it? Great. I looked at all games, regular and postseason, in the NFL, AFL, and AAFC and counted all game-winning touchdowns by this metric. As it was back in 2013, Baltimore Colts legend Johnny Unitas remains the king. He had 23 game-winning touchdown passes and also ran for one more, giving him a record 24 game-winning touchdowns on his resume: [continue reading…]

References

References
1 However, if a team was down by 7, scored a touchdown, went for two and converted, that touchdown does not count as a game-winning touchdown. So in this Cowboys/Giants game from 2018, Dallas was down 35-28 with just over a minute to play when Dak Prescott threw a touchdown pass. After the play, the Cowboys went for 2 and converted, and won 36-35. But I am not crediting Prescott with a game-winning touchdown pass. Had Dallas been down 34-28 when Prescott threw his touchdown, he would receive credit for a game-winning touchdown pass assuming the Cowboys hit the ensuing extra point. Prescott in fact threw the game-winning 2-point conversion, but that is a separate category.
{ 0 comments }

Forgotten Stars: Jimmy Orr

Orr beats the 49ers for a touchdown.

Jimmy Orr played on the most star-studded offenses in NFL history. When you share an offensive huddle with five inner-circle Hall of Fame teammates — QB Johnny Unitas, WR Ray Berry, RB/WR Lenny Moore, OG Jim Parker, and TE John Mackey — you are going to be overshadowed.  Orr’s legacy has unfairly been limited to “that guy Earl Morrall missed on the flea flicker in Super Bowl III.” He played for the Baltimore Colts, a team in a time that is now a distant memory, cursed to playing second fiddle for both Colts fans and Marylanders.  So it is pretty easy to see how Orr has been forgotten over time,  especially given the lack of postseason success for his old Colts teams. [continue reading…]

{ 0 comments }

Seven years ago, I wrote about game-winning touchdowns.  A touchdown qualifies as a game-winning touchdown if all of the following four criteria are met:

  • It occurs in the 4th quarter or in overtime;
  • The scoring team was not winning prior to the touchdown
  • The scoring team was winning after the touchdown, including the extra point [1]However, if a team was down by 7, scored a touchdown, went for two and converted, that touchdown does not count as a game-winning touchdown.  So in this Cowboys/Giants game from 2018, Dallas was … Continue reading; and
  • If the touchdown (plus point after) gave the winning team more points than the losing team scored all game. So if a team is down 21-17 and scores a touchdown to go ahead 24-21, and that team ultimately wins 31-27, that does not count as a game-winning touchdown.  But if they win 31-21, it does.

Got it? Great.  I looked at all games, regular and postseason, in the NFL, AFL, and AAFC and counted all game-winning touchdowns by this metric.  As it was in 2013, Marcus Allen remains the all-time leader in game-winning touchdowns.  He had 10 game-winning touchdowns, in the following games: [continue reading…]

References

References
1 However, if a team was down by 7, scored a touchdown, went for two and converted, that touchdown does not count as a game-winning touchdown.  So in this Cowboys/Giants game from 2018, Dallas was down 35-28 with just over a minute to play when Cole Beasley caught a touchdown pass. After the play, the Cowboys went for 2 and converted, and won 36-35.  But I am not crediting Beasley with a game-winning touchdown catch.  Had Dallas been down 34-28 when Beasley caught his touchdown, he would receive credit for a game-winning touchdown assuming the Cowboys hit the ensuing extra point.
{ 0 comments }