≡ Menu

2015 NFL Predictions

Welcome back, NFL. With the NFL season finally here, I thought I would get in my pre-season predictions before it was too late. Prior to Thursday Night’s game between the Steelers and Patriots, I posted my predicted records for those two teams: 11-5 for New England, and 8-8 for Pittsburgh. But let’s run through my full standings, since, you know, these things are always so useful. [continue reading…]

{ 6 comments }

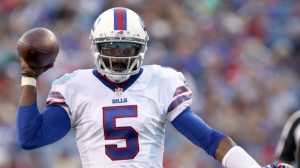
TTaylorTyrod Taylor was a sixth round pick of the Baltimore Ravens in 2011. Since then, he’s thrown just 35 passes over four years, before signing with the Bills as a free agent in the 2015 offseason. Now, after beating out Matt Cassel and EJ Manuel in training camp, Taylor will be the Buffalo Bills opening day starter in 2015.

How rare is this? Taylor was in the NFL for at least four seasons and never started a game in his NFL career; now he’s his team’s opening day starter. Since 1970, there are just four other quarterbacks who meet that profile. In reverse order… [continue reading…]

{ 14 comments }

WP: Pre-Week 1 – How Valuable Is An All-Pro Center?

This season, I will be writing weekly articles at The Washington Post. My first article looks at how valuable Maurkice Pouncey is to the Steelers.

Pittsburgh center Maurkice Pouncey suffered a severe lower leg injury in an Aug. 23 preseason game against the Green Bay Packers, landing the team’s top offensive lineman on the short-term injured reserve list, which will sideline him until at least Week 9, though the injury may keep him out for even longer. Given that the team once again figures to have one of the weaker defenses in the NFL, Pittsburgh’s playoff hopes rest on the offense performing at a peak level. So how much worse should we expect the Steelers offense to be without Pouncey?

The Steelers were very successful on offense in 2014, ranking among the top eight teams by most metrics, including traditional categories such as points, yards and first downs, as well as advanced tools, including Football Outsiders’ DVOA, and Advanced Football Analytics’ EPA model. One hidden reason for the team’s success on offense last year was great health: According to Football Outsiders, no offense lost fewer games to injury last year than Pittsburgh.

You can read the full article here.

{ 3 comments }

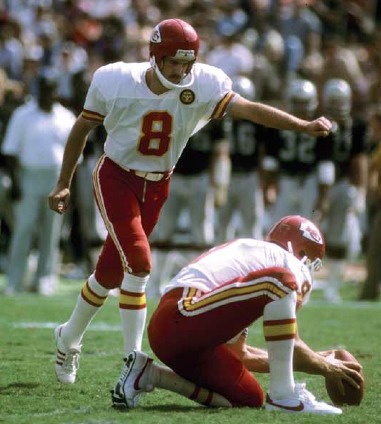
Nick the Kick

Nick the Kick

On Tuesday, I explained the formula used in my system of grading field goal kickers, which is based on field goal success rate adjusted for distance and era.  Yesterday, I looked at the single-season leaders using that methodology. Today, we look at the best field goal kickers since 1960 on the career level.

And frankly, it’s not much of a question as to who is the best kicker ever. Until presented with evidence to the contrary, that honor belongs to Nick Lowery (you can tell him about that here). The table below shows the top field goal kickers ever; let’s walk through Lowery’s line as an example.

Lowery played from 1978 to 1996. The length of his average field goal attempt was 36.6 yards, and the length of his average made field goal was 34.8 yards. Lowery attempted 479 field goals in his career; based on the distance of those kicks and the era in which he played, we would expect an average kicker to have made about 337.6 of those attempts. Instead, Lowery made 383 of them, a whopping 45.4 field goals above expectation. Thought of another way, Lowery’s expected field goal rate was 70.5%, while his actual was 80.0%, so he was successful an extra 9.5% of the time he lined up to kick. That’s remarkable. In short, Lowery was the most valuable field goal kicker in NFL history. [continue reading…]

{ 76 comments }

In 1983, there were 46 field goal attempts of 52 yards or longer. That year, just 17 of them were successful… and four of them came from Baltimore Colts rookie kicker Raul Allegre. But that’s just the highlight for perhaps the best kicking season ever.

During the Colts last year in Baltimore, fans voted Allegre the team’s most valuable player. And with good reason: Allegre attempted 35 field goals, but given the distances of those kicks and the kicking environment in 1983, we would have expected Allegre to make 21.2 of those attempts. Instead, Allegre connected on 30 field goals, giving him 8.8 more field goals above average. That’s the highest rate in any single season ever. Yesterday, I unveiled a methodology for ranking kickers, based on two factors: the length of each field goal attempts and the year in which they kick was attempted. Using that formula, I then was able to grade every field goal kicking season since 1960.

Let’s use Nick Lowery’s 1985 season to walk through the table below. That year, playing for the Chiefs, Lowery went 4/4 on kicks from 20-29 yards, 10/11 from 30-39 yards, 7/7 from 40-49 yards, and 3/5 from over 50 yards. (Note that while I have the data on the specific distance of each attempt, it made sense to present it for consumption in this way.) He attempted 27 kicks, and given the distances and the era, was expected to be successful on 17.2 of them. Instead, he made 24, giving him 6.8 field goals above average. If you prefer to think in terms of rates, Lowery was expected to be true on 63.7% of kicks, but actually made 88.9% of his attempts; that’s 25.2% above expectation, the highest rate by any kicker with at least 25 attempts. The table below shows the top 300 seasons since 1960: [continue reading…]

{ 13 comments }

Six years ago, I took my first crack at analyzing field goal kickers. I have been meaning to update that article for each of the last three offseasons, and with the sun setting on the 2015 offseason, I didn’t want to let this slip yet again.

Ranking field goal kickers is not difficult conceptually, but it can be a bit challenging in practice. One thing I’ve yet to refine is the appropriate adjustments for playing surface, stadium, time of game, temperature, and wind. That’s a lot of adjustments to deal with, all on top of the most obvious adjustment: for era.

But as I understand it, Rome was not built in a day; further, I believe that a journey of a thousand miles begins with one step. As a result, I’m okay with only getting part of the way there for now, and punting (which is very, very different from kicking) the rest of this process to next offseason.

Let’s begin with the obvious: era adjustments are really, really, important.  To provide some examples, I looked at the field goal rates at four different increments: 22-24 yard kicks, 31-33 yard attempts, kicks from 40-42 yards away, and finally, field goal attempts from 49-51 yards.  In the graph below, I’ve plotted the success rate at those four distances for each year since 1960, along with a “best-fit” curve at each distance. Take a look: [continue reading…]

{ 5 comments }

38 Questions: A Football Perspective Contest

Below you will find 38 pairs of numbers. In each case, you tell me which number will be bigger. One point for each correct answer. Most points wins.

Ties — and I expect there to be a nontrivial number of them — go to the side that had fewer votes. For example, here is a pair:

Number of wins by the Lions
Number of wins by the Ravens

Let’s say 41 people take the Lions and 54 take the Ravens. If the Lions and Ravens end up with the same number of wins, then each Lions-backer will get a point and each Ravens-backer will not.

GRAND PRIZE: the main prizes will be (1) honor and (2) glory. There will also be some sort of trinket to be named later. By the time this thing is over, more than five months will have passed, so that gives me some time to scrape something together. But you probably shouldn’t enter unless honor and glory are sufficient.

MORE RULES:

1. Everyone is limited to one entry per person. This will be enforced by the honor system. If caught breaking this rule, you, your children, and your children’s children will be banned from all future FP contests.

2. I won’t enter the contest myself, which will allow me to arbitrate any dispute impartially. Any ambiguities in the rules will be clarified by me in whatever way causes me the least amount of hassle.

3. While there are quite a few items that refer in some way to the NFL postseason, unless specifically stated, all the items below refer to regular season totals only. For example, here’s a pair:

Margin of the Titans biggest win.
Number of Passing TDs thrown by Marcus Mariota.

This one will be decided based on the Titans regular season and Mariota’s regular season numbers. I’d hate for there to be confusion when Tennessee wins a playoff game by 28.

4. If you try to get cute and complain that the Titans one-point win over the Colts was actually their “biggest win” even though it wasn’t their win with the biggest point margin, see rule #2. Ignoring your comment is generally my hassle-minimization strategy of choice.

5. You may enter until 1:00 p.m. Eastern time on Sunday, September 13th, 2015. However, you can earn a bonus of two (2) points if you enter before kickoff of Thursday’s game.

6. In the event that the contest ends in a tie, the winner will be the person whose entry was submitted first.

HOW TO ENTER: Cut-and-paste the list of questions below into your editor of choice, delete the choices you don’t like (thereby leaving the ones you do like), and then cut-and-paste your 38 answers into the comments of this thread. Do not worry about whether the players are linked to their PFR page or not. Please do not edit the text in any way other than deleting half of it. If you want to leave non-entry comments, you are free to do so either at the very end of your entry or in a subsequent comment, but please do not put commentary in the body of your entry. [continue reading…]
{ 99 comments }

2014 Defensive Adjusted Yards per Carry Data

A couple of weeks ago, I looked at the Adjusted Yards per Carry data for 2014 offenses; today, the same information but for the other side of the ball. As a reminder, here’s the formula for calculating Adjusted Yards per Carry:

Adjusted Rushing Yards per Carry = (Rush Yards + 11 * Rush TDs + 9 * Rush First Downs – Kneel Yards Lost ) / (Rushes – Kneels)

Let’s use the Detroit Lions defense as an example. The Lions faced 350 rush attempts last year and allowed 1,109 rushing yards and eight touchdowns. However, seven of those rushing attempts were actually kneels by the opponent (for -7 “rushing yards”), so we need to back those out of the data. The Lions also allowed 59 rushing first downs, or a first down on 17.2% of all carries. As a result, Detroit allowed 5.06 Adjusted Rushing Yards per Carry last year, the best rate in the NFL. The league average last year was 6.63, which means the Lions were over a yard and a half above average per carry. Multiply that difference by the 343 non-kneel runs that Detroit faced, and the Lions rush defense was 541 Adjusted Rushing Yards above average (here, negative is better), the top value-producing rush defense in the NFL in 2014. [continue reading…]

{ 1 comment }

Data Dump: Quarterback/Coach Pairs

Reading 538’s NFC East preview got me thinking about head coach and quarterback pairs. The Giants are currently enjoying a very long stretch of quarterback/coach consistency, but New York’s franchise history is filled with that sort of commitment. Washington, meanwhile, has not had one quarterback/coach combination reach five years together in 30 seasons!

So today, a quick data dump. Below are all instances where one coach and one quarterback were together for at least five seasons for each franchise. A quarterback gets credit for a season if he led his team in passing yards that year. For each team, I’ve listed the number of years the coach/quarterback were together in parentheses. [continue reading…]

{ 2 comments }

AV Retention Rates, 2013-2014

Change is inherent in the very fabric of the NFL. From year to year, little stays the same for most teams. But the team that changed the least from 2013 to 2014 was … the Dallas Cowboys?

There were six Dallas players who produced 12 or more points of Approximate Value last year: DeMarco Murray, Tony Romo, Tyron Smith, Dez Bryant, Zack Martin, and Travis Frederick. Of that group, all but Martin were key contributors in 2013, too. As measured by AV, the only big changes for the Cowboys were the losses of Jason Hatcher (8 points of AV in 2013), DeMarcus Ware (5) and Sean Lee (5). And other than Martin, the only notable players for the team last year that weren’t key parts of the team in 2013 were DE Jeremy Mincey, FS J.J. Wilcox, OLB Anthony Hitchens, ILB Rolando McClain, and DE Tyrone Crawford. And, perhaps, another reason the Cowboys may have appeared to have little turnover last year? Dallas generally stayed very healthy, which is one way of keeping the same players in the lineup year over year. [continue reading…]

{ 2 comments }

Bill Cowher And Coaches Retiring Early

It’s been nearly a decade since Bill Cowher stopped coaching, but that hasn’t done much to keep his name out of the rumor mill every December and January. After all, Cowher was both very successful and very young when he retired, and NFL folks believe those dots can be connected to mean he won’t stay retired forever.

That made me wonder: how much of an outlier is Cowher with respect to his age and how successful he was? In particular, Cowher was successful at the end of his stint, which differentiates him from someone like Jon Gruden. Defining “success” is challenging when it comes to coaches, but I want to just generate a set of comparable modern coaches and see how they fared at the ends of their careers and when they retired. I don’t need a particularly precise coaching formula, just something that gets the job done.

As it turns out, six years ago, I created a rudimentary formula to rank head coaching records. Let’s use Cowher’s last three years as an example. This formula gives credit for wins above losses, so Cowher gets a 0 for his work in 2006, his final year, when Pittsburgh went 8-8. The prior year, the Steelers went 11-5, so that’s +6, but I also gave a 12-point bonus for winning the Super Bowl, so he gets a +18 for that season. And in ’04, Pittsburgh went 15-1, so that’s +14. Add it up, and Cowher has a +32 score over his last 3 years. And he was just 49 years old during his final season. [continue reading…]

{ 13 comments }

Checkdowns: 538: NFC North Preview

Over at FiveThirtyEight, you can read my preview of the NFC North teams. Spoiler: the Bears are not very good at defense, the Lions are never very good at defense (except last year!), the Vikings are young but what does that mean?, and the Packers don’t acquire players from other teams.

Enjoy!

{ 2 comments }

Consecutive Week 1 Starting Quarterbacks

There are 12 starting quarterbacks in week 1 that were not week 1 starters last year. We can group them into a few buckets:

  • The Rookies: Jameis Winston and Marcus Mariota will be the week 1 starters for the two teams that went 2-14 last year.
  • The Returning Starters: Blake Bortles and Teddy Bridgewater, rookies last year, were not week 1 starters but the main quarterbacks for Jacksonville and Minnesota last year.  Cam Newton missed week 1 due to injury, but is obviously returning as Carolina’s franchise quarterback.  And in the continuing tire fire that is Washington football (both in general and as it specifically relates to RG3), Kirk Cousins will be the new starter in Washington over RG3.
  • The New Starters: Buffalo will have a new starter, with Tyrod Taylor beating out both Matt Cassel and EJ Manuel. Philadelphia and St. Louis traded quarterbacks, so Sam Bradford and Nick Foles will be new faces. In addition, the Browns (Josh McCown), Houston (Brian Hoyer), and the Jets (Ryan Fitzpatrick) added veteran quarterbacks in the offseason.

[continue reading…]

{ 6 comments }

Correlating Wins in Year N and Year N+1

There are many advanced projection systems that do a great job of projecting teams wins. I’m not interested in recreating that or coming up with my own system, but rather setting a baseline for what a projection system should hope to accomplish. You’ll see what I mean in a few moments.

Test #1: Every Team Is The Same

This is the simplest baseline: let’s project each team to go 8-8. If you did that in every season from 1989 to 2014, your model would have been off by, on average, 2.48 wins per team. This is calculated by taking the absolute value of the difference between 0.500 and each team’s actual winning percentage, and multiplying that result by 16. So that should be the absolute floor for any projection model: you have to come closer than that.

Test #2: Every Team Does What They Did Last Year

Looking at all teams from 1990 to 2014, I calculated their winning percentages in that season (Year N) and in the prior season (Year N-1). If you used the previous year’s record to project this year’s record, you would have been off by, on average, 2.84 wins per team. That’s right: you are better off predicting every team to go 8-8 than to predict every team to repeat what they did last season. [continue reading…]

{ 6 comments }

Most Memorable Plays For Each NFC Team

Yesterday, we looked at the most memorable plays for each AFC team. Today, we switch to the NFC, and let’s begin in the NFC East.

Dallas Cowboys: Emmitt Smith, with one good shoulder, runs for 10 yards to put Dallas in field goal range against the Giants in week 17, 1993

For a franchise with as proud a history as the Cowboys, there are some painful memories to consider: the Tony Romo bobbled snap against the Seahawks, Leon Lett against the Bills (and Dolphins), the ending of the Ice Bowl, the Tom Brown end zone interception of Don Meredith to clinch the 1966 NFL championship game, the Dez Bryant “incomplete” pass last year, and Jackie Harris starring in the Sickest Man in America.

But when it comes to the Cowboys, the mind immediately goes to the dynasty built in the ’90s. That team cemented its place in the game’s history by repeating as Super Bowl champions in 1993, and much of the credit for the title goes to winning in week 17 against the Giants. A loss in that game would have made the Cowboys a Wild Card team, while a win gave Dallas the number one seed. And that game turned out to be the most memorable of Emmitt Smith’s career. Playing much of the game on shoulder, he totaled a career high 41 touches. Here’s the play in question, and Smith carrying Dallas to victory that day remains the most iconic memory of one of the franchise’s greatest players. A close runner up: the original Hail Mary, from Roger Staubach to Drew Pearson against the vikings in the 1975 playoffs. But that game didn’t lead to a Super Bowl championship. [continue reading…]

{ 17 comments }

Most Memorable Plays For Each AFC Team

The other day, the Sporting News produced a slideshow of the most iconic plays in franchise history for each of the 32 teams in the NFL. That’s a fun idea, and something I think this community would enjoy thinking about, so I wanted to spend this weekend discussing what we view as the most memorable/iconic/incredible plays for each franchise. For each team, I’ll cast my opinion (which may or may not be the same as what the SN chose), but I’m really more interested in your thoughts. Today, we’ll do the AFC; tomorrow, the NFC. Let’s begin in the AFC East, with a franchise that’s most memorable play was probably a painful one.

Buffalo Bills: Scott Norwood, Wide Right, Super Bowl XXV [continue reading…]

{ 45 comments }

Why Do Teams Run The Ball, Part II

Seven and a half years ago, I asked the question, why do teams run the ball? Today, I want to revisit that post, given that a lot has happened over the last seven and a half years.

Let’s begin my analyzing league-wide pass and rush efficiency. To measure rush efficiency, we will use Adjusted Yards per Carry, which is calculated as follows:

(Rush Yards + 11 * Rush TDs + 9 * Rush First Downs) / (Rushes)

For passing, we will use a modified version of ANY/A by also giving credit for first downs. Here’s the formula:

(Gross Pass Yards – SackYardsLost + 11 * Pass TDs + 9 * Pass First Downs – 45 * INTs) / (Pass Attempts + Sacks)

[continue reading…]

{ 22 comments }

2014 Defensive Pass Identity Data

Yesterday, we looked at offensive Pass Identity grades. Today, we are going to use the same process to analyze the data for defenses.  Yesterday’s post is required reading to understand how Pass Identity grades are calculated, but here’s one update.  While we can use the same numbers for Game Script (including the 3.27 number for standard deviation and 0 for average), that’s not the case for defensive Pass Ratio. There, while the average is roughly the same at 58.29%, the standard deviation is much smaller at 2.84% (it was 4.66% for the offenses).

Let’s use the Lions as an example.  Detroit had an average Game Script of +0.4 last year, meaning the Lions were leading by, on average, 0.4 points during every second of every game.  That was 0.11 standard deviations above average. [continue reading…]

{ 4 comments }

Final 2014 Game Scripts and Pass Identity Data

As we did last year, today I’m going to calculate the final 2014 Game Scripts and Pass Identity data.  Every week during the season, I write about the Game Scripts from the previous weekend. For new readers, the term Game Script is just shorthand for the average points differential for a team over every second of each game. You can check out the updated Game Scripts page, which shows the results of all 256 games from 2014, and you can read the history behind the metric here.

Let’s begin by looking at the 2014 Game Scripts numbers. The Packers held an average lead of 6.9 points during their regular season games, the highest average in all of football. Because Green Bay was so good, Aaron Rodgers and the Packers weren’t very pass-happy; in fact, the Packers ranked just 21st in pass attempts. That’s why Jordy Nelson and Randall Cobb, as good as their raw numbers were, look even better in some advanced metrics. In some ways, the Packers were the victims of their own success last year, as Green Bay was — by far — the best first half team in the NFL in 2014. That led to the high Game Script number, and a lot of casual dress second halves. [continue reading…]

{ 5 comments }

Who Were The Best Punters In 2014?

Yesterday, I looked at a new way to measure punting statistics. Let’s review by using the top single performance from 2014, which surprisingly came from Jets second-year punter Ryan Quigley in a 31-0 loss to San Diego. Yes, the Jets were terrible, but that doesn’t mean it was Quigley’s fault! He had 8 punts, and all but 1 was an above-average punt. Let’s review:

  • Punt 1: Quigley punts from the Jets 39-yard line. On average, when a team punts at the 39, the opposing team takes over at the “78.9” yard line, which means just a hair in front of that team’s 21-yard line. Instead, Quigley pinned San Diego back to their 11; that 51-yard punt therefore provided 11.1 more yards of field position than we would expect.
  • Punt 2 was a 44-yard punt from the Jets 29. On average, punts from the 29 pin the other team back at their 29.7 yard line. The 44-yarder had no return, giving San Diego the ball at their 27, so Quigley added 2.3 yards of field position over average.
  • Punt 3 was from the Jets 20, so San Diego would have been expected to take over at their 38.4-yard line. Instead, following a whopping 64 yard punt, a 2-yard return, and 9-yard lost by San Diego due to an illegal block, and the Chargers were back at their own 9-yard line. That goes down as +20.4 for Quigley. Is it fair to give the punter credit when the return team loses yards on a penalty? I don’t know, although I’m not sure if that’s more or less fair than return yards that team gains (or yards the punting team loses due to a penalty). Think of these more as punt unit ratings than punter ratings, I guess.
  • Okay, even I don’t have the energy to go through all 8 punts.  But on the other 5, Quigley gained 16.8 yards over expectation, 11.9, 10.4, 10.2, and on one bad punt, -6.0.

[continue reading…]

{ 32 comments }

Yes, you read that title right. Not only is today about punters, guess what? Tomorrow will be, too. Today, I want to dive into punting statistics. The two key numbers the media focuses on with punters are usually net punting average and gross punting average. But both numbers are pretty heavily influenced by field position. [continue reading…]

{ 15 comments }

Pass Defense Heat Maps, 2002 to 2014

We spend a lot of time focusing on pass offenses, but not necessarily as much looking at the other side of the ball. After running my Rearview ANY/A numbers, it struck me just how bad Washington’s pass defense was last year. And if it feels like that team has struggled against the pass for awhile, well, that’s because it has. Over the last five years, there’s been no worse pass defense in the NFL.

As regular readers know, ANY/A stands for Adjusted Net Yards per Attempt, which is Yards per Attempt with a 45-yard penalty for interceptions, a 20-yard bonus for passing touchdowns, and includes sack data. Relative ANY/A simply subtracts the league average ANY/A from each team’s individual ANY/A. Last year, Washington’s pass defense allowed 7.88 ANY/A while the league average was 6.14; as a result, the team’s pass defense had a RANY/A of -1.7. In fact, the team’s defense has had a negative RANY/A in each of the last five years. [continue reading…]

{ 4 comments }

Footballguys.com – Why Subscribe?

Regular readers know that I’m one of the writers at Footballguys.com. If you are a hardcore fantasy footballer (or daily fantasy sports player), you probably already know that Footballguys.com is the single best source for fantasy football information. If you are a more casual fantasy football player, you’ll find that the tools available at Footballguys will make life much, much easier for you to win your league(s). Either way, I think a Footballguys Insider PRO subscription is a fantastic value for $32.95. Also fantastic values: the Footballguys Draft Dominator for mobile devices, which costs $4.99.

I don’t make extra money if more people sign up for Footballguys or buy an app, but I hope my readers subscribe because I think a subscription is a really good deal. If you play fantasy football and want to win your competitive league or save hours doing research for your local league, a Footballguys subscription is well worth it. For $32.95, you get: [continue reading…]

{ 1 comment }

As I did last year, I want to analyze the rushing stats for each team in 2014 using a metric known as Adjusted Rushing Yards per Carry. Thanks to the help of Brian Burke of Advanced Football Analytics (formerly Advanced NFL Stats), we were able to conclude that the value of a first down was about 9 yards. And since we’ve previously determined that the marginal value of a touchdown is 20 yards, this means Adjusted Rushing Yards per Carry is pretty easy to calculate. Also, since Bryan Frye crunched the numbers, we might as well exclude all kneels from the process, too.

One thing to keep in mind (which I have forgotten in the past): since the NFL records-keeping process labels touchdowns as first downs, you should only assign 11 yards per touchdown if you are already giving 9 yards to all 1st downs. And since kneels are marked down as runs, you must back those out, too. As a result, here’s the formula to use:

Adjusted Rushing Yards per Carry = (Rush Yards + 11 * Rush TDs + 9 * Rush First Downs – Kneel Yards Lost [1]Since this is a negative number — i.e., 10 kneels for -11 yards — we need to subtract kneel yards to turn those yards into an add back in the numerator. ) / (Rushes – Kneels)

If we use this metric to analyze the 2014 season, how would it look? Seattle was by far the top rushing team in the NFL last year, rushing for 2,762 yards and 20 touchdowns on 525 carries, good for a 5.26 yards per carry average. But 19 of those 525 carries were kneels, and they went for -20 yards. In addition, Seattle not only led the league with 144 rushing first downs, the Seahawks gained a first down on 28.5% of non-kneel carries, also the highest mark in the NFL. Seattle averaged 8.49 Adjusted Rushing Yards per Carry, while the NFL average was 6.63. Since the Seahawks averaged 1.86 ARY/C over average for 506 non-kneel carries, that means Seattle rushed for 941 rushing yards (1.86 * 506) above average.

The full list for all 2014 teams, below: [continue reading…]

References

References
1 Since this is a negative number — i.e., 10 kneels for -11 yards — we need to subtract kneel yards to turn those yards into an add back in the numerator.
{ 10 comments }

On Monday, I looked at the SOS-adjusted Adjusted Net Yards per Attempt ratings of every quarterback and defense in the NFL in 2014. And just like last year, I want to follow that post by looking at the best and worst games of the year, from the perspectives of both the quarterbacks and the defenses.

Let’s start with the top 100 passing games from 2014. The top spot belongs to Ben Roethlisberger, for his scorched-earth performance against Indianapolis. The Steelers star threw for 522 yards and 6 touchdowns on just 49 pass attempts with no sacks or interceptions. For the game, that means Roethlisberger averaged 13.10 ANY/A. The league-average last season was 6.13 ANY/A, which means Roethlisberger was 6.97 ANY/A above average. Now since the game came against a Colts team that was 0.28 ANY/A worse than average last year, we have to reduce that by the same number. That puts Roethlisberger at 6.70 ANY/A above expectation; multiply that by his 49 dropbacks, and he produced 328 adjusted net yards of value above average after adjusting for strength of schedule. That was easily the top game of 2014. [continue reading…]

{ 2 comments }

Best Quadruplets in NFL History (Single-Season)

The ’90s Cowboys had the Triplets — Troy Aikman, Emmitt Smith, and Michael Irvin — that helped define the team’s dynasty. Well, the modern Packers have not just an outstanding quarterback, a great running back, and one excellent wide receiver: they have two excellent wide receivers.

Let’s take some “basic” stats and see how the 2014 Packers fared:

  • To measure quarterbacks, let’s use Adjusted Net Yards per Attempt. Aaron Rodgers ranked 1st in ANY/A last year.
  • To measure running backs, we can use the most basic measurement out there: rushing yards. Eddie Lacy ranked a respectable 7th in rushing yards.
  • To measure wide receivers (and tight ends), let’s use Adjusted Catch Yards, which is receiving yards with a 5-yard bonus for receptions and a 20-yard bonus for receiving touchdowns. Jordy Nelson ranked 3rd in ACY last year, while Randall Cobb ranked 8th.

Where does that rank since 1970? Well, one thing we could do is just add the ranks: 1 + 7 + 3 + 8 = 19. That’s a pretty good score for a group of four players, but it’s not the best ever. It’s tied with two other teams for 6th best ever. Can you guess which team since 1970 has the best score using this methodology? While you think about it, let’s look at the other teams to produce a score of less than 20. [continue reading…]

{ 57 comments }

2014 Rearview Adjusted Net Yards per Attempt

Every year at Footballguys.com, I publish an article called Rearview QB, which adjusts the fantasy football statistics for quarterbacks (and defenses) for strength of schedule. I’ve also done the same thing for years (including last season) using ANY/A instead of fantasy points, which helps us fully understand the best and worst real life performances each year. Today I deliver the results from 2014.

Let’s start with the basics. Adjusted Net Yards per Attempt is defined as (Passing Yards + 20 * Passing Touchdowns – 45 * Interceptions – Sack Yards Lost) divided by (Pass Attempts plus Sacks). ANY/A is my favorite explanatory passing statistic — it is very good at telling you the amount of value provided (or not provided) by a passer in a given game, season, or career.

Let’s start with some basic information. The league average ANY/A for quarterbacks in 2014 was 6.13, the highest in NFL history. Aaron Rodgers led the way with a 8.65 ANY/A average, the highest rate in the league among the 39 quarterbacks who started at least five games. Since the Packers quarterback had 520 pass attempts and was dropped for 28 sacks, that means he was producing 2.52 ANY/A (i.e., his Relative ANY/A) over league average on 548 dropbacks. That means Rodgers is credited with 1,383 Adjusted Net Yards above average, a metric labeled “VALUE” in the table below. That was the most in the NFL last year: [continue reading…]

{ 12 comments }

Back in December 2009, Jason Lisk wrote about a recent trend in the NFL: quarterbacks throwing for 300 passing yards and actually winning. Jason wondered whether that was something fluky, or a sign of the shifting nature of the NFL. With the benefit of hindsight, I think the answer is…. well, I think it’s pretty clear.

Including playoffs, quarterbacks who threw for 300+ yards in a game during the 2009 season won an incredible 63.3% of games. And that mark remains the highest in modern history. Over the last five years (2010 to 2014), quarterbacks have won 52% of games when cracking that mark; during the decade of the ’90s, quarterbacks won 53% of their games when throwing for 300+ yards.

Of course, the likelihood of a quarterback throwing for 300+ yards has increased significantly. Over the last four years, quarterbacks have thrown for 300+ yards in 25% of all games, an enormous increase relative to most of NFL history. The graph below shows both pieces of information: in blue, and measured against the left Y-Axis, shows winning percentage by year when a quarterback throws for 300+ yards; in red, and against the right Y-Axis, is the percentage of all games where a quarterback hit the 300+ yard mark: [continue reading…]

{ 20 comments }

2014 Offensive Lineman and NFL Draft Value

You probably don’t think of the St. Louis Rams as a team that’s built along the offensive line. And for good reason: according to Pro Football Focus, St. Louis ranked 30th in pass blocking and 29th in run blocking in 2014. Football Outsiders also ranked the Rams offensive line in the bottom five in both power rushing and stuffed rates. But the Rams struggles on the offensive line are not for a lack of acquiring highly-drafted linemen.

Let’s put aside the selection of Jason Smith with the second overall pick of 2009, who would presumably be in the prime of his career right now had he not been a bust. Because even without him, no offensive line had as strong a pedigree in 2014 as the Rams.

  • At left tackle, Jake Long started 7 games; Long was the first overall pick in the ’08 Draft, albeit by the Dolphins. The other nine games were started by Greg Robinson, taken by St. Louis with the second overall pick in the 2014 Draft.
  • The left guard spot generally belonged to Rodger Saffold (who started 16 games), taken by St. Louis with the 33rd overall pick in 2010.
  • Center was manned by Scott Wells, the 251st pick by the Packers way back in 2004.
  • At right guard was Davin Joseph for 13 games, the 23rd pick in 2006 by the Bucs. The other three games were started by Saffold, and during those games, Robinson moved into the left guard spot during (with Long sticking at left tackle).
  • At right tackle was Joe Barksdale for all 16 games. Barksdale was the 92nd pick in the draft in 2011 by the Raiders.

[continue reading…]

{ 5 comments }

Data Dump: Defensive Points Allowed SRS

Today’s guest post/contest comes from Thomas McDermott, a licensed land surveyor in the State of California, a music theory instructor at Loyola Marymount University, and an NFL history enthusiast. As always, we thank him for his hard work.


In a previous post, I provided SRS-style ratings for all offenses since 1970, using only points scored by the actual offense (including field goals). Today, I’ll do the same thing for defenses – meaning, of course, our “metric” will be points allowed only by the actual defense. [1]To quickly recap: SRS ratings for offense (OSRS) and defense (DSRS) on PFR’s website include points scored by the defense and special teams. To get a more accurate points-based evaluation of … Continue reading

Here’s how to read the table below: in 1970, the Vikings allowed 10.2 points per game, 8.2 of which came from touchdowns and field goals allowed by the defense. This leaves 2.0 PPG scored by their opponent’s defense or special teams (i.e., due to Minnesota’s offense or special teams). [2]In this case, it was the result of three touchdowns off of offensive turnovers and one on special teams, as highlighted by Chase in this post on estimated points allowed per drive. Their 8.2 Def PA/G was 9.5 points better than league average; after adjusting for strength of opponent, their rating remains at 9.5. Their overall points allowed SRS rating (DSRS) is 9.2, meaning PFR’s defensive SRS rating undersells them by 0.3 points. [continue reading…]

References

References
1 To quickly recap: SRS ratings for offense (OSRS) and defense (DSRS) on PFR’s website include points scored by the defense and special teams. To get a more accurate points-based evaluation of offenses and defenses, I weeded these scores out and reran the iterations. I didn’t note this last time, but for those interested: the numbers used do not include any home field advantage adjustment or a cap on blowout point differentials.
2 In this case, it was the result of three touchdowns off of offensive turnovers and one on special teams, as highlighted by Chase in this post on estimated points allowed per drive.
{ 9 comments }