≡ Menu

Bryan Frye, owner and operator of the great site http://www.thegridfe.com, is back for another guest post. You can also view all of Bryan’s guest posts at Football Perspective at this link, and follow him on twitter @LaverneusDingle.


On Monday, I looked at which quarterbacks since 1960 helped or hurt their teams the most by taking or avoiding sacks. On Tuesday, I looked at the quarterbacks who gained the most or fewest yards through the air per attempt or dropback, and on Wednesday, we looked at completions relative to league average. Yesterday, the metric of the day was touchdown pass rate.

As promised, this article, “Dr. Safelove or: How I Learned to Start Worrying and Fear the Bomb,” centers on interceptions. The methodology here is no different from before: Figure out each player’s rate stats relative to the average of the rest of the league minus that player (LMP) that year and multiply it by his attempts to find the marginal total.

The caveat for this article is a big one: it is mathematically impossible for modern players to rank highly on a per play basis. In 1945, Sammy Baugh threw interceptions at a rate 7.4% lower than his peers. Because the league average today is so low (about 2.5%), a current quarterback would have to throw negative interceptions to match a -7.4% relative pick rate. Even if a quarterback threw 700 passes without an interception, the best he could possibly do is about -2.5%. [continue reading…]

{ 25 comments }

Bryan Frye, owner and operator of the great site http://www.thegridfe.com, is back for another guest post. You can also view all of Bryan’s guest posts at Football Perspective at this link, and follow him on twitter @LaverneusDingle.


On Monday, I looked at which quarterbacks since 1960 helped or hurt their teams the most by taking or avoiding sacks. On Tuesday, I looked at the quarterbacks who gained the most or fewest yards through the air per attempt or dropback. And yesterday, we looked at completions relative to league average.

Today’s article, “Mile High Club or: Scoring through the Air,” is an examination of how often quarterbacks threw touchdowns. [1]Note that I didn’t say “how well quarterbacks threw touchdowns.” A screen with 80 YAC, a bomb to a wide open speedster, and a missile into tight coverage all count for six on the stat sheets.

I have used the same methodology as before (similar to Chase’s model for Relative Adjusted Net Yards), and I have maintained the same minimum attempt cutoffs. That means we’ll only look at seasons with 224 or more attempts and careers with 1,000 or more attempts. Like before, I didn’t prorate for shorter seasons. [2]Feel free to copy the table and make your own spreadsheet if you’d like. Or don’t. I’m not going to tell you how to live your life. [continue reading…]

References

References
1 Note that I didn’t say “how well quarterbacks threw touchdowns.” A screen with 80 YAC, a bomb to a wide open speedster, and a missile into tight coverage all count for six on the stat sheets.
2 Feel free to copy the table and make your own spreadsheet if you’d like. Or don’t. I’m not going to tell you how to live your life.
{ 14 comments }

Bryan Frye, owner and operator of the great site http://www.thegridfe.com, is back for another guest post. You can also view all of Bryan’s guest posts at Football Perspective at this link, and follow him on twitter @LaverneusDingle.


On Monday, I looked at which quarterbacks since 1960 helped or hurt their teams the most by taking or avoiding sacks. Yesterday, I looked at the quarterbacks who gained the most or fewest yards through the air per attempt or dropback. As you may have guessed, I’m keeping the theme going today. This article, “Sharpshooters or: Quarterbacks who were Good at Completing Passes,” is an examination of how passers stacked up statistically against their peers in the not-super-important category of completion rate. [continue reading…]

{ 20 comments }

Bryan Frye, owner and operator of the great site http://www.thegridfe.com, is back for another guest post. You can also view all of Bryan’s guest posts at Football Perspective at this link, and follow him on twitter @LaverneusDingle.


Yesterday, I looked at which quarterbacks since 1960 helped or hurt their teams the most by taking or avoiding sacks. In this post, “Frequent Flyers or: Quarterbacks who Gained Yards through the Air,” I’ll do something similar but with passing yards instead of sacks.

Because we have the necessary passing stats dating back to 1932, I can take this study back nearly three decades further than the previous one. However, I will use Chase’s estimated sack statistics to examine net yards for all post-1960 quarterbacks.

The math is simple: for each player, subtract his individual raw totals from those of every other quarterback in the league to find the league minus player (LMP) Y/A or NY/A. Next, subtract the LMP rates from the individual player rates to find each player’s marginal rate stats. Last, multiply each quarterback’s marginal Y/A by his attempts (or marginal NY/A by his dropbacks) to find marginal yards (or marginal net yards). [1]It took as much time to explain as it did to set up in Excel.

Enough explanation – Let’s look at some stats. The first table displays the 1,563 qualifying QB seasons, sorted by marginal yards. Read it thus: In 2001, Kurt Warner threw 546 passes for 4,830 yards, giving him 8.85 Y/A. The average of the rest of the league was 6.69, so Warner had a marginal Y/A of 2.15. This means his 2001 season is worth 1,176 yards above expectation. [continue reading…]

References

References
1 It took as much time to explain as it did to set up in Excel.
{ 55 comments }

Bryan Frye, owner and operator of the great site http://www.thegridfe.com, is back for another guest post. You can also view all of Bryan’s guest posts at Football Perspective at this link, and follow him on twitter @LaverneusDingle.


Last Wednesday, Chase unveiled his estimated sack numbers for 1960-1968. [1]I can neither confirm nor deny that he did this, at least in part, to give Joe Namath some love. I already had this post planned, but I wanted to wait for the estimated stats before running the numbers, as doing so would allow me to go back to 1960 instead of 1969.

This article, “Upright Citizens (Quarterbacks who Avoided Sacks)” is a brief examination of those quarterbacks who saved their teams valuable field position by avoiding sacks. By extension, it is also an examination of those quarterbacks who did the opposite. When Chase presented his 1960-1968 data, he included everyone who threw a pass during that timeframe. Because I am only concerned with quarterbacks, I have removed all non-quarterback plays and recalculated the metrics. [continue reading…]

References

References
1 I can neither confirm nor deny that he did this, at least in part, to give Joe Namath some love.
{ 21 comments }

Grouping Players Into Attackers and Mitigators: Part I

I’ve been reading Chris Brown’s excellent new book, The Art of Smart Football. One of the passages in Brown’s book about legendary head coach Sid Gillman stood out to me:

Realizing that a football field is nothing more than a 53⅓-yard-wide geometric plane, Gillman designed his pass patterns to stretch defenses past their breaking points. His favorite method was to divide the field into five passing lanes and then allocate five receivers horizontally in each one. Against most zones, at least one receiver would be open.

Below is an example of what Gillman was referring to: [1]While I couldn’t find the exact picture Chris used in the book, this one illustrates the same concept. you can see that, horizontally, one target will end up in each fifth of the field:

When it comes to pass patterns, the receivers are the players on the attack, and there’s a relatively wide variance in how effective a receiver can be (i.e., he can get open all the time, some of the, none of the time, etc.). But the players in pass coverage should be viewed in a different way: all they can do is mitigate the player in front of them. [continue reading…]

References

References
1 While I couldn’t find the exact picture Chris used in the book, this one illustrates the same concept.
{ 9 comments }

At the start of the new season, every team has hope. Well, just about every team. And that made me wonder: how did Super Bowl champions look in the year before winning the Super Bowl?

The Jets were at -5.0 in the SRS last year: has any team ever been that bad (or worse) and won the Super Bowl the next season? Why yes, one — and only one — team has. The graph below shows the SRS ratings of each Super Bowl champion in the year before they won the Super Bowl. Note that I’m still using the Super Bowl year in the graph below, so if you go to 1972, you’ll see the 1971 Dolphins’ SRS. [continue reading…]

{ 2 comments }

Football Outsiders Almanac 2015

If you’re reading this blog, chances are you already know all about our friends at Football Outsiders and the terrific analysis they provide every year. However, if by some chance you don’t know of them, or maybe you haven’t heard about their outstanding annual book, they now have copies of the 2015 Football Outsiders Almanac available for purchase. The book is jam-packed with FO’s signature data (including game-charting stats), plus the usual stat-geeky essays, team and player previews, and 2014 projections. And it’s not just the NFL, as Football Outsiders has some pretty sharp minds (Matt Hinton, Bill Connelly, Brian Fremeau) covering the college game, too.

Football Outsiders has been a supporter of Chase Stuart for a while and Football Perspective from the beginning. But don’t confuse this for charity post: the FOA is a great guide, and I’m sure anyone who buys it will be very happy. Here’s the link:

http://www.footballoutsiders.com/store

After working on the Almanac for the past two years, due to time constraints, I wasn’t able to contribute in 2015. But I am still happy to endorse one of the most thorough football products produced every year.

{ 0 comments }

Today’s guest post/contest comes from Thomas McDermott, a licensed land surveyor in the State of California, a music theory instructor at Loyola Marymount University, and an NFL history enthusiast. As always, we thank him for his hard work.


When looking at teams’ offensive SRS ratings (OSRS) on PFR, we know that those number also include points scored by the defense and special teams – punt and kick return touchdowns, interception and fumble return touchdowns, return scores on blocked punts and field goals, and safeties. This makes OSRS not as accurate a point-based rating of the offense “proper” as it could be. But, considering those “non-offense” types of scores make up a small fraction of a team’s overall points scored in a season (the average is around 8% since 1970), we can generally ignore this “hiccup” in the system.

Well, most of us can ignore it; for some reason, I cannot! My curiosity has gotten the better of me, so I decided to run offensive and defensive SRS ratings for each team since the merger, using only points that we would normally credit the offense for scoring (or the defense for allowing) – passing and rushing touchdowns, and field goals. [1]I have to assume that at some point Chase or one of the guys at PFR has run the numbers for “SRS without special teams/defense scores”, but I have yet to find it.

As the title states, this is a data dump; I’m hoping that readers of this site will find the info useful for their own research or general interest. Today, we’ll just look at the offense, I’ll post the numbers for defense in a follow-up post. [continue reading…]

References

References
1 I have to assume that at some point Chase or one of the guys at PFR has run the numbers for “SRS without special teams/defense scores”, but I have yet to find it.
{ 3 comments }

You remember the November 20th game between the Bears and Lions in 1960, right? If you look at the boxscore on PFR, you will see that Detroit quarterback Jim Ninowski was 10 for 26 for 121 yards with 0 touchdown passes and 2 interceptions. You’ll also see that the Lions as a team went 10 for 26 for 121 yards with 0 touchdown passes, 2 interceptions, and 12 sacks for 107 yards. But the PFR boxscore does not indicate how many sacks Ninowski took that game, because the individual game log data wasn’t kept on that metric.

But, you know, I’m a pretty smart guy. I have a feeling that Ninowski was probably sacked 12 times in that game for 107 yards. I could be wrong, of course — maybe a backup came in and took two dropbacks, and was sacked on both of them — but it seems like making a good faith effort here is better than ignoring it completely. [continue reading…]

{ 10 comments }

Through 48 starts, Russell Wilson has been pretty darn good. Since Wilson entered the league, he ranks 5th in ANY/A and tied for 2nd in wins. The idea of measuring quarterback by wins is a curious one, especially in the case of Wilson, who has benefited from a historically dominant defense. No, Wilson is not a great quarterback because his team has won 36 games over the last three years.

On the other hand, analysts can go too far in the other direction. For example, among the 31 quarterbacks to play in 24 games and throw 500 passes since 2012, Wilson ranks just 24th in passing yards per game. Some could use that statistic, or another variation, to argue that Wilson hasn’t been responsible for much of his team’s success. But that ignores that Wilson leads all quarterbacks in rushing yards since 2012, and ranks 3rd among those 31 quarterbacks in rushing yards per game. It also ignores the fact that Seattle has run the 5th fewest plays of any team over the last three years.

So how about this stat: over the last three years, Wilson has been responsible for two-thirds of all Seahawks yards. How does that compare to other quarterbacks through 48 starts? And how many wins did those quarterbacks have? [continue reading…]

{ 70 comments }

Implied SRS NFL Ratings For 2015

In each of the last two years, I’ve derived implied SRS ratings for NFL teams based on the Vegas point spreads (I also do the same for college football teams). Well, in late April, CG Technology released lines for 238 NFL games. Things have changed since late April, of course, but for now, let’s work with that data.

For the third straight year, Seattle, Denver, New England, and Green Bay are ranked among the top five teams in the NFL. And before you ask, yes, we will get to the Tom Brady issue in a few moments. The Seahawks are underdogs in just one game this year, and even in that game, Seattle is a just 1-point underdog in Green Bay. The Packers are underdogs in just one game, too: Green Bay is a 1.5-point underdog during a week 8 trip to Denver. On the other side, the Raiders aren’t favored in a game all year: the closest is a pick’em when the Jets come to Oakland.

As a reminder, we can use the Simple Rating System to take all 238 point spreads and derive ratings. But as a sign of how good Vegas viewed Seattle, consider these four Seahawks road lines: [continue reading…]

{ 13 comments }

Last weekend, we looked at the league-average ratios between receiving yards and touchdowns, and which players scored far more touchdowns than we would expect. Today, we do the same but for rushing yards.

For whatever reason, Jerome Bettis’ 2005 has become etched in the memories of many folks. That year, he rushed for 368 yards and 9 touchdowns. Back in ’05, the NFL average was 133.6 rushing yards per rushing touchdown. So we would expect Bettis, with 368 rushing yards, to rush for 2.8 touchdowns. That means Bettis actually rushed for 6.2 more touchdowns than we would “expect” given his rushing total. [continue reading…]

{ 15 comments }

Checkdowns: Top Receiving Seasons By Age

On Thursday, I spent some time looking at the underrated career of Joey Galloway. After playing with bad quarterbacks most of his career, Galloway finally broke out with some of the best seasons of his career with Jon Gruden and the Bucs. In fact, Galloway set his career high in receiving yards at age 34, which is pretty rare. [continue reading…]

{ 1 comment }

ESPN’s Total QBR: Updated For 2015

Earlier this week, ESPN announced three key changes to the way its Total QBR metric is calculated. Let’s review them:

1) Interception returns

The base statistic used throughout QBR is EPA, which stands for Expected Points Added per play. So if an interception was returned for a touchdown, that play would obviously have a large negative EPA. For example, when the Chargers had 3rd-and-8 at the St. Louis 8-yard line in the 2nd quarter of a game in week 12 of last season, PFR calculated the Expected Points for that situation as +3.58 for San Diego. When Rivers threw a pick-6 on that play, that situation turned into a -7, which is a swing of 10.58 points. Presumably ESPN’s formula came to a pretty similar result.  And that leaves Rivers with an enormous penalty.

So now, instead of penalizing the quarterback for the actual EPA swing, ESPN will penalize the quarterback for the expected swing based on the type and location of the interception.  This means much smaller penalties on pick sixes, and (one would assume) slightly larger ones on all other interceptions.

This makes sense to me, although it highlights the question of what is QBR actually supposed to measure.  This change, while eliminating some of the randomness involved in a play, moves away from the way QBR has been tied to EPA. On some (though not all) interceptions, whether a player returns it 90 yards or 10 yards is completely random, so penalizing a quarterback a fixed amount (that varies by type and location) is likely going to improve the predictability of the model. What I mean by that is that QBR will become “stickier” from time period to time period, which is a good thing (if you like predictive models). [continue reading…]

{ 46 comments }

On Tuesday, I looked at which receivers produced the most Adjusted Catch Yards over the baseline of worst starter. Yesterday, I used that data to help identify which receivers produced their numbers in the most pass-happy offenses. Today, instead of measuring wide receivers by how often their teams passed, I want to measure them by how well they passed.

Some teams are very efficient at passing because they have great wide receivers: to be clear, today’s post doesn’t prove anything about which way the causation arrow runs. But I do think it’s worth quantifying the reality that receivers produce their numbers in very disparte environments. Let’s use Joey Galloway as an example. Galloway, longtime readers will recall, was a favorite of an early iteration of Doug Drinen’s attempts at ranking wide receivers. For similar reasons, Galloway comes out “very good” in this system, if good means producing numbers while playing for bad passing offenses (a proxy, one could argue, for playing with bad quarterbacks).

Galloway produced 2,071 Adjusted Catch Yards above the baseline in his career, good for an unremarkable 84th place on Tuesday’s list. But let’s look at the 8 seasons that get Galloway there: [continue reading…]

{ 11 comments }

Yesterday, I looked at which receivers produced the most Adjusted Catch Yards over the baseline of the worst starter. Today, I want to use that data to help identify which receivers put up their numbers in the most pass-happy offenses.

Let’s use Calvin Johnson as an example. He’s been with the Lions for each season of his career, and Detroit has been very pass-happy throughout his career. Last year, Detroit averaged averaged 40.56 dropbacks (pass attempts plus sacks) per game, while the league average was 37.29 dropbacks per game. So Detroit passed 108.8% as often as the average team.

In 2013, Detroit’s ratio to the league average was 108.2%, but it was 129.8% in 2012. To measure pass-happiness as it pertains to Johnson, we can’t just take Detroit’s average grade from ’07 to ’14; instead, we need to assign more weight to Johnson’s best years. Johnson gained 1,358 ACY over the baseline in 2012, which represents 29% of his career value of 4,721 ACY over the baseline. As a result, Detroit’s 129.8% ratio in 2012 needs to count for 29% of Johnson’s career pass-happy grade.

If we do this for each of the players in yesterday’s top 100, here are the results. [continue reading…]

{ 13 comments }

Brown stuck the lanning.

Brown stuck the lanning.

Adjusted Catch Yards are simply receiving yards with a 5-yard bonus for each reception and a 20-yard bonus for each receiving touchdown. In 2014, Antonio Brown led the NFL with 2,603 Adjusted Catch Yards, the 5th highest total in NFL history. That was the result of a whopping 129 receptions for 1,698 receiving yards (both of which led the league) and 13 touchdowns.

Brown was dominant in 2014, and he led the NFL in more advanced systems, too. But today, I wanted to do something relatively simple. How do we compare Brown’s 2014 to say, three Packers greats from years past?

In 1992, Sterling Sharpe had 108 catches for 1,461 yards and 13 touchdowns. Those are pretty great numbers for 1992, although they don’t leap off the page the way Brown’s 2014 stat line does. If we go back farther, Billy Howton in 1956 had 55 receptions for 1,188 yards and 12 touchdowns. Like Brown, that was good enough to lead the NFL in two of the three major categories, and rank 2nd in the third. And 15 years earlier, Don Hutson caught 58 passes for 738 yards and 10 touchdowns. How do we compare that statline to Brown’s?

Here’s what I did.

1) Calculate each player’s Adjusted Catch Yards. For Brown, that’s 2,603. For Sharpe, Howton, and Hutson, it’s 2,261, 1,703, and 1,228, respectively.

2) Next, calculate the Adjusted Catch Yards for every other player in the NFL. Then, determine the baseline in each year, defined as the number of ACY by the Nth ranked player, where N equals the number of teams in the league. For Brown, that means using 1,398 Adjusted Catch Yards, the number produced by the 32nd-ranked player in ACY in 2014. For Sharpe, we use 1,078 ACY, the number gained by the 28th-ranked player in ’92. For Howton, it’s just 797, the number of ACY for the 12th-ranked player (keep in mind that ’56 was a very run-heavy year). And finally, for Huston, we use the 10th-ranked player from 1941, who gained only 413 Adjusted Catch Yards.

3) Next, we subtract the baseline from each player’s number of Adjusted Catch Yards. So Brown is credited with 1,205 ACY over the baseline, Sharpe gets 1,183 ACY over the baseline, Howton is 906 ACY over the baseline, and Hutson is 815 ACY over the baseline.

4) Finally, we must pro-rate for non-16 game seasons. For Brown and Sharpe, we don’t need to do anything, so Brown wins, 1,205 to 1,183. Howton played in a 12-game season, so we multiply his 906 by 16 and divide by 12, giving him 1,208 ACY, narrowly edging Brown. And in 1941, the NFL had an 11-game slate; multiply 815 by 16 and divide by 11, and Hutson is credited with 1,185 ACY.

As you can see, it wasn’t a coincidence I chose those three Packers seasons to compare to Brown. Those four seasons are the 19th-through-22nd best seasons of all time by this metric, and stand out as roughly equally dominant for their eras (both Sharpe and Hutson won the triple crown of receiving in their years).

This is not my preferred method of measuring wide receiver player, but it’s my favorite “simple” one. I put simple in quotes, of course, since there’s a lot of programming power behind generating these numbers. But at a high level, it’s simple: we combine the three main receiving stats into one, we adjust for era because the game has changed so much, and we pro-rate for years where the league didn’t play 16 games. Nothing more, nothing less. [continue reading…]

{ 29 comments }

The Golden Nugget has released point spreads for a large number of college football games.  And these spreads can tell us a lot about how Vegas views these teams.  That’s because, for the most part, the spreads are consistent.

Let’s look at Ohio State, the defending national champions and a team the Golden Nugget released lines for four games. The Buckeyes are 14-point home favorites against Michigan State, 16-point road favorites against Michigan, 19-point home favorites against Penn State, and 16-point road favorites against Virginia Tech. So how good is Ohio State? Well, that depends on how good Michigan State, Michigan, Penn State, and Virginia Tech are. As it turns out, those teams aren’t half bad, so Ohio State must be really, really good. Let’s ignore the games where two of Michigan State, Michigan, and Penn State play each other (since that won’t tell us much about Ohio State), and look at the rest:

  • Michigan State is a 6-point road favorite in Nebraska and a 1-point home favorite against Oregon. This would imply that Ohio State is about 9 points better than the Ducks [1]Michigan State would be viewed as 2 points worse on a neutral field than Oregon, while being 11 points worse than Ohio State on a neutral field., an annual college football contender.
  • The only non-Big 10 game for Penn State where a line was released was Penn State -28 against Army.
  • Michigan is a 33-point home favorite against UNVL, a 4-point road dog against Utah, a 14-point home favorite against Oregon State, and a 7-point home favorite against BYU. The Wolverines aren’t great, but remember that Ohio State is favored by 16 against them in Ann Arbor.
  • Virginia Tech is a 9-point home favorite against Pittsburgh, a 4-point road favorite against virginia, a 9.5-point road dog against Georgia Tech, and a 6-point road dog against Miami. And, remember, a 16-point home dog against Ohio State.

But we don’t need to strain our brains trying to piece together these ratings. As I showed last year and in 2013, we can take the point spreads from each game to determine what Vegas’ implied ratings are for 70 college football teams. [continue reading…]

References

References
1 Michigan State would be viewed as 2 points worse on a neutral field than Oregon, while being 11 points worse than Ohio State on a neutral field.
{ 1 comment }

Julius Thomas and Expected Touchdowns

In 2013, NFL players combined for 129,177 receiving yards and 804 receiving touchdowns. That means, on average, a touchdown was scored every 160.7 receiving yards. Denver tight end Julius Thomas gained 788 receiving yards that year, which means we might have “expected” him to catch 4.9 touchdowns. But Thomas was no average scorer: he finished with 12 touchdowns, or 7.1 more than expected.

In 2013, only Jimmy Graham and Vernon Davis scored more receiving touchdowns relative to expectation than Thomas (Davis scored 13 times on just 850 receiving yards, or 7.7 more than expected, while Graham converted 1,215 receiving yards into 16 touchdowns, or 8.4 more than expected).

Well, as good as Thomas was in 2013, he was even crazier at scoring touchdowns last year. Despite gaining just 489 receiving yards, Thomas again scored 12 touchdowns, 8.9 more than expectation (the league average was 159.7 receiving yards per receiving touchdown). That was the most in the NFL, and only Dez Bryant (1,320/16/+7.7) was within shouting distance of him. [continue reading…]

{ 11 comments }

Passing By Uniform Number

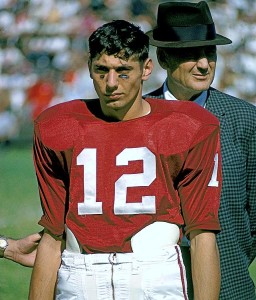
Namath BearMost people know about quarterbacks and the number 12. Even if you didn’t know where it started — Al Dorow of the New York Titans made the Pro Bowl in ’61 wearing number 12, while Charley Johnson of the St. Louis Cardinals was the first #12 to throw for 3,000 yards, doing so in 1963 and 1964 — you can probably recite most of the history from there. John Brodie, who entered the NFL in 1957, was the first great #12, while Joe Namath took the number to iconic status in the late ’60s. It was popularized by Roger Staubach (who also wore 12 at Navy in the early ’60s), Bob Griese, Terry Bradshaw, and Ken Stabler in the ’70s. [1]And, sadly, not popularized by Greg Cook. That means the Super Bowl winning quarterback wore #12 for nine straight years, beginning with Super Bowl VI. Doug Williams even wore it in Tampa Bay, although punter Steve Cox forced Williams to don #17 when in Washington.

Lynn Dickey wore it for the Packers in the early ’80s, while Randall Cunningham and Jim Kelly repped #12 later in the decade. Stan Humphries made it to the Super Bowl wearing #12 with the Chargers, while Erik Kramer set the still-standing franchise records for passing yards and passing touchdowns in a season while wearing #12 for the Bears in 1995. The only time a Ravens quarterback threw for 4,000 yards or 30 touchdowns was when Vinny Testaverde wore #12 in 1996. Chris Chandler took the Falcons to the Super Bowl in 1998 wearing #12, while Rich Gannon became the second great Raiders quarterback to wear twelve a year later.

And since then, three guys you might have heard of have worn #12: Tom Brady, Aaron Rodgers, and Andrew Luck.

Since 1950, players wearing #12 have thrown for 675,044 yards. No other number has yet to hit the 500,000-yard mark. But that brings us to today’s trivia: Which number has produced the second most passing yards since 1950? [continue reading…]

References

References
1 And, sadly, not popularized by Greg Cook.
{ 11 comments }

In 2012 and 2013, I looked at which passers were most effective on third and fourth downs; today, we examine those numbers for 2014. Throughout this article, when I refer to “third downs” or “third down performance”, note that such language is just shorthand for third and fourth downs.

To grade third down performance, I included sacks but discarded rushing data (in the interest of time, not because I thought that to be the better approach). The first step in evaluating third down performance is to calculate the league average conversion rate on third downs for each distance. Here were the conversion rates in 2014, along with the smoothed (linear) best-fit rates: [continue reading…]

{ 36 comments }

Reggie Bush, After 9 NFL Seasons

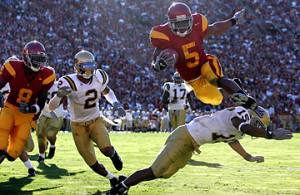
Bush in his prime

Bush in his prime

There’s no better college football writer than Matt Hinton, and his latest article — The Ghost of Reggie Bush — is a good example of Matt’s typically thorough work. Thinking about Bush now, there’s no denying that he has failed in the NFL to deliver on his oversized hype. And while you don’t need me to count the ways, here are just a few of them:

  • Bush’s best single-season performance in rushing yards is 1,086, set when he was with the Dolphins in 2011. Since he entered the league, 52 players have rushed for1,087 yards or greater in a seaseon at least one time. And that’s 52 players, not 52 player-seasons. Frank Gore, for example, has hit the 1,087-yard mark 7 times since 2006.
  • Bush’s best single-season performance in yards from scrimmage is 1,512, set two years ago as a member of the Lions. Since 2006, 46 players have had at least one season with 1,513 yards from scrimmage or greater. Adrian Peterson has 5 such seasons.

So yeah, Bush has failed to change the game.  He hasn’t been able to do this, or this, or this (sorry, Richie), or this (sorry, Richie), or this in the pros.  Bush has had some impressive returns in the NFL, but the closest he’s ever come to approximating USC Bush was this touchdown run in the playoffs against Arizona.  So, other than for a few brief moments, no, Reggie Bush never became Gale Sayers.

But let’s try to paint Bush’s career in some positive lights. Consider:

  • Rushing Yards: Bush ranks 19th in rushing yards since 2006, which is — not bad? He’s also one of 13 backs to rush for 5,000 yards and 4.3 YPC over the last nine seasons.
  • Yards from Scrimmage: Bush ranks 21st in yards from scrimmage over the last nine years, and 11th in that metric among running backs. That’s … pretty good?

OK, those aren’t great, but what should we have expected out of Bush? In the last 50 years, there have been 21 running backs to win the Heisman, including Bush (who, you know, “didn’t win the Heisman”). Here are their NFL stats: [continue reading…]

{ 15 comments }

Guest Post/Contest: PFRWhacks

Today’s guest post/contest comes from Adam Harstad, a co-writer of mine at Footballguys.com. You can follow Adam on twitter at @AdamHarstad.


Like most of you, [1]I assume. I like to spend my weekends building custom databases of NFL statistics. This past weekend, while doing just that, I happened to notice that Marshall Faulk topped 2,000 yards from scrimmage in both 2000 and 2001 despite playing just 14 games each year. Which sent me scrambling to the Pro-Football-Reference.com player season finder [2]Obviously. so I could share on Twitter the novel observation that Marshall Faulk was, indeed, good at football.

As luck would have it, the humble proprietor of Football Perspective just happened to be sitting at home, trolling around on Twitter, and likewise playing with various historical databases. [3]On second thought, I doubt luck played any role. He saw my tweet and responded in kind, with a list of all NFL players sorted by average yards per game from age 25 to 28.

All of this inspired a fun back-and-forth between various other users on Twitter which culminated in me providing a list of all running back seasons with 250+ carries and 50+ yards per game receiving. It’s a rather short list featuring just 8 total seasons. Marshall Faulk accounted for four of those eight seasons, consecutively, from 1998 to 2001.

I quickly noticed an interesting thing about that last list, though. Not only did Marshall Faulk account for half of those seasons in NFL history, but he actually had the top four by receiving yards per game. In fact, if we adjust our “receiving yards per game” baseline from 50 to 54, we wind up with this list, instead.

Now that is a rather more impressive list. Using just two simple cutoffs, we had managed to create a list that was just four names long, and every single one of those names was “Marshall Faulk.”

Seguing away for a second… in the early days of the internet, before there were continents composed solely of cat pictures (or handy NFL season finders to query, for that matter), people would resort to pretty much anything to keep themselves entertained. One game that sprung from these dark times was known as “Googlewhacking”. A Googlewhack was two words that, when entered together into the search bar of the eponymous Google, matched just a single result on the entire internet.

For instance, there was once a time when searching the words “ambidextrous scallywags” (but without the quotation marks) would return just a single match. This was then a successful Googlewhack. Googlewhacks were, by their very nature, ephemeral constructs, since the very act of publishing a Googlewhack would cause the published result to show up on Google and would therefore cause the words to lose their Googlewhack status. [continue reading…]

References

References
1 I assume.
2 Obviously.
3 On second thought, I doubt luck played any role.
{ 41 comments }

There are 23 quarterbacks who have won both a championship (as a starter) and a Most Valuable Player award in professional football history. Can you name them? First, let’s get to the fine print:

  • To determine championships, I began in 1936. I awarded half a ring to each of the championship quarterbacks in the AAFC and NFL from 1946 to 1949, and half a ring to the two championship quarterbacks in the AFL and NFL from 1960 to 1965. For purposes of this post, I am including all quarterbacks with “half a ring”, but when I list career totals, keep the half-ring idea in mind.
  • Based on sharing of quarterback duties, I awarded half-rings to the quarterbacks on the NFL champions in 1939, 1951, 1972, and 1990. For the NFL champion in 1970, I also awarded half a ring to that team’s top two quarterbacks, since the starter left while trailing in the Super Bowl. If you disagree with my awarding of half rings in this manner, don’t worry about.  I’ve spelled out the relevant information in the post below, so feel free to manipulate the system as you desire.  If so inclined, you can dismiss the early AFL years or give full credit to both MVPs in a particular season, for example.
  • For MVPs, I used the Joseph F. Carr award from ’38 to ’46. Then I used the UPI for the next ten years, or the Washington D.C. Touchdown Club award when the UPI didn’t name an MVP. Those years were 1947 (which, as it turns out, was one of the easiest seasons to identify), 1949, 1950, and 1952. Then I used the AP for every year since for simplicity’s sake (i.e., just using what is listed on PFR, not out of a misguided notion that the AP is the end-all, be-all source for MVP voting). I gave the AFL and NFL MVP half an award in each year from 1960 to 1969, and I also assigned only half credit to the shared MVPs in ’97 and ’03 (the award was also split in ’49).

[continue reading…]

{ 29 comments }

Brad Oremland is a longtime commenter and a fellow football historian. Brad is also a senior NFL writer at Sports Central. There are few who have given as much thought to the history of quarterbacks and quarterback ranking systems as Brad has over the years. What follows are Brad’s thoughts on a stat-based quarterback ranking system.


I recently concluded an eight-part series on the greatest quarterbacks in the history of professional football. Those rankings were subjective, based on everything I know about the players: stats, awards and honors, coaching and teammates, team success and postseason performance, reputation, the eye test, and so forth.

But I also have a method for classifying quarterbacks statistically. I actually published the results of this formula three months ago, but without revealing the process that produced those results. A number of readers were curious about my methodology, and in this post, I’ll finally explain how the sausage gets made. The math is not complicated — you don’t need a stats background to understand this — but there’s a lot of it: you could calculate most of this with a pencil and paper, but by the end, you’re going to want a spreadsheet. [continue reading…]

{ 34 comments }

Last Sunday, I asked you about the head coaches who won playoff games with the most quarterbacks. Today, per wiesengrund’s request, the reverse: quarterbacks who won playoff games with multiple coaches.

There is one quarterback who won playoff games with four different head coaches. Can you name him? [continue reading…]

{ 3 comments }

An alternate uniform for the greatest tight end ever

An alternate uniform for the greatest tight end ever

Over the last three days, we’ve looked at the most dominant fantasy quarterbacks, running backs, and wide receivers. Today, we look at tight ends, using the methodology described over the three previous days.

I am using the following scoring system throughout this series: 1 point per 20 yards passing, 1 point per 10 yards rushing/receiving, 4 points per passing TD, 6 points per rushing/receiving TD, 0.5 points per reception.

You probably expect to see Rob Gronkowski’s 2011 season grade as the best fantasy season by any tight end. But, as it turns out, an AFC West tight end had one season that was ever so slightly more dominant.

You might think I’m talking about Tony Gonzalez, who has an unreal eleven seasons in the top 200. Or Kellen Winslow, who has eight top-200 seasons, half of which rank in the top 25. And if not one of those two, then surely Antonio Gates, who has nine top-200 seasons, including two in the top twenty. Or Shannon Sharpe, of course, who also has nine top-200 seasons, with six of those being in the top 70.

In fact, AFC West teams [1]And we don’t even need to include Seattle, which has 0 entries in the top 200 have 14 of the top 25 seasons by a tight end in fantasy history, and and 19 of the top 35 years. No division has dominated this position like the AFC West, but the best tight end season in fantasy history came from someone else: Oakland’s Todd Christensen. [continue reading…]

References

References
1 And we don’t even need to include Seattle, which has 0 entries in the top 200
{ 8 comments }

The GOAT

The GOAT

On Wednesday, we looked at the most dominant quarterbacks in fantasy history. Yesterday, we did the same for running backs. Today, we look at wide receivers, using the methodology described over the two previous days.

I am using the following scoring system throughout this series: 1 point per 20 yards passing, 1 point per 10 yards rushing/receiving, 4 points per passing TD, 6 points per rushing/receiving TD, 0.5 points per reception.

There are four seasons that have topped 200 points of VBD in wide receiver history: Elroy Hirsch, 1951; Wes Chandler, 1982; and Jerry Rice, 1987 and 1995. In ’95, Rice set the still-standing record with 351.5 fantasy points, courtesy of 122 catches, 1,848 receiving yards, and 15 touchdowns (he also rushed for 36 yards and a touchdown). Rice averaged 21.97 FP/G that year, while the baseline of WR32 was 9.15 FP/G. Therefore, Rice was 12.82 FP/G above the baseline for 16 games, which comes out to 205.1 points of VBD. [continue reading…]

{ 19 comments }

The fantasy GOAT

The fantasy GOAT

Yesterday, we looked at the most dominant quarterbacks in fantasy history. Today, the running backs, using the methodology described yesterday. Let’s look at the three best seasons in fantasy history, since all shed light on the formula here. Those three are LaDainian Tomlinson, 2006, which is easy to argue as the best year ever as Tomlinson shattered the record for fantasy points scored. But O.J. Simpson in 1975 (not ’73) was also dominant, and did so in a 14-game season and when the baseline was lower. The darkhorse candidate is Priest Holmes, 2002, who put up insane numbers but missed two games due to injury.

I am using the following scoring system throughout this series: 1 point per 20 yards passing, 1 point per 10 yards rushing/receiving, 4 points per passing TD, 6 points per rushing/receiving TD, 0.5 points per reception.

In 2006, Tomlinson rushed for 1,815 yards with 28 TDs, caught 56 passes for 508 yards and 3 touchdowns, and even threw for 20 yards and two touchdowns. He totaled a still mind-boggling 455.3 fantasy points. On a per game basis, Tomlinson averaged 28.46 FP/G, while the baseline — which for these purposes is RB24 [1]Baselines used in this series: From 1968 to 2014, RB24. In ’66 and ’67, RB20, and from ’61 to ’65, RB16. In the 1960 AFL, the baseline is RB6, while it is RB8 in the NFL. From … Continue reading — was at 10.75 FP/G. Therefore, Tomlinson averaged 17.71 FP/G over the baseline, and he did it for 16 games, giving him a VBD of 283.3 fantasy points (17.71 x 16). [continue reading…]

References

References
1 Baselines used in this series: From 1968 to 2014, RB24. In ’66 and ’67, RB20, and from ’61 to ’65, RB16. In the 1960 AFL, the baseline is RB6, while it is RB8 in the NFL. From 1950 to 1959, the baseline used is RB8.
{ 27 comments }