≡ Menu

Adam Steele on QB Defensive Support: Part 2

Adam Steele is back for another guest post, with today’s work being initially published at The GridFe. You can view all of Adam’s posts here. As always, we thank him for contributing.


Yesterday, I outlined my methodology for measuring QB defensive support, and looked at the best and worst seasons using that metric. Today’s post will explore the career numbers for the 107 quarterbacks in my study.

I originally planned to simply tally the seasonal numbers without adjustment, but that presented a problem: The top of the support leaderboard was disproportionately filled with QB’s who were exceptional at avoiding interceptions. This makes sense because throwing picks generally makes it harder to prevent the opponent from scoring, although I expected the effect to be minimal enough that it wouldn’t really make a difference. Well, it does make a difference.

To counter the interception issue, I added three point of defensive support for every marginal INT thrown in the regular season. Marginal INT’s are calculated by taking the difference between a given QB’s INT% and the league average rate [1]Technically a rolling three year average calculated by Bryan Frye, then multiplying that difference by the number of pass attempts. I know from expected points models that the typical INT is worth roughly -3 EPA, so each marginal INT makes the defense look three points worse than it actually is. As an example, Len Dawson threw -31 marginal INT’s during his career, which “saved” 93 points for his defense. Dawson’s career support is then adjusted by -93 points.

A more rigorous study would also adjust for playoff interceptions and lost fumbles, but I don’t currently have the means for easily compiling the marginal version of those statistics. Again you’ll just have to use common sense and make mental adjustments when necessary. [continue reading…]

References

References
1 Technically a rolling three year average calculated by Bryan Frye
{ 0 comments }

Adam Steele on QB Defensive Support: Part 1

Adam Steele is back for another guest post, with today’s work being initially published at The GridFe. You can view all of Adam’s posts here. As always, we thank him for contributing.


I’ll start by stating the obvious: QB wins is a terrible metric for evaluating the performance of quarterbacks. But since this criteria remains at the forefront of the public discourse about NFL signal callers, I figured it would be worthwhile to provide some important context.

The game of football is won and lost in three phases, two of which have very little to do with the QB. In this post I’m going to present a cursory analysis of which quarterbacks benefited the most and least from the play of their teams’ defenses and special teams.

When I reference defensive support, I’m actually referring to the points allowed by a given quarterback’s team compared to the average team during that season. This is not an exhaustive study; my numbers do not adjust for field position, number of drives, turnovers, weather, or any other hidden variable that affects points allowed. But including all the noise also includes all the signal.

From the quarterback’s perspective, it doesn’t matter why his team gave up x number of points – his chances of winning the game are the same (or nearly the same) regardless. If his team allows 35 points, it doesn’t matter to the QB whether his own defense was bad or the opposing offense happened to be a juggernaut. If his team allows only 10 points, it doesn’t matter to the QB whether his defense was stout or the opposing kicker missed three field goals. This is why I’m content to use straight points allowed and ask the reader to make common sense adjustments for QB’s in extreme circumstances.

I collected data from the top 100 quarterbacks in career pass attempts (modern era) plus Hall of Famers and Super Bowl winners outside of the top 100. I only wanted to count games in which the QB played a significant amount, so I set a threshold of 14 pass attempts for a game to count (14 attempts per game is the NFL’s official minimum for rate stat leaderboards). It doesn’t matter whether the QB started the game or not, as such data gets murky the further in time we look back (for another look, here is an old Chase article on points allowed per game in games started by each quarterback). Playoff games are included in the points allowed totals as well as league baselines; said baselines are calculated by removing the points allowed in qualifying games of the QB is question, then finding the league average points per game in all other games during a given season.

In the two tables below, Win % is from qualifying games only, O/U is the number of games over or under .500 in qualifying games, and Playoffs indicates which round of the postseason was reached the by the QB’s team (even if he didn’t play in the postseason).

Here are the top 100 seasons of defensive support among the quarterbacks in my study: [continue reading…]

{ 0 comments }

Surplus Yards And QB Seasons, By Adam Steele

Adam Steele is back for another guest post. You can view all of Adam’s posts here. As always, we thank him for contributing.


Earlier this month, I introduced a new stat called Surplus Yards and applied it to the 2017 season. If you haven’t read that post, consider that required background reading.

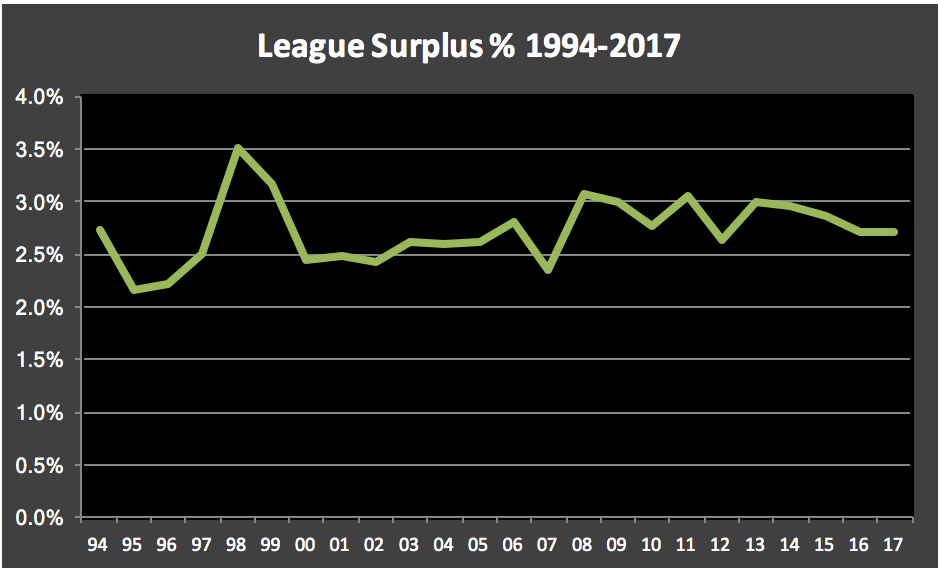
Since then, I calculated and archived every 40+ yard completion since 1994. The chart below shows the league average Surplus % for each of the last 24 seasons:

[continue reading…]

{ 0 comments }

Adam Steele is back for another guest post. You can view all of Adam’s posts here. As always, we thank him for contributing.


Surplus Yards 2017

In response to the Jared Goff post from earlier this month, I wanted to delve into the yardage a QB picks up on long plays. I theorized that Goff’s historical ANY/A leap in 2017 was in part fueled by an unsustainable number of long completions. To measure this, I created a stat called Surplus Passing Yards. Its calculation is quite simple – on any given completion, yardage in excess of 40 is deemed to be surplus. So a 67 yard pass play yields 27 surplus yards. I then add up the surplus yards for all applicable plays during a season. [1]You may be wondering why I choose 40 yards as the cutoff for a “normal” play. After digging through years of play-by-play and running some correlations, 40 yards seems to be the inflection point … Continue reading

Having established in the above footnote that surplus yards are random and not indicative of QB skill, let’s take a look at the qualifying quarterbacks from 2017. The chart below shows every  40+ yard completion from each QB along with his total surplus yardage. For example, Alex Smith had 13 long passes of 40+ yards; his longest pass went for 79 yards, his second-longest pass for 78 yards, his third-longest for 75 yards, etc. That means his longest pass had 39 Surplus Yards, his second-longest completion had 38 Surplus Yards, and so on; all told, he had 236 Surplus Yards last season, the most in the NFL. [continue reading…]

References

References
1 You may be wondering why I choose 40 yards as the cutoff for a “normal” play. After digging through years of play-by-play and running some correlations, 40 yards seems to be the inflection point where randomness takes over. The ability to complete passes in the 30-40 yard range is a repeatable skill, and is often the determining factor that separates the great QB’s from the average ones. But beyond 40 yards, the yardage picked up very long pass plays is almost entirely random from season to season. I calculated the surplus yards for all qualifying QB’s from 1994-2017, then compared all cases where a QB attempted 224+ passes in consecutive seasons. To avoid biasing the results by playing time, I converted the data into Surplus %, or the percentage of passing yards that came via surplus yards. Over a sample of 513 season pairs, the correlation of Year N to Year N+1 surplus % was a miniscule .04 with an R^2 of .002!
{ 1 comment }

Guest Post: Adam Steele on Quarterback MVP Shares

Adam Steele is back for another guest post. You can view all of Adam’s posts here. As always, we thank him for contributing.


In this post, I will attempt to estimate how many MVP awards each QB has “deserved” over the course of his career. I wanted to accomplish this task using very basic statistics, so the only inputs are pass attempts, passing yards, and TD passes. I can’t stress enough that this is aimed at providing rough estimates and not definitive answers.

Methodology

The metric I will use for this study is my own creation, Positive Yards Per Attempt (PY/A). I chose this over ANY/A for several reasons:

  • It is available back to the early days of the NFL, whereas ANY/A only goes back to 1969; I prefer to employ a uniform measurement for players of every era.
  • Sacks (invalid) and interceptions (unstable and invalid) are poor measures of QB performance, while Y/A and TD% are both statistically valid. (Proof)
  • If I used ANY/A, a number of unworthy seasons would appear MVP caliber due to fluky INT rates (looking at you, Damon Huard).
  • MVP voters typically focus on yards, TD passes, and wins (shame on them), but largely ignore interceptions and sacks.

With my justifications out of the way, let’s get to the actual formula:

  1. PY/A = (Passing Yards + TD Passes *20) / Attempts.
  2. Each QB season is compared to league average, giving us Relative PY/A (RPY/A). At this juncture, all seasons below +1 RPY/A are discarded, as I consider that the minimum baseline for a great season.
  3. I don’t want anyone receiving MVP Shares for lighting it in limited action (Todd Collins in 2007, for example), so I added a minimum threshold for attempts in a season. From 1978-present, the minimum is 300 attempts, and from 1950-1977 the minimum is 200 attempts. I purposely did not prorate 1982 and 1987 because I don’t think MVP awards in shortened seasons should be worth as much as full seasons.
  4. I excluded the AFL and AAFC because those leagues had watered down competition, and also because I’m lazy. Seasons before 1950 are excluded for the same reasons.
  5. I want to emphasize QB’s who play all or most of a season, which is accomplished by subtracting the minimum baseline from each QB’s attempts in a season. For example, a modern QB who attempts 525 passes in a given year will have his attempts adjusted down to 225 (525-300). This ensures that a QB who plays excellently over 2/3 of a season doesn’t get too much credit, but still gets some (such as Kurt Warner in 2000).
  6. RPY/A is multiplied by adjusted pass attempts to calculate MVP Value.
  7. League MVP Value is summed in each season, and each quarterback’s MVP Value is divided by the league total. This is his MVP Share. The divisor is capped at 500 and floored at 200, which results in some seasons producing more or less than one MVP Share. This last modifier was necessary due to vast discrepancies in yearly MVP Value totals, as I don’t want historically great seasons penalized too much for occurring within a loaded field (such as 2011 or 1976). The 68 seasons from 1950-2017 produced a grand total of 60.2 MVP Shares, which feels quite reasonable (we can pretend the other 7.8 MVP awards went to non-quarterbacks).

Here are the top 100 MVP Share seasons since 1950:

And now the MVP Share career list (the Seasons column represents the number of different seasons each QB received more than zero MVP Shares):

I’ll leave the commentary up to you guys!

{ 37 comments }

Adam Steele on Negative Yards per Attempt

Adam Steele is back for another guest post. You can view all of Adam’s posts here. As always, we thank him for contributing.


On Monday, I updated my ever-evolving Positive Yards Per Attempt metric. Today’s post will serve as an introduction to its contra metric, Negative Yards Per Attempt (NegY/A). The very simple formula is as follows:

NegY/A = ( – sack yards – INT * 45) / dropbacks

The result will always be either zero or negative, but less negative (i.e., closer to zero) numbers are better. I chose to exclude fumbles because I want to maintain an apples to apples comparison with PY/A, so NegY/A covers passing plays only. I want to be very clear – NegY/A is NOT intended to be a comprehensive measure of QB play and should never be cited on its own. Its primary purpose, as with PY/A, is to estimate the relative importance of the different components of the passing game.

I won’t bore you with more words, so lets get straight to the numbers. Similar to the PY/A table, NegY/A is presented as both value over average and relative to league average on a per play basis. I wanted to cover the same timeframe as the previous article, so this includes all QB seasons since 1992 of at least 224 dropbacks (n = 829). [continue reading…]

{ 3 comments }

Positive Air Yards per Attempt: 2017 Update

Adam Steele is back for another guest post. You can view all of Adam’s posts here. As always, we thank him for contributing.


Positive Yards Per Attempt: 2017 Update

If I could only share one thing from my time doing football analytics, it would be the following principle: Positive plays carry more weight than negative plays in determining the winner of a football game. I’ve already written a couple of articles on this subject and hope to further the cause with this update.

Overview

For those of you who don’t feel like reading the previous two posts, I’ll give you the basic gist. Since passing has a far greater impact on winning than running, I’ve focused my research on quarterbacks, but the principle applies to the entire offense (defense, not so sure). Despite everyone constantly harping on turnover avoidance, a potent passing offense is usually able to overcome giveaways. Conversely, avoiding turnovers is normally not enough to overcome a weak passing game. Furthermore, turnovers are highly random and situation dependent, so it follows that turnovers are a very poor method of gauging quarterback performance. Even though sacks are largely the quarterback’s fault, they are also very context dependent and only contribute a small amount in determining game outcomes. More importantly, the majority of signal callers trade sacks for interceptions or vice versa, so it’s no really fair to include one but not the other. [continue reading…]

{ 119 comments }

Adam Steele is back to recap his Wisdom of Crowds work. As always, we thank him for that. Football Perspective wouldn’t be what it is without contributions like this from folks like Adam.


I’d like to thank everyone who voted in this year’s Wisdom of the Crowds, and I also appreciate your patience in waiting for the long overdue recap article. I’m not much for small talk, so let’s get right to it.

Originally, my plan was to simply tally the scores and use the totals for the QB ranking. However, it quickly became evident that this wasn’t going to work, as we had very large discrepancies in how voters allocated their points. Some people awarded 25 points to their pick for best ever, while others didn’t give any QB more than six points. It would be just plain wrong for one voter’s GOAT to be weighted four times more than the next voter. My solution (helmet knock to commenter hscer [1]I highly encourage you to check out hscer’s collection of Sporcle quizzes., since he came up with it) is to tabulate points in proportion to the highest score on each ballot. Thus, a QB who scores five points on a ballot with a 25 maximum receives 0.2 ranking points, while a five-pointer on a ballot with a maximum of six is awarded 0.83 ranking points. This levels the playing field for all ballots, and in my opinion yields a far more honest result than the simple tally method. Since the abstract concept of ranking points is tough to put in proper context, I’ve translated them into Share %, which is the percentage of possible points earned. We had 51 legal ballots submitted this year, so Share % = ranking points / 51.

Results

In order to qualify for a WOC ranking, a quarterback had to be listed on a minimum of three ballots, leaving us with 36 qualifying QB’s. The table below lists the quarterbacks’ Share %, ballot appearances, “pantheon” appearances (ballots where he received at least 0.5 ranking points), and ballots where he received the highest score (including ties). I also included the ranking each QB earned in the 2015 edition of this exercise, as well as the number of positions gained or lost from 2015 to 2017. [continue reading…]

References

References
1 I highly encourage you to check out hscer’s collection of Sporcle quizzes.
{ 50 comments }

Wisdom of Crowds: Quarterback Edition (2017)

Adam Steele is back with some Wisdom of Crowds work. As always, we thank him for that.


In 2015 we ran a pair of Wisdom of the Crowd exercises, one for quarterbacks and one for running backs. Participation was high and the ensuing discussions were plentiful, so I decided to bring the idea back this year. First up are quarterbacks, but there will be new rules this time around. The previous edition asked voters to rank their quarterbacks 1-25, with points scored in linear fashion based on the ranking from each ballot. While that method was simple, it left a lot to be desired. Most notably, voters weren’t able to indicate the magnitude of difference between the QB’s on their lists, so the difference between 24th and 25th was worth the same as the difference between 1st and 2nd. That’s just plain wrong.

New Rules

1) Each voter will be allotted 100 Greatness Points to distribute to quarterbacks as he or she wishes, with a few caveats.

2) The maximum points given to a single QB may not exceed 25.

3) Ballots must include a minimum of ten quarterbacks, with a maximum of 40.

4) Points must be assigned as whole numbers.

Just as before, you are free to use whatever definition of Greatness you see fit. If you have trouble getting started, it’s helpful to list every quarterback that you consider Great, then distribute points based on the relative standing among the quarterback you listed. In order for this exercise to work properly, please submit your ballot before reading anyone else’s; we want each opinion to be as independent as possible. Your ballot will not be counted if the points don’t add up to exactly 100, although I will let you know and give you a chance for revision. Here is an example of how I’d like your ballot to look (of course yours may include more quarterbacks): [continue reading…]

{ 279 comments }

Adam Steele is back for another guest post. You can view all of Adam’s posts here. Adam is now on Twitter, and you follow him @2mileshigh. As always, we thank him for contributing.


In 2014, Football Perspective ran a pair of crowd sourcing exercises to determine the greatest quarterbacks and running backs of all time. These experiments were a lot of fun and generated a great deal of debate amongst the participants, so I thought it would be worthwhile to give crowd sourcing another shot. NFL quarterbacks are the most discussed and analyzed athletes in America, but we can’t properly debate the merits of the league’s famous signal callers without considering the effects of their supporting casts. As of today, there is no mathematically accurate way to measure the strength of a QB’s teammates and coaches, but there are plenty of people around who possess the football knowledge to make educated guesses. Basically, this is the perfect candidate for crowd sourcing. I want to keep things simple to maximize reader participation, so there are just a handful of guidelines I expect participants to follow:

1) Please rate a QB’s supporting cast based on how they affected his statistical performance, not his win/loss record or ring count. The supporting cast umbrella includes the direct effect of skill position teammates, offense lines, coaches, and system, but also the indirect effect of defense, special teams, ownership, and team culture. You’re free to weigh these components however you see fit. The rating for each supporting cast will account for the quarterback’s entire career, using a 0-100 scale. As a rule of thumb, a 100 rating equates to an all star team, 75 is strong but not dominant, 50 is average, 25 is weak but not terrible, and 0 is equivalent to the 1976 Buccaneers.

2) Ratings should be roughly weighted by playing time. The years in which a QB is the full time starter should count more heavily than seasons where he’s a backup or spot starter. And this almost goes without saying, but supporting casts are best evaluated in the context of their respective eras.

3) You may rate as many supporting casts as you wish. Since I will be compiling the results by hand, it doesn’t matter how you order your list, as long as it’s easy to read. I ask that you refrain from rating the supporting casts of quarterbacks you’re not reasonably familiar with; if you don’t know anything about a QB’s career, don’t guess! Any quarterback with at least 1,500 pass attempts is eligible to be rated, and I’ve provided a list of these quarterbacks here. Feel free to break up your ratings into multiple posts on different days, but just be sure to post with the same username each time so I can properly count the results. I plan on keeping the poll open for one week, but reserve the right to extend the duration if interest from new participants remains high enough.

Have fun!

{ 25 comments }

Adam Steele is back for another guest post. You can view all of Adam’s posts here. As always, we thank him for contributing.


Previously, I introduced my new metric — Adjusted Points Per Drive — for measuring team offense. I thought it would be fun to apply the same methodology to quarterbacks, which I what I’m doing today. I highly encourage you to go back and read the previous post if you haven’t already, because I don’t want to clutter today’s post by repeating all of the calculation details.

Unfortunately, I don’t have drive stats for individual games, so there’s going to be some approximation here. To calculate a quarterback’s career Adjusted Points Per Drive (AjPPD), I simply take his team’s AjPPD from each of his playing seasons and weight those seasons by games started. This will give us a measure of a quarterback’s scoring efficiency, but it doesn’t account for volume or longevity. That’s where Adjusted Offensive Points (AjPts) comes in handy.

I assign each QB a portion of his teams’ Adjusted Points, then compare that to league average to calculate Points Over Average (POA). The formula for calculating a given season’s POA = (Tm AjPts – 315) * (GS / 16). The 315 figure is derived from multiplying my normalized baselines of 1.75 AjPPD by 180 drives per year, meaning the average team scores 315 Adjusted Points per season.

I’ll use Ben Roethlisberger’s 2015 season as an example: Pittsburgh scored 400 Adjusted Points and Ben started 11 games, so his 2015 campaign is worth (400 – 315) * (11 / 16) = 30 POA. Do this for every season and we have Career POA, which is the primary metric I’ll be using here. However, some people prefer to rank quarterbacks based on their peak years rather than their entire career, so I added the “Peak” column which is the sum of each quarterback’s three best POA seasons.

This study includes all QB’s who started their first game in 1997 or later, and made at least 40 starts between 1997 and 2015 (partial numbers from 2016 are not included). These criteria leaves us with 56 quarterbacks. Before we dig into the results, it’s worth noting that the correlation between Career POA and ANY/A+ is a healthy 0.92. We all know that the NFL is a passing league, but drive efficiency is even more dominated by the passing game than I thought. According to r2, 85% of the variance in Adjusted Points Per Drive is explained by a basic measure of passing efficiency. That doesn’t leave much room for the running game to have an impact. In fact, I’ll go as far to say that rushing efficiency has no appreciable impact on scoring for the majority of teams. That’s not to say running the ball is useless; offenses must run occasionally to keep the defense honest, and running comes in handy for converting short yardage and bleeding the clock. But, to quote Ron Jaworski, “Points come out of the passing game!”

Time for the rankings… [continue reading…]

{ 8 comments }

Adam Steele is back for another guest post. You can view all of Adam’s posts here. As always, we thank him for contributing.


Adjusted Points Per Drive

I love drive stats. There’s no better method, in my opinion, of measuring the performance of offensive and defensive units. However, raw points per drive has a couple of glaring flaws – it doesn’t account for field position or adjust for league offensive efficiency. In this post, I am going to correct those issues and rank every offense in the drive stat era (1997-2015). [1]Drive Stats provided by Jim Armstrong of Football Outsiders, and expected points data courtesy of Tom McDermott. To accomplish this, I created a simple metric called Adjusted Points Per Drive. Here’s how it’s calculated:

Step 1: Calculate total offensive points for each team. OffPts = PassTD * 7 + RushTD * 7 + FGAtt * (LgFGM / LgFGA). I chose to use the average value of a field goal attempt rather than made field goals, as I want to minimize the effect of special teams. In 2015, for example, the average FGA was worth 2.535 points, so I plug that number into each team’s number of attempts.

Step 2: Calculate points per drive (PPD). All drives ending with a kneel down are discarded. PPD = OffPts / Drives.

Step 3: Adjust for starting field position. The expected points value of each yard line is a bit noisy, so I smoothed it out into a simple linear formula. Every yard is worth 0.05 expected points, and PPD is normalized based on an average starting field position at the 30 yard line. I call this field position adjusted points per drive, or fPPD for short. fPPD = PPD – ((AvgFP – 30) *0.05). With this step, we can accurately compare the scoring production of all teams within a given season.

Step 4: Adjust for league scoring efficiency. I normalize each season’s fPPD to a baseline of 1.75 to calculate adjusted points per drive. At the team level, AjPPD = fPPD / LgfPPD * 1.75. Now, at last, we can compare the scoring production of every team since 1997. To make AjPPD more intuitive, I also translate it into adjusted offensive points (AjPts) using a baseline of 180 drives per team season. AjPts = AjPPD * 180. [continue reading…]

References

References
1 Drive Stats provided by Jim Armstrong of Football Outsiders, and expected points data courtesy of Tom McDermott.
{ 22 comments }

Resting Starters Database

Adam Steele is back for another guest post. You can view all of Adam’s posts here. As always, we thank him for contributing.


In the same vein as Bryan Frye’s kneel, spike, and first down data and Tom McDermott’s adjusted SRS ratings, I want to contribute some corrections in data distortion. From a stat geek’s perspective, there’s nothing more annoying than strong teams resting their starters in the final week of the season, as it pollutes season long statistics with a game’s worth of junk data. In a 16 game season, even one meaningless outlier can have a big impact on season totals and averages. The most egregious example is the 2004 Eagles, who stormed out to a dominant 13-1 start only to mail in their final two games by a combined score of 58-17. Philly’s season totals look far better (and far more accurate) once those two meaningless games are removed from the sample. I went back to 1993 and noted every game where one team sat their starters and/or played vanilla football with no intention of trying to win. In some instances, a team was clearly going full bore in the first half, then waved the white flag after halftime. In these games, I pulled out the junk data from the second half only.

There are obviously going to be some judgment calls in deciding whether or not a team was really trying to win a given game. For example, this past season’s week 17 matchup between Seattle and Arizona could be viewed two different ways – Arizona was trying to win (at least in the first half) and Seattle just stomped them, or the Cards weren’t really trying even though their starters played the first half. I chose the latter. The one notable game I purposely left out was the week 17 Packers/Lions shootout from 2011. The game was technically meaningless for both teams, and Green Bay kept Rodgers on the bench, but otherwise all the starters played and were clearly playing to win. If the Packers didn’t care, Matt Flynn would not have thrown six TD passes. If you dispute any of the games I’ve listed, I’m happy to discuss and reconsider!

How to read the table: The first five rows are self-explanatory; “Type” designates whether the whole game should be discarded or just the second half; Points, PaTD, and RuTD indicate the points and offensive touchdowns scored during junk time (the stats I believe should be removed from the season data). Defensive numbers can be found by simply looking at the offensive numbers from the team’s opponent.

My plan is to eventually do this all the way back to 1970, then publish the “real” points scored and allowed for each team by prorating the pristine data to a full season.

{ 18 comments }

Positive Yards Per Attempt (Updated)

Adam Steele is back for another guest post. You can view all of Adam’s posts here. As always, we thank him for contributing.


Last year, I introduced a simple alternative to ANY/A called Positive Yards Per Attempt. Today I’m going to update the formula with a few tweaks and more years of data. For those who don’t feel like reading the rationale behind PY/A provided in the link, it basically boils down to this: The magnitude of a QB’s positive plays are a better indicator of skill than the frequency of his negative plays, and positive plays contribute to winning more than negative plays contribute to losing. With this in mind, PY/A only counts yards and touchdowns while ignoring sacks, interceptions, and fumbles. In the updated version, I split air yards and YAC in the years where data is available. Here is the formula:

1992 – Present
PY/A = (Air Yards + YAC/2 + TD Pass *20) / Attempts

1950 – 1991
PY/A = (Pass Yards * 0.8 + TD Pass *20) / Attempts

The next step is to measure PY/A in relation to league average, which I call Relative PY/A or RPY/A. This is simply PY/A – LgPY/A. After calculating RPY/A for every season back to 1950, I noticed a pattern of dome-playing passers rating higher than they should, so I built a weather adjustment. Based on the conditions of each quarterback’s home stadium, I assigned him a bonus or penalty applied on a per play basis. The weather adjustment is not split by attempts at each stadium during a season, as that would be way too much work. These adjustments are arbitrary and almost certainly wrong, but still better than no adjustment at all. You can see the weather adjustment for each QB in the “Wthr” column of the tables.

Now comes the issue of balancing volume and efficiency. This is handled by adding 200 attempts of replacement level ball to each QB’s season total, with replacement level being LgPY/A – 0.5. I must give credit to Neil Paine for this idea, as it’s based on his method of adding 11 games of .500 ball to a team’s record to estimate their “true” winning percentage. After applying the 200 attempt regression to every QB season, I stumbled onto another problem – early AFL and older NFL seasons were rated too highly. I decided to use the regression step as a double for a depth of competition adjustment. The AFL from 1960-64 and NFL from 1950-59 are hit with a sharper regression than the -0.5 used for modern seasons, with the most severe being -2 for the 1960 AFL.

With all the adjustments factored in, we arrive at the final product – True Relative PY/A (abbreviated with the alphabet soupy TRPY/A). The table below shows the top 200 seasons since 1950: [continue reading…]

{ 15 comments }

Guest Post: Adam Steele on True QB Talent

Adam Steele is back for another guest post. You can view all of Adam’s posts here. As always, we thank him for contributing.


Introduction: QB True Talent

One of the mandates for being a football analytics guy is to create a quarterback rating system, so today I’m going to throw my flag onto the field. However, I’m taking a different approach by asking a different question. I’m not trying to measure individual or team accomplishments, nor am I calculating value or attempting to predict the future. My goal is to answer a simple question: At a fundamental level, how good was he? As far as I’m aware, nobody has made a systematic attempt at answering this. Before we go any further, I need to add a vital disclaimer. My formula is statistically derived, and does not account for supporting cast, coaching, or anything else we can’t measure directly. So when I use the label “True Talent”, it really means “A rough estimate of true talent, based solely on statistics.”

I’ll save the gory micro details of True Talent’s calculation for another post, but today I want to outline how it works and ask for feedback on how to improve it. First, I’ve attempted to isolate what I believe are the four pillars of QB play: Passing Dominance, Passing Consistency, Ball Protection, and Rushing Ability. These categories are weighted by a) their importance within the framework of the overall QB skillet, and b) the level of control a QB has in converting the skill into results. The score for each category is era-adjusted, balanced by volume and efficiency, and scaled so zero is equal to replacement level. The overall True Talent score is simply the sum of the four category scores, minus five (the replacement level bar is higher for overall QB play compared to each of the pillars on their own). The overall score is expressed as percentage above or below replacement level. I’ve purposely rounded all figures to whole numbers to remind readers that these numbers are estimates, not precise measurements.

My plan is to eventually apply True Talent back to the 1940s, but for now we’re going to look at the last twenty seasons (1996-2015). I want to nail down the methodology before I go all the way back through history. Normally I wouldn’t subject readers to an arduously long table, but in this case I think it’s warranted. I want you to see how all levels of QB fare in my system, not just the best and worst. This table includes every QB season since 1996 with at least 100 dropbacks. I encourage you to sort by each category, by season, and by player to really get a feel for True Talent. [continue reading…]

{ 19 comments }

Adam Steele is back for another guest post. You can view all of Adam’s posts here. As always, we thank him for contributing.


There have been countless attempts at deducing the clutchiness of NFL quarterbacks, most of which involve tallying playoff wins and Super Bowl rings. Today I’m going to take a stab at the clutch conundrum using a different approach: Pythagorean win projection. If a quarterback’s actual win/loss record diverges significantly from his Pythagorean estimated record, perhaps we can learn something from it. I began this study having no idea how it would turn out, so there were definitely some surprises once I saw the end results. This study evaluates the 219 quarterbacks who started at least 32 games since 1950, including playoffs but excluding the 1960-64 AFL (lack of competitive depth).

Here’s how to read the table, from left to right: points per game scored by the QB’s team in games he started, points per game allowed in his starts, total starts, total wins (counting ties as a half win), Pythagorean projected wins based on the points scored and allowed in his starts (using a 2.37 exponent), and the difference between his actual win total and Pythagorean win projection. [continue reading…]

{ 38 comments }

Last offseason, Adam Steele helped administer a Wisdom of Crowds experiment on running backs and quarterbacks. Today, an update from Adam, along with some news. Below are Adam’s words:


Thanks to the opportunities Chase has given me at FP to publish my research and writing, I’ve decided to branch off and start my own website, quarterbacks.com. Ultimately, my mission for this site is to build the most complete database of NFL quarterbacks on the internet, a resource for statistics, history, opinion pieces, and FP-esque engagement among the readership. However, I can’t do this alone, so consider this an open invitation to the FP faithful to collaborate with me for this admittedly ambitious project. I welcome all types of submissions, including custom stats you’d like to publish and op-eds about anything related to NFL quarterbacks. If you think a certain QB is overrated or underrated and want to make a case for him, send it to me! At this juncture, the site is still under construction, and it will be a month or two before anything is published, so consider this the foundation building stage. For any aspiring writers out there, I’d like to help give you the same opportunity Chase gave me. Please email all inquiries and submissions to quarterbacks1031@gmail.com.


Wisdom of the Crowds: Ideas

Last offseason, Football Perspective ran crowdsourcing experiments to determine the greatest quarterbacks and running backs of all time. Given the amount of interest the community showed in WotC, I will be running more crowdsourcing projects this offseason! Before any votes are cast, I want your feedback on what you’d like to see in this year’s iterations. I definitely want to run a WotC for wide receivers (didn’t happen last year) and quarterbacks again (draws by far the most interest), but I’m certainly open to doing more if the readership desires. What other positions or units would you like to see crowdsourced?

Last year there were three main problems that I’d like to address and fix before the next go-around:

1) Lack of precision from ordinal rankings. An ordered list may be the simplest method to evaluate players, but it’s not the most accurate. Ordinal rankings don’t allow the voter to show the magnitude of difference between players. For example, if you think two players are head and shoulders ahead of the pack, that won’t be reflected in the linear gap between #2 and #3. My proposed solution is to switch from rankings to ratings, most likely on a 1-10 scale.

2) Difficulty comparing players across eras. It’s hard to compare a modern player with someone from the 50’s, and a number of participants last year voiced their struggle in dealing with this. I think the best solution is to separate players into groups based on their era, then rate all the players from each era together. This would help voters put players in proper context, knowing that we’re evaluating them only in relation to their direct peers. I would then take the winner from each era and put him in a pool for the overall GOAT title, which would involve a re-vote.

3) Voters accidentally leaving players off their ballot. Even for a football historian, it’s a daunting task to pick out X number of players from everyone in history who’s ever played the position. With an open ballot, it’s easy to forget a few players by accident, which several participants lamented in last year’s edition. This year, I’d strongly prefer to use a ballot with a predetermined pool of players for each participant to rate. I’m thinking maybe 15-20 players per era depending on the position. This solves the issue of forgetting players, forces voters to think about players they might not otherwise have, and provides statistical symmetry since every player will receive the same number of ratings.

Now I’ll open the forum to the FP readership. What do you think of my proposed changes? For those of you who participated last year, what did you like and dislike about it? I welcome any suggestions to make Wisdom of the Crowds a better experience for all!

Oh, and one note from Chase: does anyone have any recommendations on how to automate this process? That would obviously save us lots of time on the back end.

{ 23 comments }

Guest Post: QB Playoff Support: Part II

Adam Steele is back, this time with some playoff support stats for eight more quarterbacks. You can view all of Adam’s posts here.


Two weeks ago, I published a study detailing the playoff supporting casts of Tom Brady and Peyton Manning. Today I’m going to look at eight more notable quarterbacks under the same microscope. Below are the career tables for each QB, in no particular order. [continue reading…]

{ 57 comments }

Guest Post: Brady vs. Manning and Playoff Support

Adam Steele is back, this time throwing his hat into the never-ending Brady/Manning debate. Fortunately, this isn’t your typical Brady/Manning post, as Adam brings some new stats to the table. You can view all of Adam’s posts here.


By any statistical measure, Tom Brady and Peyton Manning have performed at a nearly identical level in the postseason. Of course, many observers don’t care about passing statistics, and prefer to judge quarterback based on playoff W/L record alone. And as we all know, Brady has a significant edge over Manning in this regard. But if we’re going to judge quarterbacks by the performance of their entire team, it’s only fair to also evaluate the parts of the team the QB has no control over – defense and special teams.

Using PFR’s expected points estimations, I recorded the defensive and special teams EPA for Brady’s and Manning’s teams in each of their playoff games. The “Support” column is the total EPA contributed by defense and special teams. Brady first: [continue reading…]

{ 91 comments }

Guest Post: Marginal YAC, 2015 in Review

Adam Steele is back to discuss Marginal YAC, this time in the context of the 2015 season. You can view all of Adam’s posts here.


Marginal Air Yards: 2015 Year In Review

Today I will be updating my Marginal Air Yards metric for the now completed 2015 season. New readers who aren’t familiar with Marginal Air Yards can get up to speed by reading my three part intro-series and 2014’s year in review.

There were 44 quarterbacks who threw at least 100 passes in 2015, and they are ranked by mAir below: [continue reading…]

{ 15 comments }

Guest Post: Questioning ANY/A

Adam Steele is back for another guest post. And, as always, we thank him for that. You can view all of Adam’s posts here.


Within the analytics community, we seem to have reached a consensus that ANY/A is the best box score metric for measuring passing efficiency. Over at the Intentional Rounding blog, Danny Tuccitto tested the validity of ANY/A using a technique called Confirmatory Factor Analysis. You can read his three part analysis here, here, and here. Essentially, he discovers that Y/A and TD % are valid statistics for measuring QB quality, while sack % and INT % are not. At first I was skeptical, but after some pondering I came up with a half-baked theory of why this might be true:

As we evaluate the potential for an athlete to succeed in professional sports, there are two kinds of statistics: Qualifying and Disqualifying. In the case of quarterbacks, I define a qualifying statistic as a minimum threshold the player must meet to even be considered NFL worthy. If we deconstruct ANY/A into its four components, Y/A and TD % emerge as qualifying statistics. In today’s NFL, I estimate that a QB must possess a true talent level of at least 6.0 Y/A and 2.5 TD % to deserve a roster spot. There are very few people in the world who can reach those thresholds against NFL caliber defenses (my best guess is around 100). With these two simple statistics, we’ve already weeded out the vast majority of quarterbacks from ever playing in the NFL.

Next, we turn to sack % and INT %, which are disqualifying statistics. By themselves, neither of these skills qualify a QB to play in the NFL. Anybody can avoid sacks or interceptions if they’re not worried about gaining yards. However, the inability to avoid sacks or interceptions will disqualify a QB from the NFL, regardless of how high his Y/A and TD % might be. I estimate these limits as roughly a true talent 12% sack rate and 4.5% INT rate. The population of quarterbacks who can stay under these limits AND perform above the minimum Y/A and TD % is very small. In most years, there aren’t enough of these QB’s to fill the 32 NFL starting spots. Among quarterbacks who receive significant NFL playing time, there is a strong survivorship bias for the disqualifying statistics of sack % and INT %, as the quarterbacks who make too many negative plays have already been weeded out of the sample. Given that Y/A and TD % are far rarer skills with no upper limits, these two statistics are the true measuring stick at the NFL level.

To test this theory, I created a very simple metric called Positive Yards Per Attempt (PY/A). It’s just passing yards plus a 20 yard bonus for touchdowns, divided by pass attempts (which does not sacks). I then converted PY/A into a value metric by measuring it relative to league average (RPY/A) [1]Note that in calculating league average, I excluded the player in question from the league average totals. So each player is compared to a slightly different definition of league average. and VALUE above average by multiplying RPY/A by attempts. We already have these variations of ANY/A (that is, RANY/A and VALUE), so comparing the two metrics is very straightforward. Since the merger, there have been 1,423 QB seasons of with least 200 dropbacks. This table lists the top 100 seasons of PY/A VALUE, as well as the ANY/A VALUE and rankings for these players. The “Diff” column signifies the gap in ranking between the the two metrics, with a positive number indicating a QB who is favored by PY/A and negative number favoring ANY/A.

This list makes a strong case for the validity of PY/A. It’s populated by the greatest QB seasons of all time at the top, and filled out by a number of other notably great and very good seasons. There are a few head scratchers (most notably Lynn Dickey at #9), but for the most part it’s a very credible list that closely mirrors the ANY/A rankings. That’s the point, really. When we remove sacks and interceptions from ANY/A, it doesn’t lose much accuracy, if any. At first glance, I was concerned that PY/A systematically overrates certain quarterbacks and underrates others. That’s probably true to a certain degree. However, I would argue that ANY/A has the same issue, except it’s a different set of quarterbacks who are over- and underrated by it. The true balance almost certainly lies somewhere in between the two metrics. FWIW, the correlation between RPY/A and RANY/A is a robust 0.877, with an r-squared of 0.769.

Now lets look at the other end of the spectrum – the 100 worst PY/A VALUE seasons since 1970.

I actually find the Worst list even more validating of PY/A than the Best list. When we think of bad quarterbacks, most us reflexively focus on quarterbacks who make a lot of mistakes and sink their teams in obvious and memorable ways. And this list is filled with conventionally terrible quarterbacks. But remember, nearly all of their negative plays have been removed, so it’s not their mistakes putting them on the list. It’s their impotence. These guys couldn’t make plays or move the ball down the field, killing their teams slowly and agonizingly. At the very top (err, bottom), we find Derek Carr’s rookie year. A lot of fans and pundits classify Carr as a budding franchise QB who showed “flashes of potential”. Actually no, he showed the exact opposite. While the younger Carr avoided sacks and interceptions at a reasonable rate, his Y/A was absolutely pathetic. Even accounting for his lousy supporting cast, that is a major red flag. It’s much easier for a young QB to reign in his mistakes than it is for him to suddenly learn how to make positive plays down the field. Blake Bortles fits precisely the same troubling profile, so I don’t have much hope for the class of 2014.

Does this change your feelings about ANY/A? Do you think Danny and I are wasting our time? If anyone else has created their own passing metric using basic stats, I’d love to hear about it.

References

References
1 Note that in calculating league average, I excluded the player in question from the league average totals. So each player is compared to a slightly different definition of league average.
{ 35 comments }

Guest Post: Touchdown Pass Vultures

Adam Steele is back for another guest post. And, as always, we thank him for that. You can view all of Adam’s posts here.


During the 2014 season, Chase noted that the league-wide touchdown pass rate was the highest it had been since the NFL merger. The final few weeks of the season dragged down the average a little bit, but 2014 still checks in as the most touchdown pass friendly year in NFL history. In response, a few commenters cited the possibility that teams were tallying more TD passes by sacrificing TD runs, which is a logical conclusion considering the very low rate of rushing touchdowns in 2014 (teams averaged 0.74 per game, the lowest since 1999). Today, I’m going to look into this further and see if teams really are inflating their passing TD numbers at the expense of the run.

First, we have to establish a historical baseline, and I did this by looking at every NFL season since 1950. [1]AFL numbers were not included. In that time frame, teams averaged 2.26 offensive touchdowns per game, with 1.35 of those coming via the pass and 0.91 via the run. Translated into a ratio, offensive touchdowns have historically been 59.6% passing and 40.4% rushing. That 59.6% is the key number here, as it will be the baseline ratio for expected passing touchdowns. Below is a chart containing relevant information for each year since 1950. The “PaTD %” column represents the percentage of offensive touchdowns in a given year that were scored via the pass, and the “Inflation” column compares that year’s passing TD ratio with the historical average of 59.6%.

As you can see, 2014 really did feature highly inflated passing TD totals, with 68.0% of offensive touchdowns coming through the air. This trend began in 2010, stabilized for four years, then jumped again significantly last season. The most obvious explanation is that teams are now passing more in general, so it would follow that they would also pass more to score touchdowns. But that’s only part of the story, as the rate of passing touchdowns has far outstripped the rate of overall called passes.

The main culprit appears to be goal line play selection, which has heavily favored the pass in recent seasons. Interestingly, from 1997-2009, there was no trend whatsoever, with passing TD ratios jumping around randomly from season to season. From 1980-1994, passing TD ratios were slightly lower, yet still very random. Even during the dead ball era of the 1970s, when the rules made passing far more difficult than it is today, teams still scored more often with passes than they did with runs. In fact, the famous 1956 season was the only time in the last 65 years where teams scored more rushing touchdowns than passing touchdowns.

But here’s what fascinates me the most: Despite the huge increases in total yardage and passing efficiency in recent years, offensive touchdowns have increased very little. In 2014, teams scored only 0.06 more offensive touchdowns than the historical average. In fact, the top 15 seasons for offensive TD production all came before the merger! If the NFL had been playing a 16 game schedule in the ’50s and ’60s, TD pass totals would be very similar to what we see today, and rushing TD totals would be higher.

So how does all this affect touchdown records for various quarterbacks? Since the 16 game schedule began in 1978, there have been 51 teams who scored at least 50 offensive touchdowns in a given season. Of those 51 teams, 33 of them had passing TD ratios above the historical average of 59.6%. In this chart, I list the primary QB, although the numbers represent team totals. The “Adjusted Pass TD” column is calculated by multiplying offensive touchdowns by .596, calculating how many TD passes would have been thrown by sticking with the historical average ratio. The “Change” column represents the difference in adjusted TD passes compared to actual TD passes, basically measuring how many TD pass were vultured from the run game.

I have plenty of thoughts about this chart, but I’m more interested to see what the readers think. Does this analysis change your opinion of any of these great QB seasons?

References

References
1 AFL numbers were not included.
{ 12 comments }

The GOAT.

The GOAT.

On February 20th, Football Perspective hosted a “Wisdom of Crowds” election with respect to the question: Who is the Greatest Running Back of All Time?™ Well, Football Perspective guest commenter Adam Steele offered to count the ballots, and I’ll chime in with some commentary.

There were 41 ballots entered, with each person ranking his or her top 20 running backs. The scoring system was simple: 20 points for a 1st place vote, 19 for a 2nd place vote, and so on. As it turns out, the race for the top spot was heated, with three players running away from the pack.

This chart is sortable by total points, points per ballot (using 41 as the denominator), GOAT votes, top 5 votes, and top 10 votes. In the interest of statistical significance, a player needed to appear on at least five ballots in order to be ranked in the table below. [continue reading…]

{ 113 comments }

Beginning on Friday the 6th, Football Perspective hosted a “Wisdom of Crowds” election with respect to that age old question: Who is the Greatest Quarterback of All Time?™ Well, Football Perspective guest commenter Adam Steele offered to count the ballots and provide a summary. What follows are his words, and the results from the contest.


Two of the greatest  quarterbacks of all time

Two of the greatest quarterbacks of all time

First, I want to offer my sincere appreciation to all the readers who participated in this project, as it wouldn’t have been possible without your contributions. We generated over 300 comments and lots of great discussion. And, as you’re about to see, every vote really did matter.

After tallying 80 ballots, 2,000 votes, and 26,000 ranking points, the difference between first and second place was just eight points. That’s insane. Well, I won’t tease you any longer, so here are the results:

This chart is sortable by total points, points per ballot (using 80 as the denominator), GOAT votes, top 10 votes, and top 25 votes. In the interest of statistical significance, a player needed to appear on at least five ballots in order to be ranked in the table below. [continue reading…]

{ 159 comments }

[Update: You can view the results from our 80 ballots here.]

Regular guest contributor Adam Steele has offered to administer a Wisdom of Crowds edition of the GQBOAT debate. And we thank him for that.


Who is the Greatest Quarterback of All Time? This is a fun question to debate because there is no absolute right answer. In recent years, the practice of crowdsourcing has gained momentum in the analytics community, in some cases yielding more accurate results than mathematical models or expert opinions. For the uninitiated, here’s the gist: Every human being represents a data point of unique information, as all of us have a different array of knowledge and perspective about the world. Therefore, when you aggregate the observations of a group of people, they will collectively possess a greater and more diverse reservoir of knowledge than any single member of the group.

The readers of Football Perspective are an insightful bunch with areas of expertise spanning the entire football spectrum; we are the perfect group for crowdsourcing an age old football question. If you’d like to participate in this experiment, there are just a few guidelines to follow:

1. Create a list of the top 25 quarterbacks of all time, in order, using any criteria you believe to be important. I encourage readers to be bold in your selections – don’t worry about what others may think.

2. Commentary is not necessary, but most definitely welcome. In particular, I’d enjoy seeing a short blurb explaining the criteria you based your selections on.

3. Please compile your rankings BEFORE reading anyone else’s. Crowdsourcing works best when each source is as independent as possible.

4. Please DO NOT use multiple screen names to vote more than once.

I’ll give readers a week or so to cast their ballots, then analyze the results in a follow-up article. A first place vote is worth 25 points, second place 24 points, and so on. Let the process begin!

{ 344 comments }

Guest Post: Marginal YAC, 2014 in Review

Adam Steele is back to discuss Marginal YAC, this time in the context of the 2014 season. You can view all of Adam’s posts here.


Manning is more of a downfield thrower than you think

Manning is more of a downfield thrower than you think

Back in September, I posted a three part series introducing Marginal Air Yards and Marginal YAC. Today, I’m going to update the numbers for 2014 and analyze some interesting tidbits from the just completed season. [1]A big thanks to Chad Langager at sportingcharts.com for helping me compile this data.

League-wide passing efficiency reached an all-time high in 2014 with a collective 6.13 Adjusted Net Yards per Attempt average. However, this past season was also the most conservative passing season in NFL history; 2014 saw the highest completion rate ever (62.6%), the lowest interception rate ever (2.5%), and also the lowest air yards per completion rate ever (5.91 Air/C). Passing yards were comprised of 51.4% yards through the air and 48.6% yards after the catch, the most YAC-oriented season in history. [2]Even though YAC data only goes back to 1992, I feel safe in using the phrase “all-time” with regard to YAC dependency. The offensive schemes of yesteryear emphasized downfield passing, which … Continue reading This trend shows no sign of reversing itself, so expect more of the same in 2015.

Here are the 2014 Marginal Air Yards (mAir) and Marginal YAC (mYAC) for quarterbacks with at least 100 pass attempts. The 2014 leader in Marginal Air Yards is…Peyton Manning? Yes, the noodle-armed, duck-throwing, over-the-hill Peyton Manning averaged 4.54 Air Yards per pass Attempt; given that the average passer on this list averaged 3.70 Air Yards per pass Attempt, this means Manning averaged 0.84 Air Yards per Attempt over average. Over the course of his 597 attempts, this means Manning gets credited with 500 marginal Air Yards, the most of any quarterback in the NFL. [continue reading…]

References

References
1 A big thanks to Chad Langager at sportingcharts.com for helping me compile this data.
2 Even though YAC data only goes back to 1992, I feel safe in using the phrase “all-time” with regard to YAC dependency. The offensive schemes of yesteryear emphasized downfield passing, which generated far less YAC than the short passing games of today.
{ 12 comments }

Guest Post: Are Interceptions Overrated?

Guest contributor Adam Steele is back again. You can read all of Adam’s articles here.


Are Interceptions Overrated?

There’s nothing worse than throwing an interception. Everyone seems to agree on this, from fans to media to advanced stats guys. But is it really true? In this quick study, I looked at the tradeoff between interception avoidance and aggressive downfield passing to see which strategy has a larger impact on winning. To measure this, I created two categories of quarterbacks: Game Managers and Gunslingers.

First, the Game Managers, which includes all post-merger quarterback seasons with an INT%+ of at least 110 [1]Which means the player was at least 0.67 standard deviations better than league average at avoiding interceptions. and a NY/A+ of 90 or below (min 224 attempts). [2]Which means the player was at least 0.67 standard deviations worse than league average in net yards per attempt. These guys avoided picks but failed to move the ball efficiently, the hallmark of a conservative playing style.

[continue reading…]

References

References
1 Which means the player was at least 0.67 standard deviations better than league average at avoiding interceptions.
2 Which means the player was at least 0.67 standard deviations worse than league average in net yards per attempt.
{ 27 comments }

Adam Steele is back for his third guest post in his Marginal YAC series.


In my two previous two posts, I introduced Marginal YAC and Marginal Air Yards. Today, I’m posting the career mYAC and mAir for the 96 quarterbacks with at least 1,000 pass attempts from 1992-2013. There’s a lot of data here, so I’ll let the readers do most of the commentary.

Here is a table of career Marginal YAC. The “Per 300” column is the rate of mYAC per 300 completions, or roughly equivalent to one full season. And on a “per season” basis, no quarterback benefited more from YAC than Steve Young, who also had four top-40 seasons. [continue reading…]

{ 1 comment }

In early September, Adam Steele, a longtime reader and commenter known by the username “Red” introduced us to his concept of Marginal Yards after the Catch. Today is Part II to that post. Adam lives in Superior, Colorado and enjoys digging beneath quarterback narratives to discover the truth; hey, who can blame him?


Introducing Marginal Air Yards

There are three components of Y/A: Completion %, Air Yards/Completion, and YAC/Completion. In my last post I looked at YAC, so today, let’s look at the other two components. By multiplying completion percentage and air yards per completion, we get air yards per attempt, which we can then modify to create Marginal Air Yards (mAir):

mAir = (Air Yards/Attempt – LgAvg Air Yards/Attempt)*Attempts

Here are the yearly Air Yard rates since 1992, with the table sorted by Air Yards per Attempt:: [continue reading…]

{ 15 comments }

Just above these words, it says “posted by Chase.” And it was literally posted by Chase, but the words below the line belong to Adam Steele, a longtime reader and commenter known by the username “Red”. And I thank him for it. Adam lives in Superior, Colorado and enjoys digging beneath quarterback narratives to discover the truth; hey, who can blame him? One other house-keeping note: I normally provide guest posters with a chance to review my edits prior to posting. But due to time constraints (hey, projecting every quarterback in the NFL wasn’t going to write itself!), I wasn’t able to engage in the usual back and forth discussion with Adam that I’ve done with other guest posters. As a result, I’m apologizing in advance if Adam thinks my edits have changed the intent of his words. But in any event, sit back and get ready to read a very fun post on yards after the catch. When I envisioned guest submissions coming along, stuff like this is exactly what I had in mind.


Introducing Marginal YAC

A quarterback throws a two yard dump off pass to his running back, who proceeds to juke a couple defenders and run 78 yards into the endzone. Naturally, the quarterback deserves credit for an 80 yard pass. Wait, what? Sounds illogical, but that’s the way the NFL has been keeping records since 1932, when it first began recording individual player yardage totals. The inclusion of YAC — yards after the catch — in a quarterback’s passing yards total can really distort efficiency stats, which in turn may distort the way he is perceived.

In response, I created a metric called Marginal YAC (mYAC), which measures how much YAC a quarterback has benefited from compared to an average passer. Its calculation is very straightforward:

mYAC = (YAC/completion – LgAvg YAC/completion) * Completions

I have quarterback YAC data going back to 1992 for every quarterback season with at least 100 pass attempts. [1]This data comes courtesy of sportingcharts.com. It’s obviously unofficial, but there doesn’t seem to be any noticeable biases from one team to another. Some unofficial stats, such as … Continue reading That gives us a healthy sample of 965 seasons to analyze, and includes the full careers of every contemporary quarterback. But first, let’s get a sense of what’s average here. The table below shows the league-wide YAC rates since 1992: [continue reading…]

References

References
1 This data comes courtesy of sportingcharts.com. It’s obviously unofficial, but there doesn’t seem to be any noticeable biases from one team to another. Some unofficial stats, such as passes defensed or quarterback pressures, can vary wildly depending on the scorekeeper, but Sporting Charts’ YAC stats seem pretty fair, from what I can tell. Here is a link to the 2013 data. Chase note: I have not had the chance to compare these numbers to what is on NFLGSIS, but that’s a good idea.
{ 23 comments }
Next Posts