
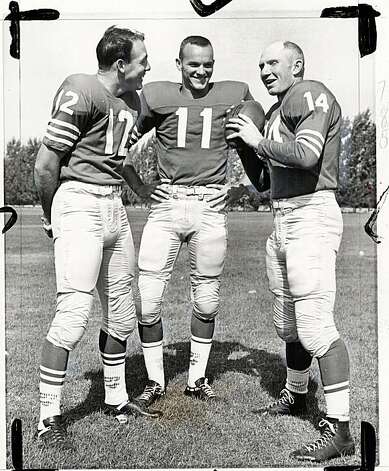
Brodie (left) and Tittle (right) on the 49ers. Photo by Associated Press/1960 Photo: 1960, Associated Press.
I thought it would be interesting to see if certain statistics could help identify teams that ran a West Coast Offense. My initial thought was that an effective West Coast Offense would manifest itself in three key statistics:
- Completion percentage. The WCO is built around short passes that work as a substitute for running plays. These long handoffs lead to high completion percentages for the quarterback.
- Yards per completion. Short passes imply lower yards per completion. Ideally, we’d analyze yards per completion after removing yards after the catch, but that’s not something the NFL kept records of historically. Still, I think a low yards per completion average can be a good indicator that a team ran a West Coast Offense.
- Passing first downs. In a West Coast Offense, teams are moving the chains through the air. With fewer long gains and a pass-first mentality, one would expect a lot of passing first downs.
Background
If you’re a historian, you can skip this section. The classic story told about the birth of the West Coast Offense takes us back to before the AFL-NFL merger. In 1969, the Bengals had Paul Brown as head coach and Bill Walsh as the assistant coach/offensive coordinator. That year, quarterback Greg Cook had one of the great rookie seasons in history, but injuries to his rotator cuff and biceps ruined his career. The team turned to backup Virgil Carter, a very smart and accurate passer but who was destined to be a backup because of his size and weak arm. Those factors led Walsh and Brown to implement an offense that catered to Carter’s strengths and hid his weaknesses.
Carter wasn’t just smart for football. In 1970, he published a seminal paper that was the precursor to the Expected Points models we see today; in ’71, Carter led the NFL in completion percentage, but ranked third to last among the 21 qualifying quarterbacks in yards per completion. The Bengals ranked 9th in passing first downs, and those statistics seem to jive with the picture we all have in our heads of a West Coast Offense.
[continue reading…]
