≡ Menu

I tweeted this 10 days ago:

Tampa Bay’s passing attack was very good this year, and it was also very underrated last year. In 2017, Jameis Winston led all quarterbacks in percentage of pass attempts that picked up a first down. And while Winston and Ryan Fitzpatrick both had ups and downs in 2018, after Winston replaced Fitzpatrick in week 11, he played like one of the best quarterbacks in the NFL over the last two months (just like he did in 2017). Winston’s biggest problem has been turnovers, but given that he just turned 25 years old last week, I don’t think his career is set in stone. And we know that interception rates are pretty random from year to year, so there is a good chance Winston can bring his interception rate under control.

The big question, though, is can Winston keep being one of the game’s best players at picking up huge chunks of yards while limiting his turnovers? Well, his 2019 is off to a good start, as he just found his perfect coach: Bruce Arians has come out of retirement to coach the Bucs. It is telling that Arians only was willing to re-enter the NFL to coach the Browns and Baker Mayfield or Tampa Bay and Winston. And that is not too surprising, at least not to me: Winston is, in my opinion, capable of becoming the next Carson Palmer and playing at an All-Pro level under the right coach. And I am sure that Arians seems a lot in Winston that he saw in Palmer, particularly when it comes to the vertical passing game.

The graph below shows each quarterback season (with at least 224 pass attempts) since 2015. The X-Axis shows how many air yards (i.e., yards in the air the football traveled) each passer gained, on average, on all pass attempts. The Y-Axis shows how many air yards (which excludes yards gained after the catch) each passer gained, on average, on completed passes. The quarterbacks that stand out the most during the last four years are Palmer and Winston (and Fitzpatrick on the 2018 Bucs). [continue reading…]

{ 1 comment }

The Bucs offense continues to fascinate me. Whether it’s Ryan Fitzpatrick or Jameis Winston, this passing offense continues to be very good but also very turnover prone. Tampa Bay has completed 67.0 percent of passes this season, but the Bucs have also thrown interceptions on 5.1% of all passes. We all know that interception rates have been falling and completion percentage rates have been rising over the last few decades. So let’s put these outlier stats in perspective.

Before the 2018 Buccaneers, the last two teams to have interception rates at 5% or higher were the 2013 Giants and 2010 Vikings. In other words, it’s pretty unusual for this era. And a 67.0% completion rate is pretty rare for older eras. Consider:

  • The 1980 Houston Oilers, with a 35-year-old Ken Stabler, completed 63.9% of passes and threw an interception on 6.0% of passes; that’s the highest completion percentage in history among teams to throw an INT on 5% of passes, but the Bucs are currently on pace to shatter that mark.
  • The 2001 St. Louis Rams, behind Kurt Warner, completed 68.8% of passes and threw an interception on 4.0% of passes.  That’s the highest interception rate among teams to complete 67% of their passes or better; the 2010 Saints (68.1%; 3.3%) and 1993 49ers (67.6%; 3.2%) are the only other teams with a completion percentage above 67% and an interception rate higher than even 3%.  The Bucs are currently blowing that mark out of the water, too.

The graph below shows the completion percentage (X-Axis) and interception rate (Y-Axis) for every team since 1950.  I have put all of the 2018 teams, through 12 weeks, in red dots.  And then the 2018 Bucs are the black dot at (67%, 5%): [continue reading…]

{ 0 comments }

A couple of weeks ago, I wrote that over his 4-year career, Jameis Winston had been great at picking up first downs and also at throwing interceptions. Well, now that Ryan Fitzpatrick’s interception rate has ticked back up, the same is true for the 2018 Bucs as a whole.

Jameis Winston leads all players with a 6.8% interception rate through 9 weeks. But Fitzpatrick’s 3.8% interception rate puts him as the 5th most INT-prone passer of the first half of the ’18 season. On the other hand, there are just five players this season who have picked up first downs on 40% of their dropbacks so far: Jared Goff (43.2%), Patrick Mahomes (41.0%), and Philip Rivers (40.9%) — three of the top MVP candidates — and then Fitzpatrick (42.6%) and yes, Winston (40.4%).

On the team level, the Buccaneers have picked up a first down on 41.5% of dropbacks (calculated based on a league-high 148 passing first downs, divided by the team’s 333 pass attempts and 24 sacks).  The Rams lead the league in this metric at 43.3%, followed by Tampa Bay, Kansas City, the Chargers, and the Saints. The worst five teams are the Bills (22.2%), the Cardinals, the Browns, the Jets, and the Cowboys.

When it comes to interception rate, the Bills have the worst performance in that category, too, at 5.5%. But here, Tampa Bay ranks 2nd in the NFL at 5.1%. Usually, there’s a pretty strong relationship between these two categories: teams with good interception rates have good first down rates, and teams with bad interception rates have bad first down rates. Tampa Bay is a very… very large outlier. No other team ranks in the top 9 in first down rate and bottom 9 in interception rate, while Tampa Bay ranks 2nd and 2nd-from the bottom. The Bengals (11th-best 1st down rate, 10th-worst INT rate) are the only other team in the top/bottom 12 of both metrics, and the 49ers, Texans, and Lions are the only other teams in the top/bottom 15.

On the flip side, Baltimore and Washington are the anti-Bucs. The Ravens rank 25th in first down rate, but 9th (aka 24th-from-the-bottom) in interception rate, while the Redskins are 22nd in first down rate and 5th (aka 28th from the bottom) in interception rate.  Yes, Alex Smith is still your anti-gunslinger.

On the graph below, I have plotted where each team fares in first down rate (X-Axis) and interception rate (Y-Axis).  Interception rate is plotted in reverse order, so a low (good) INT rate is high in the graph; therefore, you want to be in the upper right corner of the graph.  The worst passing teams — the Bills, Cardinals, and Jets — are in the lower left corner of the graph.  And all alone in the bottom right? That’s where you’ll find Tampa Bay, the biggest passing outlier this season. [continue reading…]

{ 0 comments }

Ryan Fitzpatrick Just Had Two Of His Best Three Games

In the last 8 days, Ryan Fitzpatrick — sorry, journeyman, Harvard graduate Ryan Fitzpatrick — just produced two of the best games of his career.  He had one of the best games in recent memory in week 1, completing 21 of 28 passes for 417 yards and 4 TDs with no interceptions or sacks.  Today, against the defending Super Bowl champions in week 2 of the 2018 season, Fitzpatrick went 27 of 33 for 402 yards with 4 TDs, although he did add one interception and two sacks for nine yards.

Fitzpatrick averaged 17.75 ANY/A in week 1 on 28 dropbacks; if we use the NFL average ANY/A from 2017 as our estimate of what the average will be in 2018, this means he produced 332 Adjusted Net Yards of Value over average. Today, he averaged 12.49 ANY/A on 33 dropbacks, which is a still remarkable 230 ANY over average.

Fitzpatrick started his career with the Rams in 2005, then the Bengals, then the Bills, Titans, and Texans. In Houston, Fitzpatrick had the other remarkable game of his career: he went 24 for 33 for 358 yards and 6 TDs, averaging 14.48 ANY/A in a game against one of his many former teams, the Titans. Given the league average in ’14 of 6.14 ANY/A, this means Fitzpatrick had 276 ANY of value over average.

Then Fitzpatrick went to the Jets, and while he had some good games, it also produced the worst game of his career: a 6-interception disaster against the Chiefs that produced -356 ANY over average.

The graph below shows — color-coded, of course — each game of Fitzpatrick’s varied career.

Are Fitzpatrick’s last two games a mirage? You take a look at the graph and tell me…

{ 0 comments }

Predictions in Review: NFC South

During the 2013 offseason, I wrote 32 articles under the RPO 2013 tag. In my Predictions in Review series, I review those preview articles with the benefit of hindsight. Previously, I reviewed the AFC West, the NFC West, and the the AFC South. Today, the NFC South.

Who Will Win 2013 Head Coach of the Year, July 25, 2013

For reasons that are not quite clear to me, I have an unusual fascination with the Coach of the Year award. There’s no harder award to predict in all of sports, since the winner is essentially the coach of the team that had the least predictable (in a good way) season. Still, I threw my hat into the ring in 2014 and predicted that Sean Payton would win Coach of the Year. Here is what I wrote in July:

Rob Ryan is now in charge of a defense that ranked last in yards allowed, net yards per attempt allowed, rushing yards allowed, rushing yards per carry allowed, first downs allowed, Expected Points Added, and defensive DVOA. The 2012 Saints also ranked 31st in points allowed. Ryan himself won’t fix that, but first round pick Kenny Vaccaro should begin to help the problem secondary.

But the real reason for optimism is the always explosive Saints offense. Drew Brees, Jimmy Graham, and Darren Sproles are three of the more unique players in the NFL, and help give the Saints an outstanding passing offense. Of course, New Orleans passing attack was great before either Graham or Sproles arrived, as the Brees/Payton engine (with a dash of Marques Colston and Lance Moore) is at times unstoppable. …

Predicting who will win AP Coach of the Year is a fool’s errand, but I’m willing to put my chips on Brees and Payton leading the Saints to the playoffs in a “bounceback” year. The real question is whether that will be enough to convince the voters to select Payton.

As it turned out, Payton did lead a resurgent Saints team from 7-9 in 2012 to 11-5 in 2013; unfortunately for him, a playoff berth was not enough to get him Coach of the Year. That honor instead went to Ron Rivera, although in my eyes, Andy Reid was an immensely more deserving choice.

What can we learn: In week 16, the Panthers defeated the Saints on a touchdown pass with 28 seconds left in the game; had New Orleans won that game, the Saints would have finished 12-4 and won the division and a first round bye, knocking Rivera’s Panthers down to the 5 seed. Would that have been enough to swing the COTY award to Payton? Probably not, although it likely would have meant Reid would have won the honor. The Coach of the Year award remains impossible to predict.
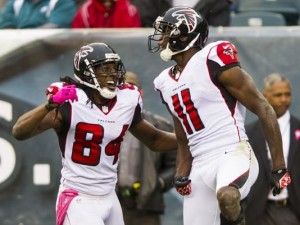
Did you just grab my torch?

Did you just grab my torch?.

Julio Jones and Roddy White star in Stealing The Torch, July 31, 2013

My other three NFC South posts were more walks down memory lane than predictions. The Falcons post was a look at other star wide receiver tandems that were similar to Julio Jones and Roddy White in 2012. This was a fun way to look at comparable receivers, but there was nothing fun about the Atlanta offense in 2013.  Jones averaged 116.0 yards per game last year, but that came over just five games. A foot injury suffered against the Jets in week 5 ended what looked to be a special season: Jones was leading the league in receptions (41) and was second in receiving yards (580) at the time. White, meanwhile, had an absymal start to his season that dragged on for months.

Hamstring and ankle injuries caused White to miss three full games and hampered his production in most of the others. At the end of November, he just 20 catches for 209 yards; at that point, the Falcons were 2-9, and I won’t fault you if you put Atlanta on “ignore” for the rest of the year. But White exploded with 43 catches for 502 yards in December, joining Josh Gordon (658) and Alshon Jeffery (561) as the only players with 500+ receiving yards in December 2013.

The Steve Smith Post, August 7, 2013

In August, I decided to compile the loose odds and ends I had collected on Steve Smith over the years. When the time comes, I plan on using that post to augment Smith’s Hall of Fame case. Unfortunately for Smith, the time may be coming sooner than he’d like. On December 1st, I wrote that Smith’s poor production may have been a reason for why Cam Newton’s numbers had declined.

Smith has had largely the same role in the Panthers offense for years, so it’s not unreasonable to compare his advanced metrics from each of Newton’s seasons.  In 2013, Smith caught 58.2% of his targets, which is in line with his production from 2012 (52.9%) and 2011 (61.2%). However, Smith started running much shorter routes — according to NFLGSIS, his average reception came just 8.9 yards downfield in 2013, compared to around 12 yards over the prior two years. Smith’s YAC also decreased (which is unusual, as shorter passes tend to lead to more YAC, making this another bad sign); as a result, his yards per target dropped from 10.8 in 2011 to 8.5 in 2012 to just 6.8 in 2013.  It was a down year in a Hall of Fame caliber career. Smith turns 35 in May; unfortunately, it seems safe to suggest that the best is behind him.

Can Tampa Bay Win the NFC South With the Worst Passing Attack?, August 13, 2013

Just about everyone assumed the Bucs would have the worst starting quarterback in the NFC South. What interested me was the rest of the team. The question I posed was more trivia than analysis: how often does the team with the worst passing attack in the division wind up winning the division?

The answer: Since 1950, only nine teams pulled off that feat, with nearly half of them coming since the league moved to a four-teams-per-division-for-each-division format in 2002. No team pulled off that feat in 2013, although the Panthers ranked 3rd in the NFC South in Adjusted Net Yards per Attempt. The team that ranked last in the division was, of course, the Bucs.

The Bucs ranked 32nd in NY/A and finished the year 4-12. But remember: Tampa Bay faced the hardest schedule in the league in 2013. Early DVOA estimates project the Bucs for 7.7 wins in 2014, and there are reasons for optimism in Tampa Bay in 2014.

{ 3 comments }

For sportswriters, Freeman is writer's block antidote.

I was not a big fan of Josh Freeman as a prospect — he was a mediocre college quarterback — but I think he can be a very good NFL quarterback. I wrote six paragraphs explaining why I liked Freeman in March, and nothing has changed since then. In the past few weeks, friends-of-the-program Bill Barnwell, Mike Tanier, and Danny Tuccitto have all weighed in on Freeman’s up-and-down 2012 campaign. Doug Farrar, with the help Joe Bussell (@NFLosophy), an Operations Assistant and Coordinator with the Bucs from July 2009 through January 2012, provided another interesting take on the Tampa Bay quarterback last week.

Much has been said about Freeman, so I think we’re officially at the “wait and see” point in the game. This may be the year he quiets all the doubters, or 2013 could be another setback season (see 2011). But here’s one thing we do know: in a division with Drew Brees, Matt Ryan, and Cam Newton, Freeman is widely considered the worst starting quarterback in the NFC South. Freeman ranked 16th in Adjusted Net Yards per Attempt last year, but that was still behind Brees (6th), Ryan (7th), and Newton (11th, which ignores the 741 rushing yards and 8 touchdowns he provided on the ground).

For the sake of argument, let’s say that Freeman is again the least valuable quarterback in the NFC South. What does that mean for Tampa Bay’s odds of winning the division? The Bucs had the league’s top rush defense in 2012, and traded for Darrelle Revis, signed Dashon Goldson, and drafted Mississippi State cornerback Johnthan Banks in the offseason. With Doug Martin and the return of guards Davin Joseph and Carl Nicks, the running game should be among the league’s best. You could argue that Tampa Bay could win the division without any improvement from Freeman, if the rest of the team is productive enough.

That made me wonder: how often does the team that ranked last in the division in Adjusted Net Yards per Attempt end up winning its division? As it turns out, pretty infrequently. Since 1950, only nine teams have pulled off that feat, with nearly half of them coming since the league moved to a four-teams-per-division-for-each-division format in 2002.
[continue reading…]

{ 4 comments }

We would like to start the bidding at Fort Knox.

We would like to start the bidding at Fort Knox.

This trade was a Win-Win-Win for all three sides. The Buccaneers received the best cornerback in the NFL when healthy, the perfect elixir for a team that ranked 1st against the run and 32nd against the pass in 2012. I’m a big fan of Josh Freeman, who should continue to improve as he matures. The Bucs were the 3rd youngest team in the NFL last year, making them a team on the rise. Adding Revis and Dashon Goldson to the secondary makes Tampa Bay an immediate playoff contender and a darkhorse Super Bowl contender.

Meanwhile, this is a big win for Revis, who received an incredible $96 million dollar contract and no longer has to worry about playing this season on a three million dollar base contract. Instead, he has a $13M base for each of the next six seasons, as well as a $1.5M workout bonus and $1.5M roster bonus in each season. By making $16M per season, he’s making just a hair below what Calvin Johnson and Larry Fitzgerald are making, and he’s trumped the averages per year going to Adrian Peterson and Chris Johnson. He’s making not just quarterback money, but elite quarterback money. The trade-off for that insanely high annual figure is that he has little protection. Technically, he has no guaranteed money, but absent a season-ending injury — and maybe not even that — he’s going to make at least $32M over the next two years. And unless he falls apart, he’ll pocket $48M from 2013 to 2015, an incredible three-year haul. It’s also a few million dollars more than what DeMarcus Ware, Terrell Suggs, and Clay Matthews received on their monster deals. Unless Tampa Bay cuts Revis after two years — in which case they would have paid $32M and lost a first round draft pick and obviously received very little — a deal with no guaranteed money isn’t particularly risky for Revis. In reality, zero guaranteed dollars is a red herring, and Revis will receive $40+M over the next three years even if Tampa Bay cuts him after year two or $48M if he stays on the team.
[continue reading…]

{ 5 comments }

Season in review: AFC and NFC South

Last week I reviewed the seasons of the teams in the AFC East and NFC East and in the AFC North and NFC North. Today we’ll review the interesting seasons from the AFC and NFC South divisions.

In the AFC South, I had the bottom three teams projected for between 5 and 6 wins for a five week stretch starting after week two. As we now know, that was resolved quite definitively by the end of the year:

AFC South

Houston Texans

Pre-season Projection: 10 wins
Maximum wins: 14 (after week 15)
Minimum wins: 10 (after week 1)
Week 1 comment: Going to win the AFC South going away; this team could win 12 games, but concerns about injuries and the potential to rest starters late keep them at 10 wins for now.

A miserable December ruined what should have been a marvelous season in Houston. At no point did I project any of the other AFC South teams to finish within even three games of the Texans. When they were 5-0, I wrote: Not only do the Texans still have 6 home games remaining, but they have 4 more games against the AFC South and get the Bills and Lions. Even without Brian Cushing, I don’t see why they don’t win 8 more games.

The Texans schedule was easy, but they also had dominant seasons out of J.J. Watt and Andre Johnson. Left Tackle Duane Brown was outstanding, and Houston is as good as any other team in the league when they’re at their their best. Unfortunately, they might be undermanned in a gunfight with the Broncos or Patriots, and it looks like now they’ll have to beat both of those teams to get to New Orleans. Still, I give the Texans a fighting chance; Matt Schaub has struggled in primetime games, but that doesn’t really mean anything. In the end I think the week 17 loss submarined their playoff hopes, and the team will be left wondering how good they could have been if Cushing stayed healthy.

Indianapolis Colts

Pre-season Projection: 5.5 wins
Maximum wins: 10 (after week 12 through the end of the year)
Minimum wins: 4 (after week 1)
Week 1 comment: There will be growing pains in Indianapolis. But nobody feels bad for their fans, nor should they; the Colts will be contenders each year for a decade, starting next season.

I never got on board with the Colts this year and it only looks worse in retrospect. On the other hand, even though Indianapolis finished 11-5, they were still outscored by 30 points in 2012. They struggled to beat Brady Quinn and the Chiefs and split with the Jaguars. The Colts won just two game by more than a touchdown.

While I missed on the Colts overall, I was on board the Andrew Luck bandwagon early on even when his numbers were terrible. I wrote this before the Colts-Packers game: Andrew LuckAaron Rodgers I won’t steal the spotlight from Tom BradyPeyton Manning XIII; by the time these two teams play again in four years, we may be looking at the best two quarterbacks in the league. I highlighted how Luck was being undervalued by conventional statistics after week 7, and wrote this after week 8: A wildcard darkhorse? I don’t think the Colts are very good — they’re just 29th according to Football Outsiders — but a win over Miami this weekend puts them in the driver’s seat. I finally projected them at 10 wins after week 12, and noted: Basically clinched a playoff berth with win over Buffalo and Steelers loss. Hard not to like this team.

They may not be very good, but they certainly are likeable. Even after the upset win over the Texans, Houston is just the 10th team to make the playoffs after being outscored by at least 30 points.
[continue reading…]

{ 2 comments }

Under Raheem Morris, the Tampa Bay rush defense was always… what is the polite way to put this… accommodating to opposing running backs. Over Morris’ three-year tenure, the Buccaneers joined the Bills as either 31st or 32nd in all three major rush defense categories: rushing yards allowed, rushing yards per carry allowed, and rushing touchdowns allowed.

This was the case despite the organization’s best efforts to find players that could stop the run. The Buccaneers’ second selection in the 2009 draft was used on defensive tackle Roy Miller.  That season, Tampa Bay finished last in both rushing yards and rushing yards per carry allowed.   The following April, the Bucs used the third pick in the draft on Gerald McCoy and the 35th selection on Brian Price, making them the rare team to take multiple interior defensive linemen with top-40 picks.  That season was the one successful year of Morris’ tenure, but Tampa Bay still finished 28th in rushing yards allowed and 31st in yards per rush allowed.

Linebacker Lavonte David has been a monster for Tampa Bay.

So Tampa continued to focus on the defensive line in the 2011 draft, this time taking Iowa’s Adrian Clayborn and Clemson’s Da’Quan Bowers with their first and second round picks and middle linebacker Mason Foster in the third round. In 2011, Tampa finished the year 32nd in rushing yards allowed, 32nd in rushing touchdowns allowed, and 31st in yards per carry allowed.

Enter Greg Schiano and defensive coordinator Bill Sheridan.  With a horrible run defense for three consecutive years, the Bucs couldn’t ignore the problem just because they had failed in prior attempts to plug the leak.  With the seventh pick, the team selected Alabama’s Mark Barron, an in-the-box safety who was considered one of the safest picks in the draft.

Schiano, Barron, McCoy, and second round pick Lavonte David (who was just named the NFC defensive rookie of the month for November) have completely reformed the Tampa rush defense. The team currently ranks first in both rushing yards and yards per rush allowed. That’s unbelievable. Nothing more could be said about the magnitude of a leap from 32nd to 1st, so let me close with a look at the biggest jumps in rushing yards allowed and rushing yards per carry allowed in NFL history.
[continue reading…]

{ 4 comments }

NYT Fifth Down: Post-week 11

This week at the Fifth Down, I look at the remarkable turnaround in Tampa Bay.  I argue that the success Tampa Bay is having this year dates back to the end of last year, when the organization decided to rebuild the offense with a clear image in mind.

Ten months ago, Tampa Bay Buccaneers General Manager Mark Dominik had a disaster on his hands.

The Bucs lost their final 10 games of the 2011 season and fired Coach Raheem Morris. The team ranked 27th in points scored, and quarterback Josh Freeman had regressed considerably in his third season.

In 2011, Freeman ranked 26th in Adjusted Net Yards per Attempt and led the N.F.C. in interceptions. Freeman had seemingly lost his way; he averaged a meek 10.4 yards per completion, placing him 33rd in the league and just barely ahead of weak-armed Colt McCoy (10.3).

If Freeman’s career had continued on this downward trajectory, Dominik would have become collateral damage. So in the off-season, Dominik rebuilt the team with a clear vision: he wanted an offense built around a strong running game complemented by a deep passing attack.

Dominik’s first move to was hire Greg Schiano, then the coach at Rutgers. The decision seemed odd at the time, especially in light of Tampa Bay’s flirtation with Oregon’s Chip Kelly. Kelly is considered an offensive mastermind, and Schiano is a defensive coach by trade. That meant the man Schiano would hire to coach his offense would be the most critical hire in Josh Freeman’s — and potentially Dominik’s — career.

Schiano didn’t have to venture far from Piscataway, N.J., to find his coordinator, Mike Sullivan, who was working as the Giants’ quarterbacks coach. The decision was considered risky because Sullivan had never called plays for the Giants, but he had a reputation for wanting to stretch the field with long passes in connection with a strong running game. In 2011, among the 25 quarterbacks that started at least 10 games and threw at least 300 passes, Eli Manning led the league in yards per completion.

In March, Tampa Bay signed wide receiver Vincent Jackson, who had starred for the Chargers. From 2008 to 2011, Jackson averaged 18.0 yards per catch, the highest average in the league over that span among players with at least 200 catches. During Jackson’s best season, in 2009, San Diego quarterback Philip Rivers led the league in yards per completion, signaling the effects an elite deep threat can have on a quarterback’s statistics.

Tampa Bay also signed the All-Pro guard Carl Nicks from division rival New Orleans, although he is now out for the year with a left foot injury. Finally, in the 2012 draft, the Buccaneers selected running back Doug Martin with the 31st pick in the first round. Martin has 1,000 rushing yards in 10 games and is leading the N.F.L. in yards from scrimmage.

By adding one of the game’s best deep threats, an excellent offensive lineman and a talented, all-purpose running back, along with finding the right offensive coordinator and  coach, Dominik put the pieces in place around his franchise quarterback. This year, Freeman is having a breakout season. Playing in Sullivan’s offense, alongside Jackson and Martin, has transformed Freeman into one of the game’s most valuable players. Consider that through 10 games in 2011, Manning’s Giants were 6-4 and he was averaging 8.2 Adjusted Yards per Attempt; through 10 games in 2012,  Freeman’steam is 6-4 and he is averaging 8.2 AY/A.
After ranking 26th in ANY/A last season, Freeman  ranks second in ANY/A and Net Yards per Attempt, my preferred predictive statistic of quarterback play, trailing only Peyton Manning in both categories. After ranking second to last in yards per completion last year, Freeman ranks second in that metric this season, just barely behind Cam Newton.

You can read the rest of the post here, which also includes a look at the crazy records set in the Houston-Jacksonville game and some other interesting week 11 stats.

{ 2 comments }

Not opposed to occasional acts of piracy.

Greg Schiano made an interesting comment the other day which went against conventional wisdom.

“It’s a fine line between being a physical, aggressive football team and getting a flag. You gotta be careful. I don’t ever want to be the least penalized team in the league, because I don’t think you’re trying hard enough then…. But I certainly do want to be in the top 10. That’s where you should be. You should be — five through 10 is a great place to be as a penalized team.”

Schiano’s statement makes some sense. Not all penalties are the same, even though they’re usually grouped that way. False starts, late hit penalties, excessive celebrations, delays of game and “12 men on the field” are examples of penalties that drive every coach crazy. When we think of undisciplined teams or stupid penalties, these are the ones we envision. Other penalties, like offensive holding or defensive pass interference might not be bad at all, and might be symptomatic of rational thinking. If a lineman believes the likelihood of his man getting to the quarterback is higher than the likelihood of him getting called for a penalty if he holds the defender, then holding may be the wise course of action. Similarly, a defensive back that tries to prevent a touchdown on pass interference isn’t necessarily committing a bad penalty. Intentional grounding is rarely a penalty that really hurts the team, as it’s usually called when for the quarterback, the alternative is usually a sack (or worse).

Off-sides, roughing the passer or certain penalties associated with hits (defensive receivers, leading with the helmet, etc.) are correlated with aggressive behavior. They should be minimized, of course, but I would not shocked to discover that they were generally correlated with positive play. The point being there are many types of penalties, an issue I’ve touched on before.

Still, I performed a regression analysis on penalties and team success. The results show that fewer penalties appears to be very slightly correlated with winning. A team with 80 penalties on the season would be expected to win 52.4% of its games, while a team with 100 penalties on the year would be projected to win 50.1% of its games. To jump just one win in a 16-game season, the results here indicate that a team would need to commit 54 fewer penalties. That’s absurd on its face,, which means that there is not necessarily a causal relationship between penalties and winning. Which is exactly what Schiano implied.

But we could break it down even further. I grouped all teams since 1990 into penalty ranges. As you can see, there does seem to be a small relationship between fewer penalties and winning:

Pen#TmsWin%
57 to 74330.535
75 to 901550.516
91 to 1092780.501
110 to 1291740.487
130-163330.451

Of course, this doesn’t go against what Schiano said. He didn’t want to be below average in penalties, just not number one. And I’m sure he’d want to be number one at avoiding stupid penalties. But I agree with him that the goal of a team shouldn’t be to avoid penalties at all costs, just like a team shouldn’t try to avoid interceptions at all costs. The goal is simply to win, and there being too aggressive isn’t the only option that carries with it a tradeoff — a team that isn’t aggressive enough is also unlikely to win championships.

[Updated: I realized that I might as well post the results of the teams to lead the league in fewest penalties and the eventual Super Bowl champs. The first table shows the team with the fewest penalties each season and how they performed in the post-season. On average, these teams won 9 games. The second table shows all Super Bowl champions since 1990 and where they ranked in penalties; on average, they ranked 12th in penalties.]

YrTeamWin%RecPenPost
2011GNB0.93815-176L-DIV
2011IND0.1252-1476--
2010ATL0.81313-358L-DIV
2009JAX0.4387-970--
2008NWE0.68811-557--
2007SEA0.62510-659L-DIV
2006DEN0.5639-767--
2005CAR0.68811-591L-CCG
2004SEA0.5639-779L-WILD
2003NYJ0.3756-1069--
2002KAN0.58-875--
2001NYJ0.62510-662L-WILD
2000NYJ0.5639-776--
1999ARI0.3756-1070--
1998CIN0.1883-1369--
1997TAM0.62510-677L-DIV
1996IND0.5639-776L-WILD
1995CHI0.5639-771--
1994CHI0.5639-765L-DIV
1993NWE0.3135-1164--
1992NOR0.7512-460L-WILD
1991MIA0.58-862--
1990MIA0.7512-464L-DIV

YrTeamWin%RecPenRk
2011NYG0.5639-79411
2010GNB0.62510-6783
2009NOR0.81313-38913
2008PIT0.7512-49519
2007NYG0.62510-6776
2006IND0.7512-4867
2005PIT0.68811-5996
2004NWE0.87514-21016
2003NWE0.87514-211122
2002TAM0.7512-410314
2001NWE0.68811-59215
2000BAL0.7512-49511
1999STL0.81313-311321
1998DEN0.87514-211516
1997DEN0.7512-411624
1996GNB0.81313-3926
1995DAL0.7512-4908
1994SFO0.81313-310916
1993DAL0.7512-49414
1992DAL0.81313-39111
1991WAS0.87514-2909
1990NYG0.81313-3835
{ 8 comments }