≡ Menu

The 2000 NFL Draft was the most wide receiver-heavy draft in NFL history. Peter Warrick, Plaxico Burress, and Travis Taylor went in the top 10 picks, Sylvester Morris and R. Jay Soward also went in the first round, and another eleven (11!) wide receivers went in the first 100 picks after that: Dennis Northcutt, Todd Pinkston, Jerry Porter, Ron Dugans, Dez White, Chris Cole, Ron Dixon, Laveranues Coles, JaJuan Dawson, Darrell Jackson, and Gari Scott.

In case you can’t tell by those names, the draft was a complete dud. Expected to revolutionize the NFL with a new wave of athletic wide receivers, the entire class combined to make just 1 Pro Bowl at wide receiver — Coles in 2003 (Dante Hall, drafted in the fifth round, would make two Pro Bowls as a returner). Coles, Burress, and Jackson were all good players, but they were also the only three to eclipse even 5,000 receiving yards.

Twenty years later, we are looking at the next “greatest wide receiver class” of a generation. Oklahoma’s CeeDee Lamb and Alabama’s Jerry Jeudy will be early first round picks; they are expected to be joined in the first round by Jeudy’s teammate, Henry Ruggs III, Clemson’s Tee Higgins, and possibly  LSU’s Justin Jefferson, Arizona State’s Brandon Aiyuk, or Colorado’s Denzel Mims.

I looked at the CBS 7-round mock draft and calculated the Draft Value used on wide receivers. Why CBS? Because they were the first website I found that put together a clean table of all draft picks for all 7 rounds, making it easy to calculate draft value. Draft value is simply calculated as the value assigned to each pick, according to my draft value chart, that is used on a wide receiver.

Based on the CBS projections — which has WRs going at 12, 14, 15, 21, 30, 34, 37, 42, 50, 51, and 58 — this would be an outstanding draft class for wide receivers. And while none would be selected in the top 10, there would be a total of 201.6 points of draft capital spent on wide receivers. That would make this one of the top 10 drafts for wide receivers since the common draft era beginning in 1967.

The graph below shows the draft capital used on the position in each draft since 1967. [continue reading…]

{ 0 comments }

Revisiting the Draft Value Chart

It has now been seven years since I created the Football Perspective Draft Value Chart (longtime readers know that at Pro-Football-Reference, I created something similar 11 years ago).

You can see all the values for the Football Perspective Draft Value Chart here and there’s a link on the home page to those same values embedded in the FP Draft Value Calculator. The FP chart was derived from analyzing drafts from 1970 to 2007, and by looking at the marginal Approximate Value produced by players in each of their first five seasons. In short, I gave players credit for all AV produced above 2 points of AV each year. If a player had AV scores of 0, 4, 1, 7, and 10, that translates to 15 marginal points. To create the Draft Value Chart, I simply calculated the average number of marginal points produced by each draft pick from ’70 to ’07 and smoothed out the results.

But now, with 7 more years of data, we can look at the drafts from 2008 through 2014, and see how those players have faced in their first 5 seasons. How has the FP Chart done since then?

When analyzing results over a small period, there will obviously be outliers. One out of every 7 players taken with the 75th pick doesn’t turn into Russell Wilson, one out of every 7 players taken with the 154th pick doesn’t turn into Richard Sherman, and so on. The 92nd pick, with T.Y. Hilton, Trai Turner, Cliff Avril, Joe Barksdale, Shawn Lauvao, and Jerraud Powers was extremely good at getting consistent starters (Stedman Bailey being the exception).

And even the number one picks have been very good over this stint: Jake Long, Matthew Stafford, Sam Bradford, Cam Newton, Andrew Luck, Eric Fisher, and Jadeveon Clowney is a pretty good stretch; JaMarcus Russell just missed the cut. Here are the average results from these 7 drafts in terms of marginal AV produced by these players in their first five years:

Now, how does that compare to the Football Perspective Drat Values? And what would the results from ’08 to ’14 look like if we smoothed the results? I’m glad you asked! I’ve reprinted the results below, but added the FP Draft Value Chart line in red, and a smoothed, best-fit line of the ’08 to ’14 results in blue.

On first glance, I have two immediate takeaways.

One, the FP Draft Value Chart looks pretty good: it’s directionally correct, and holds up over time and a small sample.  It doesn’t have the super steep decline of the JJ Draft Value Chart, which has the 3rd pick worth twice as much as the 11th pick, and the 11th pick worth twice as much as 35th pick.

The other takeaway is that almost all the picks are more valuable, and that is not a function of small sample size: it’s a function of the rookie wage scale. Players taken in the 3rd, 4th, and 5th rounds are now expected to contribute, because the bar has been lower.  If a 4th round pick costs a fraction of what a veteran costs, teams will be more willing to give that player a chance to produce even if he isn’t very good.  This artificially inflates AV, since AV is tied to metrics like starts and games played.  Teams are giving more starts and snaps to players on rookie contracts because of the rookie salary cap, and that leads to more AV — and distorts the draft value chart a bit.

My overall suspicion is the success of first overall picks from ’08 to ’14 distorts the steepness of the graph — it doesn’t appear like the 2nd and 3rd picks are doing any better than they used to — and that is likely due to small sample size (although the first overall picks since ’14 also seem pretty good so far, too!).   And on a relative basis, I am not sure much has changed in the draft value chart world.  But I do think it’s fair to acknowledge that draft picks are more valuable than they used to be and my Draft Value Chart implies, and that’s worth thinking about when teams trade multiple picks for one pick.

As always, please leave your thoughts in the comments.

{ 1 comment }

Draft Capital Used By Position: DB

Regular readers know all about the Football Perspective Draft Value Chart, which is derived from the approximate value actually produced by draft picks at each draft slot. Over the next week, I will be showing how much draft capital has been used to select players at certain positions in every draft since 1990. This will allow us to see how much the league’s view on the value of a position has changed, while also giving us a visual insight into the volatility among the talent in draft classes is from year-to-year.

I will be staying out of the commentary for now, so I encourage you to post your thoughts. To make comparison across positions easier, I will be using the same scale for each position. Let’s look at the graph for defensive backs: [continue reading…]

{ 1 comment }

Draft Capital Used By Position: LB

Regular readers know all about the Football Perspective Draft Value Chart, which is derived from the approximate value actually produced by draft picks at each draft slot. Over the next week, I will be showing how much draft capital has been used to select players at certain positions in every draft since 1990. This will allow us to see how much the league’s view on the value of a position has changed, while also giving us a visual insight into the volatility among the talent in draft classes is from year-to-year.

I will be staying out of the commentary for now, so I encourage you to post your thoughts. To make comparison across positions easier, I will be using the same scale for each position. Let’s look at the graph for linebackers: [continue reading…]

{ 2 comments }

Draft Capital Used By Position: DL

Regular readers know all about the Football Perspective Draft Value Chart, which is derived from the approximate value actually produced by draft picks at each draft slot. Over the next week, I will be showing how much draft capital has been used to select players at certain positions in every draft since 1990. This will allow us to see how much the league’s view on the value of a position has changed, while also giving us a visual insight into the volatility among the talent in draft classes is from year-to-year.

I will be staying out of the commentary for now, so I encourage you to post your thoughts. To make comparison across positions easier, I will be using the same scale for each position. Let’s look at the graph for defensive linemen: [continue reading…]

{ 3 comments }

Draft Capital Used By Position: OL

Regular readers know all about the Football Perspective Draft Value Chart, which is derived from the approximate value actually produced by draft picks at each draft slot. Over the next week, I will be showing how much draft capital has been used to select players at certain positions in every draft since 1990. This will allow us to see how much the league’s view on the value of a position has changed, while also giving us a visual insight into the volatility among the talent in draft classes is from year-to-year.

I will be staying out of the commentary for now, so I encourage you to post your thoughts. To make comparison across positions easier, I will be using the same scale for each position. Let’s look at the graph for offensive linemen: [continue reading…]

{ 3 comments }

Draft Capital Used By Position: TE

Regular readers know all about the Football Perspective Draft Value Chart, which is derived from the approximate value actually produced by draft picks at each draft slot. Over the next week, I will be showing how much draft capital has been used to select players at certain positions in every draft since 1990. This will allow us to see how much the league’s view on the value of a position has changed, while also giving us a visual insight into the volatility among the talent in draft classes is from year-to-year.

I will be staying out of the commentary for now, so I encourage you to post your thoughts. To make comparison across positions easier, I will be using the same scale for each position. Let’s look at the graph for tight ends: [continue reading…]

{ 3 comments }

Draft Capital Used By Position: WR

Regular readers know all about the Football Perspective Draft Value Chart, which is derived from the approximate value actually produced by draft picks at each draft slot. Over the next week, I will be showing how much draft capital has been used to select players at certain positions in every draft since 1990. This will allow us to see how much the league’s view on the value of a position has changed, while also giving us a visual insight into the volatility among the talent in draft classes is from year-to-year.

I will be staying out of the commentary for now, so I encourage you to post your thoughts. To make comparison across positions easier, I will be using the same scale for each position. Let’s look at the graph for wide receivers: [continue reading…]

{ 2 comments }

Draft Capital Used By Position: RB

Regular readers know all about the Football Perspective Draft Value Chart, which is derived from the approximate value actually produced by draft picks at each draft slot. Over the next week, I will be showing how much draft capital has been used to select players at certain positions in every draft since 1990. This will allow us to see how much the league’s view on the value of a position has changed, while also giving us a visual insight into the volatility among the talent in draft classes is from year-to-year.

I will be staying out of the commentary for now, so I encourage you to post your thoughts. To make comparison across positions easier, I will be using the same scale for each position. Let’s look at the graph for running backs: [continue reading…]

{ 6 comments }

Draft Capital Used By Position: QB

Regular readers know all about the Football Perspective Draft Value Chart, which is derived from the approximate value actually produced by draft picks at each draft slot. Over the next week, I will be showing how much draft capital has been used to select players at certain positions in every draft since 1990. This will allow us to see how much the league’s view on the value of a position has changed, while also giving us a visual insight into the volatility among the talent in draft classes is from year-to-year.

I will be staying out of the commentary for now, so I encourage you to post your thoughts. To make comparison across positions easier, I will be using the same scale for each position. Let’s start with the graph for quarterbacks: [continue reading…]

{ 6 comments }

Colleges, The NFL Draft, and Heat Maps Since 1990

You may recall that last year, I looked at which college conferences dominate the NFL draft. Today, I want to look at which teams have dominated the draft since 1990.  And while there are no surprises, it’s fun to put numbers to what we all can sense.  Here’s what I did:

1) Using these draft values, assign a value to every pick in every draft from 1990 to 2014.

2) Calculate the amount of draft capital assigned to each college team by summing the values from each draft pick for each player from that college.

3) Create a heat map of the results, where red = more draft value and blue = less draft value.

Below are the top 75 schools in draft value created over the last 25 years.  You won’t be shocked to see that Florida State ranks 1st, with its players being worth 1,165 points of draft value over that span.  And with Jameis Winston headlining a host of Seminoles expected to be drafted this year, Florida State can probably comfortably settle into that top spot for the foreseeable future. [continue reading…]

{ 3 comments }

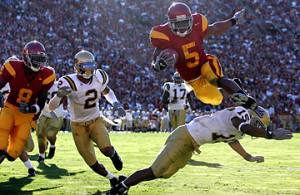
Bush played with some talented teammates at USC.

Bush played with some talented teammates at USC.

Last week, I wrote about whether having great college teammates might cause quarterbacks and wide receivers to be overvalued in the NFL draft. The results were inconclusive on the impact of teammates on quarterbacks, but they indicated that wide receivers who played with first-round QBs in college tended to underperform in the NFL relative to their draft position. Receivers such as Mike Williams of USC (#10 in 2005) and Marcus Nash of Tennessee (#30 in 1998) may have gone too high in the draft in part because they played with great college QBs who made them look good.

Today, I look at running backs drafted since 1984. I use a slightly different way of looking at the data that I think is a little better. I also revisit the QBs and WR/TEs with that method. Instead of considering the number of first-round college teammates that a player has, I consider the total draft value of college teammates at different positions, as determined by Chase’s chart. [1]I thank commenter Stuart for suggesting this approach in the comments to last week’s post. Going this way makes it possible to look at the entire offensive line’s value, for example, rather than just the number of players who were high picks.

For example, according to PFR’s Approximate Value (AV), Ki-Jana Carter is the biggest underachiever at RB relative to his draft position (since 1984). After being drafted #1 in 1995, he generated just nine points of AV in his first five years. [2]Carter averaged 3.3 yards on 227 carries over his first five injury-plagued seasons. Carter also had a lot of help from his friends in college. He ranks 10th out of 104 RBs picked in the top 32 in terms of the total value of his college offensive linemen according to my measure. His tight end also went in the top ten in 2005; Carter would be 2nd in total line value if we included TEs. Two of his offensive lineman went in the first round in the following year. Two Penn State fullbacks were drafted that year, too. [3]Two Penn State halfbacks were drafted in 1996, as well. One of them was Stephen Michael Pitts, who went to Middletown High School South (NJ), a school that also graduated Knowshon Moreno and, only … Continue reading Could Carter have looked better than he was because he ran behind those great college blockers? Or is the NFL success of the running back who ranks fourth in terms of offensive line help (Warrick Dunn) more representative of RBs, in general?

In addition to looking at the offensive line, I’ll consider whether the total value of college teammates at other offensive positions predicts that running backs become overvalued in the draft. While we might think that RBs are particularly dependent on line help, it actually appears that having a great QB is again the one clear predictor for players being overvalued. [continue reading…]

References

References
1 I thank commenter Stuart for suggesting this approach in the comments to last week’s post.
2 Carter averaged 3.3 yards on 227 carries over his first five injury-plagued seasons.
3 Two Penn State halfbacks were drafted in 1996, as well. One of them was Stephen Michael Pitts, who went to Middletown High School South (NJ), a school that also graduated Knowshon Moreno and, only slightly less famously, me.
{ 3 comments }