≡ Menu

Patrick Mahomes, Russell Wilson, Lamar Jackson, Dak Prescott, and Deshaun Watson are all having great years, and all five players are in the running for the 2019 MVP award. Right now, Mahomes has been the most efficient of the group, but the story of the 2019 season isn’t about great passing offenses…. but the fact that great passing offenses aren’t the story of the 2019 season. (As an aside, Kirk Cousins and Minnesota are quietly number two in ANY/A this season).

The best passing offense, in terms of Adjusted Net Yards per Attempt, belongs to the Chiefs. So far this season, Kansas City is averaging 8.81 ANY/A, and the league as a whole is averaging 6.27 ANY/A.   So the Chiefs are averaging 2.54 ANY/A more than the average team this year.  That’s great, but what is noteworthy is that it is NOT that noteworthy this year.

The Jets passing offense is more extreme than the Chiefs passing offense.  New York is averaging an anemic 3.34 ANY/A this season, which means the Jets Relative ANY/A on offense is -2.93.  So we could say that the Jets passing offense is the most extreme this season of the 32 passing offenses.

But guess what: opponents facing the Bengals are also more extreme than Chiefs!  So far this season, Cincinnati is allowing a remarkable 8.99 ANY/A to opposing quarterbacks, which means [Insert Bengals Opponent] has been better at passing this year than Kansas City.  At -2.72 ANY/A, the Bengals pass defense is truly awful.

But wait, there’s more.  The Patriots pass defense is even more extreme than the Bengals pass defense. New England is allowing just 1.70 ANY/A this season, which is +4.57 ANY/A better than average!

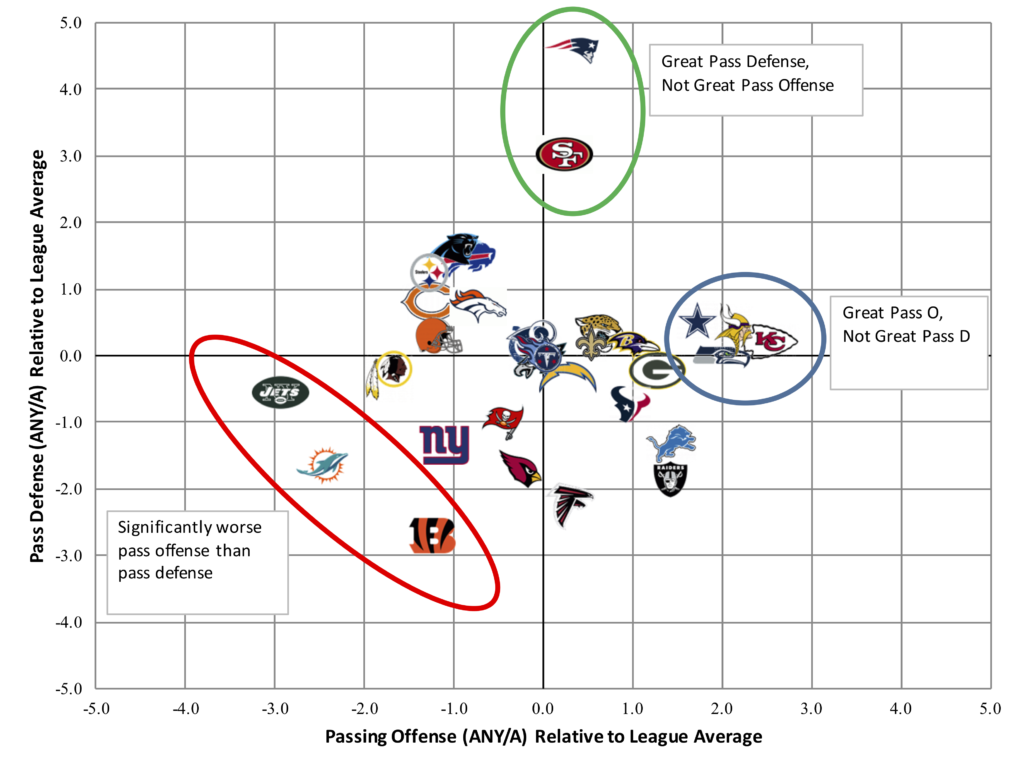
The graph below shows how each team ranks in both offensive ANY/A (X-Axis) and defensive ANY/A (Y-Axis) relative to league average.  The best teams would be up and to the right, but that’s a generally empty box.  The worst teams are down and to the left, and we do have three teams there.

So while the passing attacks in Kansas City et al. are having great years, they aren’t more extreme than the Jets pass offense, the Bengals pass defense, or the Patriots pass defense.  And that is pretty unusual.  I went and calculated the best and worst passing offenses and defenses, as measured by Relative ANY/A, in each year since 1970.  Usually, extreme offenses are the biggest outliers, and in the positive direction.  In 22 of those seasons, the most extreme unit was the best passing offense; in 13 years, the worst passing offense was the most extreme.  The other 14 years were split evenly between the best and worst passing defenses. Take a look: [continue reading…]

{ 0 comments }

How will the Broncos do without Peyton Manning? There are certainly reasons to think Denver will be fine, and Von Miller is one of the biggest reasons. Last year, the Broncos ranked in the bottom 3 in offensive ANY/A and 2nd in defensive ANY/A. According to Football Outsiders, the Broncos ranked 25th in passing DVOA and 1st in DVOA on pass defense. Sure, Mark Sanchez is not great, but he’s pretty familiar with taking a team with a bad offense and a great defense to the playoffs.

Among the 50 Super Bowl winners, Denver had arguably the worst passing offense during the regular season of those teams.  The table below displays each team’s Relative ANY/A — i.e., each team’s ANY/A relative to league average.  The Broncos offense averaged 5.14 ANY/A, which was just over a full ANY/A below average.  On the X-Axis, I have plotted how each Super Bowl winner fared in offensive RANY/A; on the Y-Axis, I have shown defensive ANY/A.  So the 2015 Broncos will be (relatively) high and to the left; the 2002 Bucs/2013 Seahawks will be very high and in the middle, and the ’98 Broncos/’06 Colts will be down and to the right.  Teams like 1966 Green Bay and 1991 Washington were really, really good and balanced, so they are up and to the right. [continue reading…]

{ 11 comments }

Pass Defense Heat Maps, 2002 to 2014

We spend a lot of time focusing on pass offenses, but not necessarily as much looking at the other side of the ball. After running my Rearview ANY/A numbers, it struck me just how bad Washington’s pass defense was last year. And if it feels like that team has struggled against the pass for awhile, well, that’s because it has. Over the last five years, there’s been no worse pass defense in the NFL.

As regular readers know, ANY/A stands for Adjusted Net Yards per Attempt, which is Yards per Attempt with a 45-yard penalty for interceptions, a 20-yard bonus for passing touchdowns, and includes sack data. Relative ANY/A simply subtracts the league average ANY/A from each team’s individual ANY/A. Last year, Washington’s pass defense allowed 7.88 ANY/A while the league average was 6.14; as a result, the team’s pass defense had a RANY/A of -1.7. In fact, the team’s defense has had a negative RANY/A in each of the last five years. [continue reading…]

{ 4 comments }

Which Running Backs Played With Best Passing Games?

Payton played with some terrible passing attacks

Payton played with some terrible passing attacks

Adjusted Net Yards per Attempt is the best simple measure of quarterback play. ANY/A is defined as (Gross Passing Yards + 20 * PassTDs – 45 * INTs – Sack Yards Lost) divided by (Pass Attempts + Sacks).  Relative ANY/A, or RANY/A, is simply ANY/A minus league average.

I looked at the 100 players with the most rushing yards in football history.  Then, for each player, I calculated the average weighted RANY/A of the offenses he played on.  As usual, to come up with a career grade, I gave more weight to a player’s best seasons.  If a running back had 18% of his rushing yards come in one season, well his team’s RANY/A for that year was responsible for 18% of his career RANY/A grade.

For example, in 2001, the good Jake Plummer showed up for the Cardinals, and Arizona had a RANY/A of +0.53.  But since Thomas Jones rushed for only 380 yards that year — just 3.6% of his career total — only 3.6% of his career RANY/A is based on the +0.53.  Conversely, Jones set a career high with 1,402 rushing yards in ’09 for the Jets, representing 13.2% of his career total.  New York, behind a rookie Mark Sanchez, had a RANY/A of -1.69 that year, which matters a lot more when calculating Jones’ career grade.  In fact, Jones played with bad passing offenses for most of his career: as it turns out, among all players in the top 100, it’s Jones who played with the worst passing offenses in his career. [continue reading…]

{ 6 comments }

Career RANY/A Rankings

Adjusted Net Yards per Attempt is my preferred basic measurement of quarterback play. ANY/A is simply yards per attempt, but includes sacks and sack yardage lost, and provides a 20-yard bonus for touchdowns and a 45-yard penalty for interceptions.

RANY/A, or Relative ANY/A, measures a quarterback’s ANY/A average to league average. Let’s use Aaron Rodgers as an example. This past season, he threw 520 passes and gained 4,381 yards and 38 touchdowns, while throwing five interceptions and being sacked 28 times for 174 yards. That translates to an 8.65 ANY/A average, best in the NFL in 2014.

The league average rate in 2014 was a record-high 6.14 Adjusted Net Yards per Attempt; as a result, this means that Rodgers averaged 2.52 ANY/A above average, or had a RANY/A of +2.52. [1]Difference due to rounding. But that is just for one season. To measure Rodgers’ career RANY/A, we need to do that for every season of his career, and weight his RANY/A in each season by his number of dropbacks.

For example, Rodgers had 14.7% of his career dropbacks come in 2014, which means 14.7% of his career RANY/A is based off of the number +2.52. During his other MVP season in 2011, Rodgers had a RANY/A of 3.49 on just 10 fewer dropbacks; as a result, 14.4% of his career RANY/A is based off of +3.49. If you multiply his RANY/A in each year by the percentage of dropbacks he had in that season relative to his entire career, and sum those results, you will get a player’s career RANY/A. Here, take a look: [continue reading…]

References

References
1 Difference due to rounding.
{ 8 comments }

Rookie Quarterbacks: It Is Not 2012 Anymore

It's been a rough year for rookies like Blake Bortles

It’s been a rough year for rookies like Blake Bortles

Jets second-year quarterback Geno Smith has averaged 3.88 Adjusted Net Yards per Attempt this year, which has resulted in him being benched for Michael Vick. That 3.88 ANY/A average is the worst of the 34 qualifying quarterbacks this season. In fact, only three other quarterbacks have averaged fewer than five Adjusted Net Yards per Attempt this year: Derek Carr (4.93), Teddy Bridgewater (4.75), and Blake Bortles (4.16). Those three, along with Johnny Manziel, were selected in the top 40 of the 2014 Draft. Since Manziel has been on the bench most of the season, and Zach Mettenberger does not yet have enough attempts to qualify, this means the only three rookie quarterbacks in the NFL this season have been terrible. With a capital T.

Which maybe isn’t too surprising. But it is a bit different. In 2008, Matt Ryan and Joe Flacco played well as rookies, with Ryan posting outstanding numbers and Flacco making it to the AFC Championship Game. In 2009, Mark Sanchez made it to the AFC Championship Game, too. In 2010, Sam Bradford set some volume-based passing records, and helped St. Louis go from 1-15 to 7-9. In 2011, Cam Newton and Andy Dalton had varying degrees of success, and generally exceeded expectations. [continue reading…]

{ 4 comments }

Yesterday, I looked at how long it took the best quarterbacks to break out. Today, I want to apply what we learned from that post to 15 current NFL quarterbacks with fewer than 50 starts, all of whom were 26 years old or younger during the 2013 season.
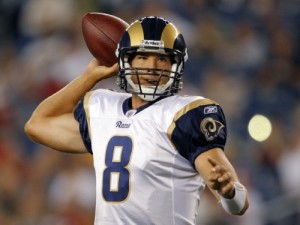
Bradford looks to check down

Bradford looks to check down.

Sam Bradford (49 career starts): Career Relative Adjusted Net Yards per Attempt of -0.68.

Bradford was overrated after he put up good counting stats but weak efficiency numbers as a rookie; he posted a -1.0 RANY/A in 2010, a -1.4 average in 10 starts in 2011, was at -0.3 in 16 starts in 2012, and then +0.2 in seven starts last year. Yesterday, we noted that great quarterbacks who came to terrible teams (Warren Moon and Drew Brees, in addition to former number one picks like Troy Aikman, Terry Bradshaw, Vinny Testaverde, and Steve Young) struggled initially. Bradford would seem to fit that mold, although he’s now 49 starts into his career. Are there other reasons to give him a pass?

St. Louis had the third-youngest offense in the NFL last year, and the man who has gained the most yards from Bradford over the last four years is Brandon Gibson. The former first overall pick has received very little help, and been saddled with a revolving door of mediocre receivers.

On the other hand, Kellen Clemens posted better numbers than Bradford last year, at least when you adjust for strength of schedule. As Bill Barnwell pointed out last week, Bradford’s big problem is his inability to throw the ball down the field, which jives with some of the work I’ve done Bradford’s historically low yards per completion averages.  If not for Bradford’s first season of above-average work last year, I’d say his odds of ever being a franchise quarterback are very low.  But there has been some progression, and he does fit the mold of number one pick being saddled with bad teammates.  Of course, the presence of Brian Schottenheimer is enough to make me skeptical of Bradford’s ability to put it all together this year.  Perhaps the best case scenario is a Testaverde-like revival with another team years from now.

Cam Newton (48 career starts): Career RANY/A of +0.30.

Not much to see here. Newton’s RANY/A has moved from +0.3 as a rookie to +0.7 in 2012 to -0.2 last year; it went under the radar because #QBWINZ, but Newton did have a down season in 2013.  It’s hard to find any reasons for optimism for the Panthers this year after a mass exodus in the offseason, but that doesn’t say much about Newton’s long-term prospects.   Add in his rushing ability, and Newton has shown enough to say that he’s still in contention (if he’s not already there) to go down as a franchise quarterback.

Andy Dalton (48 career starts): Career RANY/A of -0.01.

Look at that, Dalton is almost perfectly average! Bill Barnwell did a nice job profiling Dalton last week, and it does seem like what you see is what you will get from Dalton.  After posting slightly below-average RANY/A numbers in 2011 and 2012, he was above-average (+0.4) last year.  But the Bengals have one of the most talented offenses in the NFL if you exclude the quarterback position; at this point, you’d be hard-pressed to find many folks who believe Dalton will turn into a future star.

Of the 42 quarterbacks I looked at yesterday, 13 failed to be significantly above-average during any of their first three 16-game samples.  Dalton doesn’t really resemble any of them: Bradshaw/Testaverde/Elway/Vick were former number one picks; Brady/Favre/Krieg/Kelly were on the border of being good enough on to not make the list, and were certainly ahead of where Dalton is now; McNabb and Cunningham were running quarterbacks.  Moon played for a terrible team, and Gannon and Theismann sat for long stretches.  That’s the full thirteen. The best case scenario may be that Dalton turns into a Krieg or a poor man’s Jim Kelly.  Of course, he could also win a Super Bowl by riding the coattails of one of the more talented (and youngest) rosters in the league.

Christian Ponder (35 career starts): Career RANY/A of -1.19.

There are always excuses to be made for bad quarterbacks, and I’m sure that there are still some Vikings fans who believe in Ponder.  He produced a -1.7 RANY/A as a rookie, improved to -0.9 in 2012, but was back at -1.1 in nine starts last year.  Minnesota may not have a ton of talent at wide receiver, but Ponder’s failure to produce even with Greg Jennings is yet another strike against him. The Vikings drafted Teddy Bridgewater at the end of the first round in the 2014 draft, which seems like the beginning of the end for the former Florida State star.
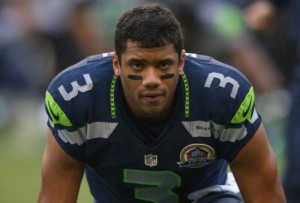
Wilson is watching game tape right now.

Wilson is watching game tape right now.

Russell Wilson (32 career starts): Career RANY/A of +1.15.

Franchise quarterback achievement badge mode: unlocked.

Ryan Tannehill (32 career starts): Career RANY/A of -0.80.

Tannehill was at -0.7 RANY/A in 2012 and at -0.9 RANY/A last year; neither of those numbers put his future prospects in a positive light.  There are excuses, to be sure: he was a raw prospect, the Dolphins offensive line was the worst in the NFL, he and Mike Wallace have the chemistry of a pair of tomatoes, etc., but the numbers are bleak enough to cast doubt on Tannehill’s future.  Unless the argument is that Tannehill landed on one of the very worst offenses in the league — which would allow you to lump him in with the Aikmans, Bradshaws, Breeses, and Testaverdes of the world — there is simply no precedent for a quarterback being this below average for this long and then turning into a franchise passer. [1]I suppose one could point to Phil Simms, but I’d object for a couple of reasons. For one, Simms didn’t crack my initial list, checking in at #86 in my GQBOAT series.  Then again, … Continue reading Barnwell is a little (and only a little) more bullish on Tannehill than I am, but 2014 would appear to be Tannehill’s last chance to convince the Dolphins that he was not a wasted pick.  There are a couple of mitigating factors here — the running game has been terrible, and as an immediate starter, Tannehill is at a disadvantage relative to other quarterbacks on this list — but I’m not going to lose sleep over whether this prediction will look bad in a few years.

Andrew Luck (32 career starts): Career RANY/A of -0.06.

Since starting this site, Luck has been one of the quarterbacks I’ve profiled the most.  He wins without much help and is an ESPN QBR star, but he’s below average in ANY/A.  I’m inclined to grade Luck on a curve — after all, the Colts team he inherited didn’t look any better than the ’70 Steelers or ’89 Cowboys or ’87 Bucs.  On the other hand, Reggie Wayne and T.Y. Hilton have given Luck some excellent targets, which has probably been enough to boost his ANY/A to league-average proportions.

Perhaps the best comparison will be to another quarterback drafted first overall by the Colts who had a magical history of producing comebacks: John Elway.  In any event, Luck’s already a franchise quarterback.
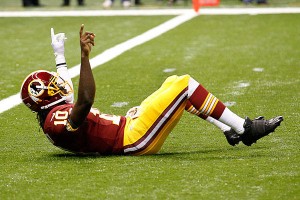
Can RG3 get up from a disastrous 2013?

Can RG3 get up from a disastrous 2013?

Robert Griffin III (29 career starts): Career RANY/A of +0.5.

Griffin’s career RANY/A is like measuring the temperature of a person with a foot in the freezer and a foot in a frying pan.  As a rookie, he had a RANY/A of +1.5; last year, it was -0.4, and that number doesn’t begin to explain how ugly things were in D.C.  The simplest explanation is that Griffin is a franchise quarterback who struggled last year as he recovered from ACL surgery and dealt with an ego-maniacal head coach.  But it’s hard to just assume Griffin is a franchise quarterback after 2013.  If Griffin one day turns into a Hall of Famer, we’ll remember that it was obvious from the start, as he had one of the greatest rookie seasons ever.  If he flames out, the first chapter of that book has already been written, too.

Blaine Gabbert (27 career starts): Career RANY/A of -2.15.

Spoiler alert: Gabbert is not a franchise quarterback.  He started at -2.2 RANY/A as a rookie on a team not dissimilar from the ’89 Cowboys; he’s followed that up, however, with a -1.2 RANY/A in 2012 and a -4.7 RANY/A over three starts last year. Suffice it to say if Gabbert turns into a franchise quarterback, it will have taken the greatest reclamation project in NFL history.

Colin Kaepernick (23 career starts): Career RANY/A of +1.06.

Kaepernick was mind-bogglingly efficient in 2012, producing a +1.6 RANY/A over 13 games and seven starts.  That number dropped to +0.8 RANY/A last year, but much of that is due to the loss of Michael Crabtree.  With an all-star crew of receivers set to take the field in 2014, I expect another very strong year out of Kaepernick. He may not be a finished product, but he already has the label (and contract) of a franchise quarterback.

Jake Locker (18 career starts): Career RANY/A of -0.25.

Maybe it’s because I’m a college football guy, too, but doesn’t it feel like Locker has already been around forever? I can’t believe he only has 18 career starts. And his RANY/A is nearly league-average, even if it doesn’t feel like Locker has been even that good.  I was not a fan of him as a prospect, but he has been better than I feared.  While we shouldn’t compare Locker’s first 18 starts to those of a quarterback who started immediately, I think Locker has shown enough that you can’t just write him off just yet.  On the other hand, his numbers last year were a bit inflated by one of the NFL’s easiest schedules. Like Tannehill, this is the crucial season for Locker, who also carries with him the injury prone label. But if Locker can stay healthy and produce strong numbers, Ken Whisenhunt may prove that he really is a quarterback whisperer (to the extent he’s not whispering to someone named Skelton, or Kolb, or Anderson, or Leinart, or Lindley, or Hall….)

Nick Foles (16 career starts): Career RANY/A of +1.45

Foles had a rookie RANY/A of -0.8 before posting an absurd +3.3 RANY/A in 2013. Even the bigger Eagles homer would admit that much of Foles’ success was due to good fortune, the presence of Chip Kelly, or both.  Foles may not have arrived just yet as a franchise quarterback, but if he turns into one, nobody will ever question when we first saw a glimpse of that ability.

Geno Smith (16 career starts): Career RANY/A of -1.70.

Smith was bad — really bad — for long stretches as a rookie.  But he finished the season well, and terrible rookie numbers on a talent-deficient offense are not the death knell for a quarterback’s career.  The Jets need to see a lot more from him this year, though, and he’ll need to produce roughly league-average numbers to make the Jets think he’s not just another Mark Sanchez.

Mike Glennon (13 career starts): Career RANY/A of -0.9.

Glennon had a very different rookie campaign than Smith, but the acquisition of Josh McCown sends Glennon to the bench, at least for now.  We don’t know how he’ll fare in (or when he’ll see) his next three starts, but Glennon’s performance through 16 starts likely won’t be enough to write him off.

EJ Manuel (10 career starts): Career RANY/A of -1.0.

Manuel had a rough rookie year, especially when you consider how much worse he looked than Thaddeus Lewis. On the other hand, ten starts of bad (but not horrendous) play certainly isn’t enough to write off Manuel, not when Smith was worse for a longer stretch.  Still, as with Smith, this is a big year for Manuel, especially after the team went out and acquired Clemson’s Sammy Watkins.
References

References
1 I suppose one could point to Phil Simms, but I’d object for a couple of reasons. For one, Simms didn’t crack my initial list, checking in at #86 in my GQBOAT series.  Then again, I’ve made the argument that Simms’ numbers underrate him because of his terrible receivers, so I would morally classify Simms as a franchise quarterback. However, the Giants teams of the late ’70s and early ’80s were so terrible that he really has more in common with the Aikmans of the world than someone like Tannehill. Here is how Simms fared compared to the other Giants quarterbacks during Simms’ first three years and 1978, the year before he came to New York. That’s U-G-L-Y. But if Dolphins fans want to point to Simms as a pro-Tannehill example, so be it.
{ 9 comments }

A couple of years ago, I asked how long it should have taken the Jaguars to move on from Blaine Gabbert. Today I want to revisit that general idea, but look at how long it takes the best quarterbacks to identify themselves as top-tier players. A couple of months ago, I looked at the greatest quarterbacks of all time. Using the top 75 quarterbacks from that list, I removed any player whose career began before the merger; that left me with 42 passers.

First, I looked at how each quarterback fared in relative Adjusted Net Yards per Attempt — i.e., ANY/A relative to league average — through their first 16 starts. Just over two-thirds of these passers were above average during their first 16 starts, with 1/3 of those quarterbacks being at least 1 ANY/A better than league average.  That group of fourteen quarterbacks — which Aaron Rodgers just falls shy of joining — can be categorized as above-average quarterbacks from the beginning. They are Kurt Warner, Dan Marino, Daunte Culpepper, Chad Pennington, Tony Romo, Mark Rypien, Jeff Garcia, Boomer Esiason, Ben Roethlisberger, Philip Rivers, Matt Ryan, Joe Montana, Steve McNair, and Ken Stabler. Obviously a number of those quarterbacks were not immediate starters in the NFL, but they did excel as soon as they became starters.

The graph below shows each of the 42 quarterbacks’ Relative ANY/A through their first 16 starts. The X-Axis represents the quarterback’s first year, and the Y-Axis shows their RANY/A value through 16 starts.

QB breakout 1

Now, let’s remove the 14 quarterbacks who had a RANY/A of at least +1.0 through their first sixteen starts. How did the other 28 quarterbacks fare in starts 17 through 32 in RANY/A? Eleven of them produced a RANY/A of at least +1.0 in their next sixteen starts: Bert Jones, Matt Schaub, Ken Anderson, Peyton Manning, Aaron Rodgers, Brad Johnson, Carson Palmer, Jim Everett, Steve Young, Dan Fouts, and Steve Grogan.

[continue reading…]

{ 24 comments }
Sanchez tries to understand the formula for wins above expectation

Sanchez tries to understand the formula for wins above expectation.

On Friday, the Jets released Mark Sanchez. I don’t have much in the way of a post mortem, but it felt odd not to have at least some post on the subject. And despite watching every Sanchez start for four years, it still takes me by surprise when I see that his career record is 33-29. That winning record came despite Sanchez being one of the worst starters in the league for most of his career. Through five seasons, he has a career Relative Adjusted Net Yards per Attempt average of -1.03. Among the 140 quarterbacks to enter the NFL since 1970 who have started 40 games, only one other passer (who will remain nameless for now) had a winning record with a worse RANY/A than Sanchez; the next worst quarterback with a winning record over that time frame is Trent Dilfer, who finished 58-55 with a career -0.85 RANY/A.

If you grade quarterbacks by #Winz, Sanchez is above-average. If you look at passing statistics — i.e., ANY/A — he’s one of the worst in the league. So I thought I would quantify that gulf and see if Sanchez was the quarterback with the largest disparity between winning percentage and passing statistics.

First, I ran a regression on team wins (pro-rated to 16 games) and Relative ANY/A for every year since 1970. The best fit formula was 8.00 + 1.756 * RANY/A. In other words, for every 1.00 ANY/A above league average, a team should expect to win 1.756 more games. For a team to expect to win 11 games, they need to finish 1.71 ANY/A better than average.

Next, I calculated the career RANY/A — i.e., the ANY/A relative to league average — for every quarterback to enter the league since 1970. For example, Sanchez has a RANY/A of -1.03. This means you would expect his teams to win 6.19 games every season, for a 0.387 winning percentage. In reality, Sanchez’s Jets have a 0.632 winning percentage, which means he has an actual winning percentage that is 0.146 higher than his expected winning percentage. As it turns out, that differential puts him in the top ten, but it is not the best mark.

That honor belongs to Mike Phipps. Here’s how to read the table below, which shows all 140 quarterbacks to enter the league since 1970 and start at least 40 games. Phipps entered the league in 1970 and last played in 1981, starting 71 games in his career. He finished with a career RANY/A of -1.52; as a result, he “should have” won only 23.6 games. In reality, he won 39 games, meaning he won 15.4 more games than expected. On a percentage basis, his RANY/A would imply a .333 expected winning percentage; his actual winning percentage was 0.549, and that difference of +0.216 is the highest in our sample. [continue reading…]

{ 11 comments }

No, Peyton, you are #1

No, Peyton, you are #1.

While working on a different post, I needed to derive a quick-and-dirty formula to identify the top 100 or so quarterbacks in NFL history. Here is how I went about doing that:

1) Calculate the Relative ANY/A of each quarterback in every season since 1950. ANY/A, of course, is Adjusted Net Yards per Attempt, defined as (Gross Pass Yards + 20*Pass_TDs – 45*INTs – Sack Yards Lost) divided by (Pass Attempts + Sacks). For quarterback seasons before 1969, we do not have sack data, so that part of the analysis is ignored (I could have used estimated sack data, but I being lazy).

2) For each quarterback season, multiply each quarterback’s number of dropbacks by his Relative ANY/A to derive a Passing Value over Average metric.

3) Pro-rate non-16 game seasons to 16 games.

4) Calculate a career grade for each quarterback based on the sum of his best five seasons.

Then I realized that this data, while background material for a separate post, was probably interesting to folks in its own right.  Hence today’s post. You should not be surprised to see that Peyton Manning is number one on this list. Here’s how to read his line. His best year came in 2004, when he produced 2113 Adjusted Net Yards over Average. Last year was his second best season — his gross numbers were more impressive, of course, but he produced “only” 2,031 ANY over average. Manning’s other three best years came in ’06, ’05, and ’03. Overall, he produced 8,115 Adjusted Net Yards over Average over his five best seasons, the best of any quarterback in this study (by a large margin). The table below shows the top 100 passers since 1950 (you can change the number of quarterbacks displayed in the dropdown box). [continue reading…]

{ 71 comments }

No, Peyton, you're the man

No, Peyton, you're the man.

In 1984, Dan Marino set an NFL record with 48 touchdown passes, but his Dolphins lost in the Super Bowl. Twenty years later, Peyton Manning broke Marino’s record, but he lost to the eventual Super Bowl champion Patriots in the playoffs. In 2007, Tom Brady broke Manning’s touchdowns record, but he lost in the Super Bowl, too.

When the greatest quarterback seasons of all time are discussed, these three years dominate the discussion. And with good reason. But if you include the playoffs — and frankly, there’s no reason not to include the playoffs — which quarterback produced the greatest season of all time? I’m going to stipulate that the greatest quarterback season ever has to end in a Lombardi Trophy, because otherwise, I think we’ll end up back in the world of Marino ’84/Brady ’07/Manning ’04. Of course, now another Manning season has entered the mix: and with a Super Bowl win, Manning’s 2013 should and would be remembered as the greatest quarterback season of all time.

So, the question becomes, which season would he knock off the top rung? I think there are six seasons that stand out from the rest, based on regular and postseason performance.

Honorable Mention [continue reading…]

{ 14 comments }
I have to deal with Chip Kelly?

I have to deal with Chip Kelly?

Kansas City/Indianapolis Preview

New Orleans Saints (11-5) (+2.5) at Philadelphia Eagles (10-6), Saturday 8:10 PM ET

We’re fully immune to the Saints offense at this point. Drew Brees just threw for for 5,162 yards and 39 touchdowns and it didn’t even register on most radars. One reason for that: both of those numbers represent three-year lows for the Saints star. Jimmy Graham shook off early-season leg injuries to lead the league with 16 touchdowns, and rookie Kenny Stills led the NFL in yards per target. Both Pierre Thomas and Darren Sproles topped 70 receptions — two of just five running backs this year to do so — and I didn’t even know that until five seconds ago. Pinball numbers are the expectation when dealing with the Saints offense.

But the real change is on defense, as the team just finished one of the most remarkable turnarounds in NFL history. Did you know that the Saints finished fourth in points allowed this year? That’s only the fourth time New Orleans has ranked in the top five in that statistic in franchise history, with the other three occurrences all coming during the Dome Patrol era. What makes New Orleans’ success even more remarkable is that the team ranked last in points allowed in 2012. New Orleans is the first team in NFL history to jump 27 spots in the points allowed rankings. Prior to this year, the 2011 Houston Texans (4th after ranking 29th) and 1993 New York Giants (1st after ranking 26th) had been the most improved defenses with 25-slot jumps. Now the Saints probably aren’t as good as their points allowed rank would imply (Football Outsiders has them 9th, Advanced NFL Stats ranks the unit 10th), but unparalleled feats remain astounding.

The main reason for the team’s improvement is the pass defense. The Saints ranked last in Net Yards per Attempt allowed last year, but 7th this season, another remarkable jump. In fact, only 10 teams have ever made a jump of 25 spots in the NY/A allowed rankings: [continue reading…]

{ 9 comments }

No, Peyton, you are #1

No, Peyton, you are #1.

Back in March, Chase wrote a post investigating how quarterbacks age, finding that they peak at age 29 (with a generalized peak from 26-30) in terms of value over average. Today, I thought I’d quickly look at how quarterbacks age in terms of their performance rate — specifically, their Adjusted Net Yards per Attempt (ANY/A). For newer readers, ANY/A is based on the following formula: (Passing Yards + 20 * Passing TDs – 45 * INTs – Sack Yards Lost) / (Pass Attempts + Sacks).

First, I need to introduce a way of adjusting ANY/A for era: Relative ANY/A. Relative ANY/A is simply equal to:

QB_ANY/A – LgAvg_ANY/A

The table below lists the 30 single-season leaders in Relative ANY/A since the merger. You won’t be too surprised to see the 2004 version of Peyton Manning at the top. That year, Manning averaged 9.8 ANY/A, while the league average was just 5.6 ANY/A. That means Manning gets a Relative ANY/A grade of +4.1 (with the difference due to rounding).
[continue reading…]

{ 17 comments }