≡ Menu

Steven Jackson and Running Back Records

Jackson, presumably walking off the field after a loss

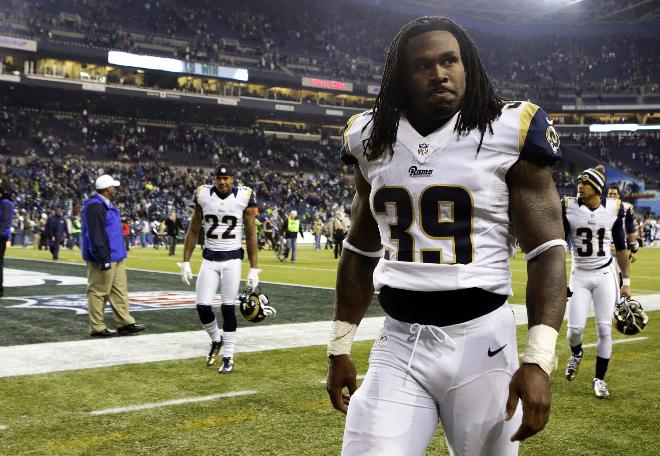
Jackson, presumably walking off the field after a loss.

One of my very first posts at Football Perspective looked at the weighted career winning percentages of various running backs. You can calculate a player’s weighted career winning percentage in lots of ways, but here’s what I did:

  • Calculate the percentage of yards from scrimmage a running back gained in each season as a percentage of his career yards from scrimmage. For example, if a player gained 10% of his yards from scrimmage in 1999 and the team went 15-1 that season, then 10% of the running back’s weighted winning percentage would be 0.9375. This is designed to align a running back’s best seasons with his team’s records in those years. For example, Emmitt Smith played 2 of his 15 seasons with the Cardinals. But since he gained only 6.5% of his career yards from scrimmage in Arizona, the Cardinals’ records those years count for only 6.5% — and not, say, 13.3% — of his career weighted winning percentage.
  • Add the weighted winning percentages from each season of the player’s career to get a career weighted winning percentage.

At the time, Steven Jackson had the lowest average adjusted winning percentage of any running back in my study. Since then, Jackson played for the 7-8-1 Rams in 2012 and the 4-12 Falcons in 2013. That upped his adjusted winning percentage from 0.292 to 0.307. Among the 129 running backs in NFL history with at least 7,000 yards from scrimmage, only James Wilder had a worse career adjusted winning percentage.

The running back with the highest adjusted winning percentage is Lawrence McCutcheon, who spent the majority of his career with the Rams before end-of-career cups of coffee with Denver, Seattle, and Buffalo. The table below shows the first and last year for each running back, the teams he played for, his career yards from scrimmage, and his adjusted winning percentage. McCutcheon played on those great Rams teams of the ’70s, gaining the bulk of his yards from ’73 to ’77. As a result, his adjusted winning % is an incredible 0.741: [continue reading…]

{ 10 comments }

Trent Richardson thinks this guy was an average running back in losses.

Trent Richardson thinks this guy was an average running back in losses.

Yesterday, I noted that Adrian Peterson is averaging nearly two more yards per rush in losses than wins. He’s also averaging a nearly identical number of rushing yards per game in wins and losses.

As you’re about to see, that’s pretty rare. We all know that wins are correlated with rushing yards, so it should come as no surprise that running backs generally gain more rushing yards in wins than in losses.

I looked at all games, including playoffs, from 1960 to 2011, for all players with at least 3,000 rushing yards over that time period. The table below lists the following information for each player:

— His first year (or 1960, if he played before 1960) and his last year (or 2011, if still active)
— All the franchises he played for (which you can search for in the search box)
— His number of career wins, and his career rush attempts, rushing yards, rushing yards per carry, and rushing yards per game in wins
— His number of career losses, and his career rush attempts, rushing yards, rushing yards per carry, and rushing yards per game in losses

The table is sorted by rushing yards per game in wins. Again, for players like Jim Brown or Peterson, they are included but only their stats from 1960 to 2011 are shown. The table only shows the top 50 players, but the search feature works for the entire table, which includes 281 players. In addition, you can click on the drop arrow and change the number of rows shown.

As always, the table is fully sortable. If you click twice on the far right column, you see the career leaders in rushing yards per game in losses. You probably aren’t surprised to see Barry Sanders at the top, but the presence of the running back formerly known as Dom Davis up there is a bit surprising. Steven Jackson is one of the few players who have averaged over 70 rushing yards per game in losses, which jives with the sixth post in Football Perspective history. In addition, Jackson (at least through 2011) and LaDainian Tomlinson form an interesting example of Simpson’s Paradox: Jackson has a higher career rushing yards per game average in both wins (93.9 to 89.9) and losses (71.1 to 63.2), while Tomlinson has the higher career average overall (78.6 to 78.3).


[continue reading…]

{ 4 comments }

Steven Jackson is the Ollie Matson of the 21st century. What does that mean? Before we answer that, take a look at Steven Jackson’s impressive career:

Rushing Receiving
Year Age Tm Att Yds TD Y/A Rec Yds Y/R TD YScm RRTD
2004 21 STL 134 673 4 5.0 19 189 9.9 0 862 4
2005 22 STL 254 1046 8 4.1 43 320 7.4 2 1366 10
2006* 23 STL 346 1528 13 4.4 90 806 9.0 3 2334 16
2007 24 STL 237 1002 5 4.2 38 271 7.1 1 1273 6
2008 25 STL 253 1042 7 4.1 40 379 9.5 1 1421 8
2009* 26 STL 324 1416 4 4.4 51 322 6.3 0 1738 4
2010* 27 STL 330 1241 6 3.8 46 383 8.3 0 1624 6
2011 28 STL 260 1145 5 4.4 42 333 7.9 1 1478 6
Career 2138 9093 52 4.3 369 3003 8.1 8 12096 60

[continue reading…]

{ 6 comments }