≡ Menu

On Monday, I looked at which receivers were the most productive on a per-team pass attempt basis. This is one good way to measure wide receiver production, but it is far from perfect.

Players on teams with bad quarterbacks will be harmed, as are players who are “competing” with really good receivers on their offense will be boosted. The two guys I’m really thinking of are Terry McLaurin (who ranked 23rd in ACY/TPA on Monday) and Allen Robinson (19th), two wide receivers we know are very good but had very poor quarterback play. [1]An interesting scenario is in Carolina, where the quarterback play was below average but D.J. Moore and Robby Anderson had to compete with each other.

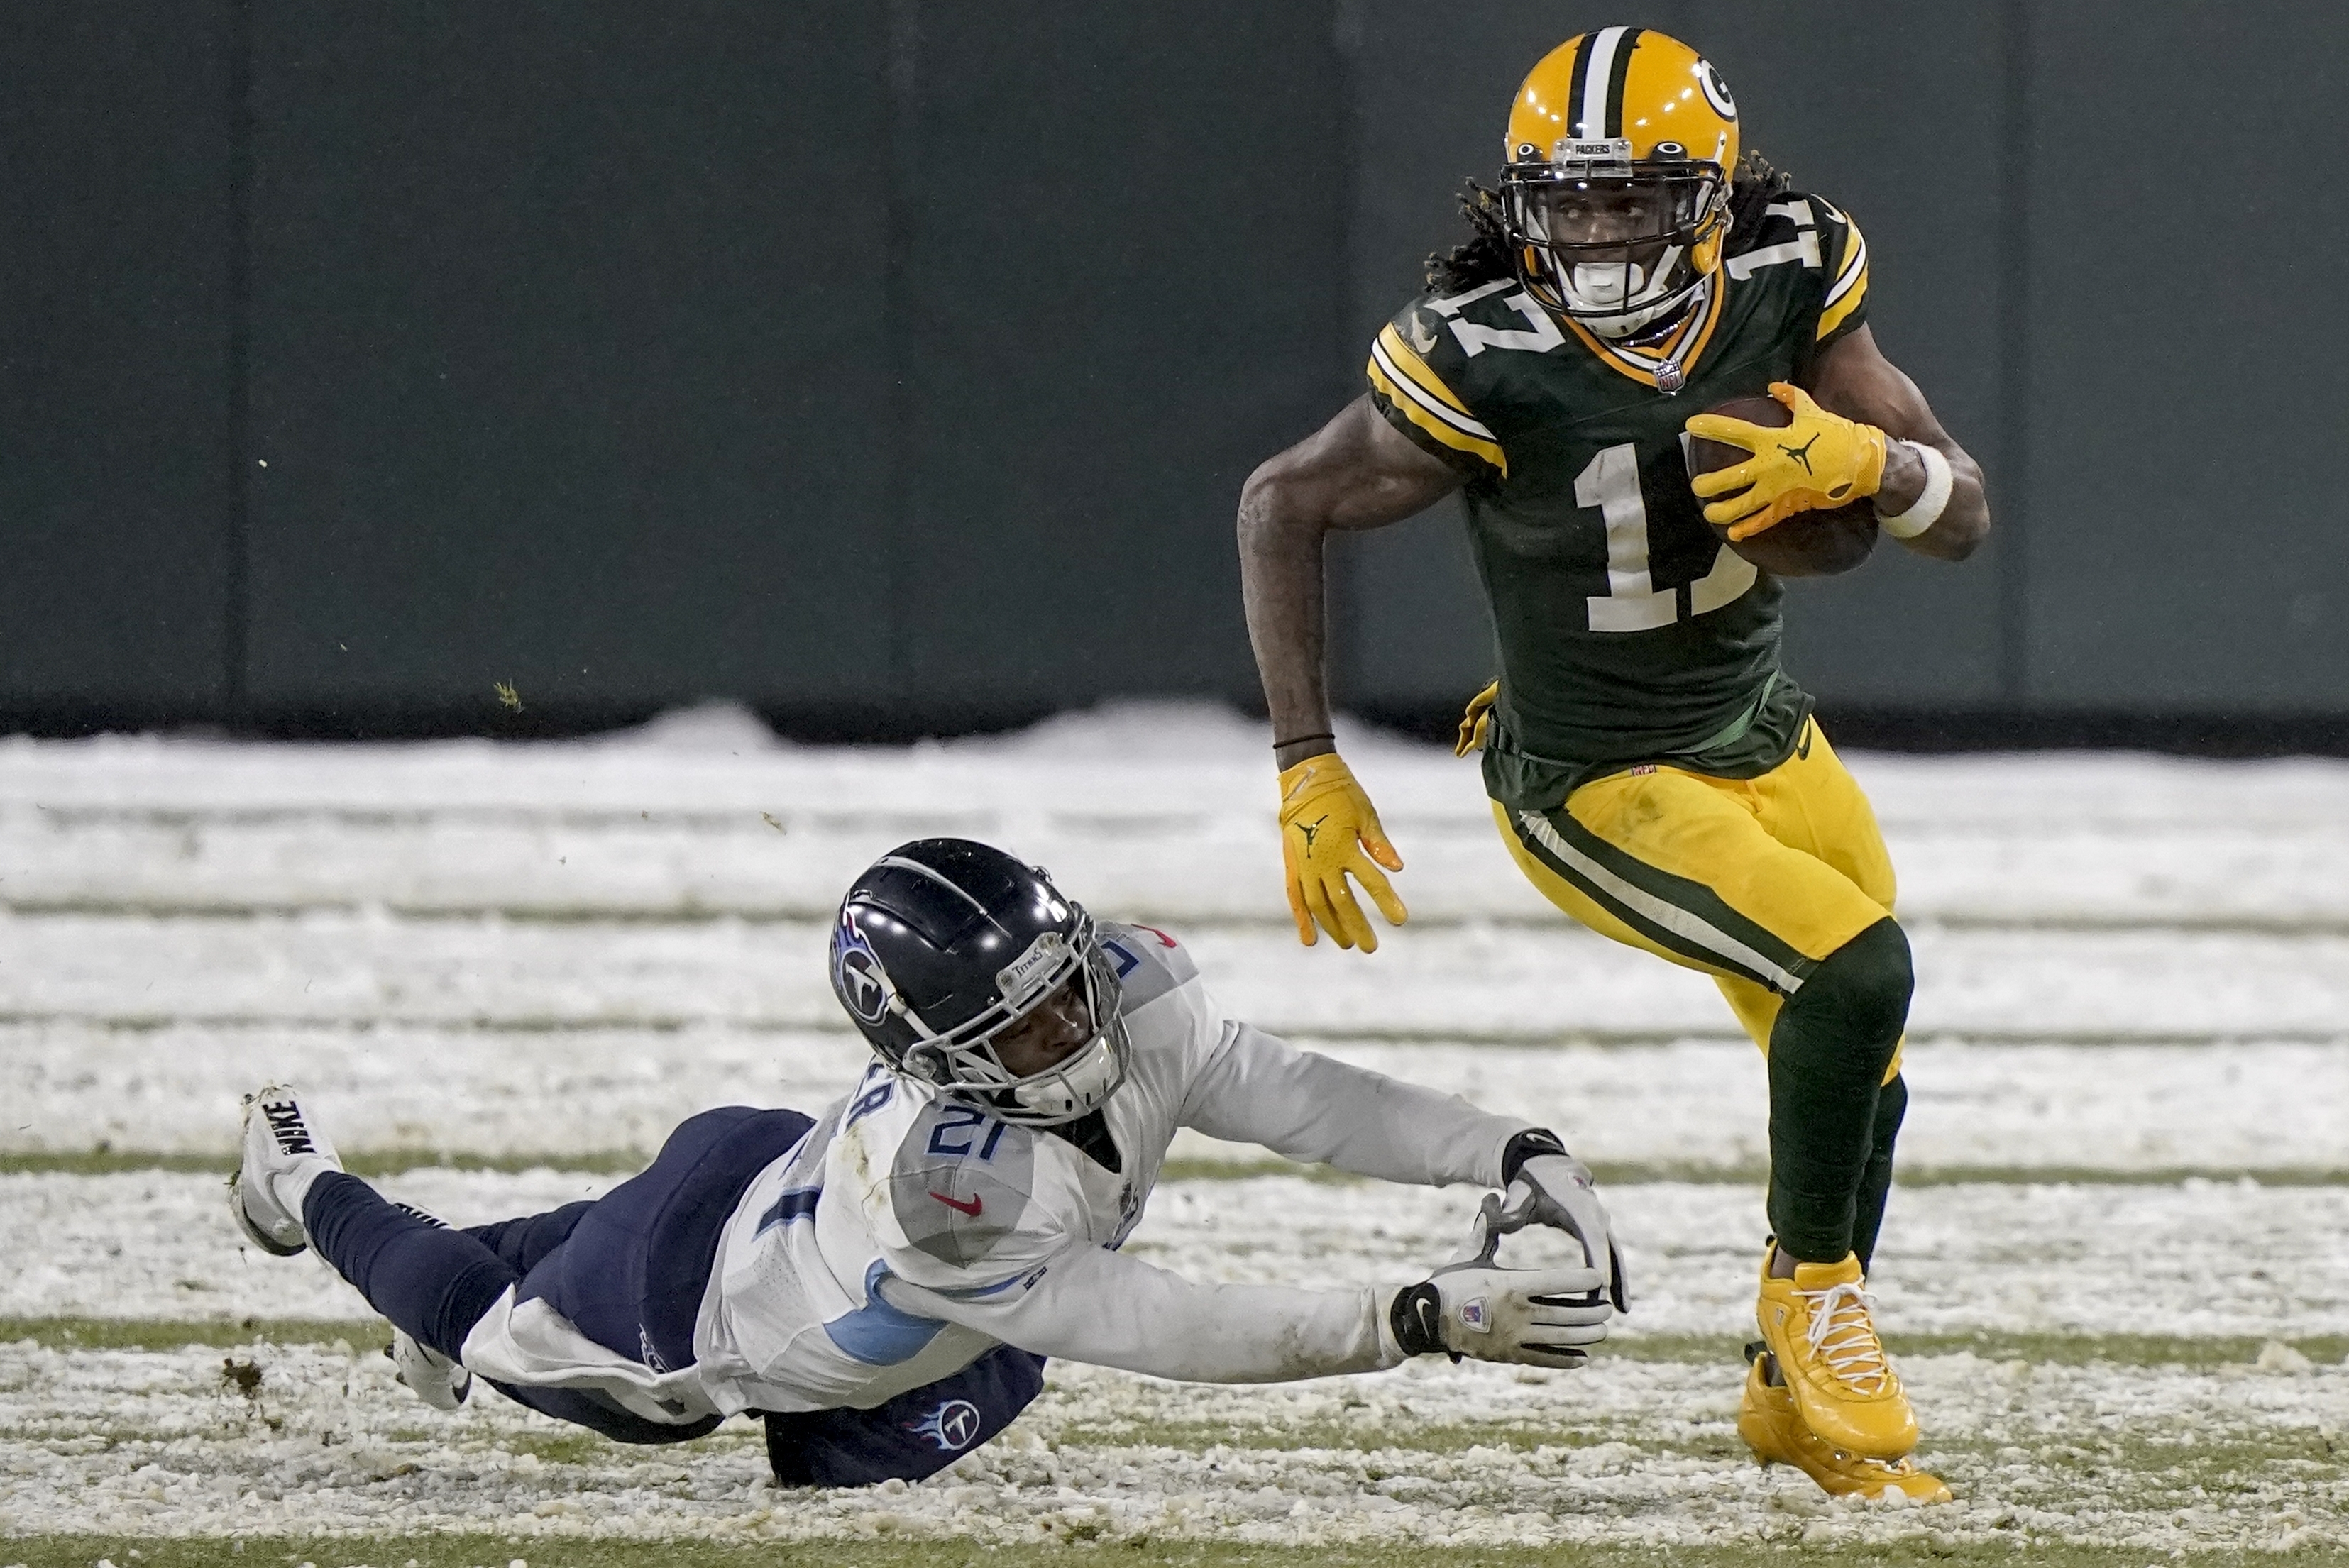
So today I want to look at which receivers gained the largest share of their team’s receiving pie, measured simply as receiving yards in the games they played. Davante Adams led all players in percentage of team receiving yards, at 37.2%, and he did it while playing for the best passing offense in football. It is extremely rare for a wide receiver to both play for an incredible passing offense and have an insanely large share of the pie: it is one reason why Adams had one of the great seasons in receiving history in 2020.

Beyond Adams, who were the most impressive receivers in 2020? There might be some trade-off between being on a great offense and being on a bad one; all things being equal, it’s easier for Robinson or McLaurin to gobble up targets than say, someone in Tampa Bay or Kansas City’s offense. One way I like to measure receivers is to look at both the quality of the pie — i.e., how good was their passing game — and how big of a slice each receiver gobbled up. Getting a good-size pie on a great passing offense, a large chunk of a good passing game, and a huge chunk of a bad passing game are all about equally impressive if you think that players “compete” with their teammates for targets.

In the graph below, I’ve shown the percentage of the team receiving yards each receiver had in 2020 (limited only to the games they played) on the X-Axis, and their team’s passing efficiency (as measured by ANY/A) on the Y-Axis. I’ve also labeled some notable players who stood out. [continue reading…]

References

References
1 An interesting scenario is in Carolina, where the quarterback play was below average but D.J. Moore and Robby Anderson had to compete with each other.
{ 0 comments }

Top Receivers in 2020 Per Team Pass Attempt

Nobody could stop Adams in 2020.

Davante Adams was the best wide receiver in the NFL in 2020, and by a very large margin. Unless you want to assign a heavy penalty on him for playing with the MVP quarterback, Adams had otherworldly numbers. He played in just 14 games, but still gained 1,374 yards, 73 first downs, and caught 18 touchdowns. This came in just 461 pass attempts during those 14 games, making that even more impressive.

When measuring receiver performance, it’s important to recognize that some wide receivers play on pass-heavy teams while some play on run-heavy teams. Targets are often mistakenly viewed as a measure of opportunity, when really targets are a form of production; a player who gets a target on a play is doing something positive. The best measure of opportunity is routes run, and team pass attempts serves as a good proxy for that.

Let’s skip Adams, who again blows away the field. Let’s instead look at Titans wide receiver A.J. Brown, who is often the lead horse for the great efficiency numbers that Ryan Tannehill has produced since joining the Titans. Brown missed two games this year, but in those 14 games, he gained 1,075 receiving yards, 55 first downs and 11 touchdowns. Most impressively, this came with only 424 pass attempts (excluding sacks) in those games. Brown picked up a first down on 13% of all Titans pass attempts in the games he played, the fourth-best mark in the NFL; he caught a touchdown on 2.6% of all Tennessee pass plays during those 14 games, the third-highest mark in the league. A receiver can only produce on passing plays, and Brown was a huge reason for the Titans success last year.

For each receiver last year, I calculated how many Adjusted Catch Yards they gained, which is simply receiving yards with a 9-yard bonus for each first down and a 20-yard bonus for each touchdown. [1]Without duplication, so a touchdown only gets 11 additional yards, since each touchdown is always a first down. For Brown, that means he gained 1691 adjusted catch yards; in the 14 games he played, he averaged 3.99 ACY per team pass attempt, the second-best rate in the NFL. Here are the top 100 receivers by this metric: [continue reading…]

References

References
1 Without duplication, so a touchdown only gets 11 additional yards, since each touchdown is always a first down.
{ 0 comments }

You’re going to want to sit down for this one: Antonio Brown and Julio Jones were the two best receivers in the NFL last year.

Houston star DeAndre Hopkins was responsible for 37.8% of all Texans receiving yards last season, the highest rate in the league in 2017 (Hopkins also did this as a rookie in 2014).  But Brown and Jones weren’t too far behind him: Brown had 34.8% of all Steelers receiving yards despite missing nearly three full games.  And Jones had 33.8% of all Falcons receiving yards, the third highest ratio in the NFL.  But Hopkins played on a mediocre Texans passing attack that ranked 20th in ANY/A (more precisely, he spent 40% of his time on a great passing attack led by Deshaun Watson, and 60% of his time on a terrible pass offense with Tom Savage and T.J. Yates under center).  Jones and Brown played on passing offenses that averaged 7.0 ANY/A, ranking 7th and 8th in the NFL in 2017.

One of my favorite things to do at Football Perspective is to look at receiving production in the context of two stats: percentage of team yards and team passing efficiency (highlighted here when looking at Gary Clark’s production on the ’91 Skins). Why do I like looking at this? In some ways, these are counter forces.  Put a great wide receiver on a good passing attack and he might not have a huge share of the offense, but the passing attack should be outstanding.  Put him on a bad passing attack, and the pass efficiency may not be great, but he should have a huge share of the pie.  It is hardly perfect, but it’s fun to look at.

So how do we quantify this? Let’s use Keenan Allen as an example for the table below. He had 30.6% of all Chargers receiving yards last season and Los Angeles averaged an impressive 7.48 ANY/A. He ranked 6th in percentage of Team Receiving Yards, and the Chargers ranked 3rd in ANY/A. Allen was 1.03 standard deviations above average in percentage of team receiving yards – the % of TRY Z-Score — and the Chargers were 1.47 standard deviations above average in ANY/A (the ANY/A Z-Score). If you add those two numbers together, Allen was 2.50 standard deviations above average, the metric by which the table below is sorted. [continue reading…]

{ 0 comments }
Brown was number one in 2014

Brown was number one in 2014

You may recall that in 2013, Antonio Brown led the NFL in True Receiving Yards, which felt controversial at the time. Remember, Calvin Johnson and Josh Gordon were the runaway choices by the Associated Press as the top receivers in the NFL; in addition, A.J. Green also received more votes, and Demaryius Thomas finished with as many votes as Brown.

Well, Brown has done it again, but I doubt it will surprise many people this time around. Brown led the NFL in receptions and receiving yards, and received 49 of 50 first-team All-Pro votes. Regular readers are familiar with the concept of True Receiving Yards, but let’s walk through the system using Brown and Dez Bryant, who jumps from 8th in receiving yards to 4th in True Receiving Yards. [continue reading…]

{ 4 comments }

Leading Receivers Trivia

The GOAT

The GOAT.

Roger Craig, 1985.

Terrell Owens, 1999.
Terrell Owens, 2000.
Tim Brown, 2001.

Neil Paine wrote a fantastic post today at 538 about wide receivers competing with their teammates for production. That inspired me to start crunching some numbers. From 1985 to 2003, Jerry Rice played in at least 8 games in 18 different seasons. In fourteen of those seasons — including every year from age 24 through age 36, inclusive — Rice led his team in receiving yards per game. In the other four years, Rice ranked 2nd on his team in receiving yards per game, and usually not far behind the number one man. [1]In ’85, Craig averaged 63.5 YPG, while Rice averaged 57.9. In 2000, Rice led the team in receiving yards, but Owens averaged 53.9 yards per game, Rice 51.9. Owens blew Rice out of the water … Continue reading Rice finished his career with a forgettable season in Seattle, where three more players — Darrell Jackson, Koren Robinson, and Bobby Engram — out-gained a 42-year-old Rice in receiving yards per game.

What about Marvin Harrison? He led the Colts in receiving yards per game in nine of his 12 seasons in which he played in at least eight games. In 1997, Sean Dawkins edged a Harrison by 3.3 yards per game. In 2004, Reggie Wayne bested Harrison by six yards per game. And in Harrison’s final year, both Wayne and Dallas Clark outgained Harrison. [continue reading…]

References

References
1 In ’85, Craig averaged 63.5 YPG, while Rice averaged 57.9. In 2000, Rice led the team in receiving yards, but Owens averaged 53.9 yards per game, Rice 51.9. Owens blew Rice out of the water in 2000; in 2001, Brown edged him, 72.8-71.2.
{ 10 comments }

Brown was number one in 2013

Brown was number one in 2013.

Wide receiver is a notoriously difficult position to analyze using statistics. Era adjustments are arguably more important here than at any other position, but even within the same season it is not easy to compare wide receivers. Most people, myself included, would probably say that Josh Gordon or Calvin Johnson was the best wide receiver in football in 2013. Gordon, after all, led the NFL in receiving yards despite missing two games, while Johnson is well, Megatron. If you place more emphasis on other metrics, you would be interested to know that Pierre Garcon led the NFL in receptions, while Jimmy Graham led all players in receiving touchdowns (and Demaryius Thomas led all wide receivers in that statistic).

But, as you can tell from the title of this post, it was Pittsburgh’s Antonio Brown who led all players in True Receiving Yards. Regular readers are familiar with the concept of True Receiving Yards, but walking through the system with both Brown and Gordon will serve as a useful reminder.

Let’s start by recognizing that Brown’s season was special in its own right: he became the first player to record 50 receiving yards in 16 different games in a single season. He also finished 2nd in both receptions and receiving yards, so it doesn’t take much processing through the True Receiving Yards machine to vault Brown into first place. He ended the year with a 110-1499-8 stat line, while Gordon finished 2013 with 87 catches for 1,646 yards and nine scores.

The first step in the True Receiving Yards calculation is to convert each player’s stat line into a single statistic, Adjusted Catch Yards. By giving each player 5 yards for each reception and 20 yards for each touchdown, Brown is credited with 2,209 Adjusted Catch Yards and Gordon 2,261, making them the top two players in 2013 by that metric. [continue reading…]

{ 3 comments }
Picture1

The consensus view on John Elway is clear. He was the greatest draft prospect ever, a league MVP, a two-time Super Bowl champion, a Hall of Famer, and one of the most clutch quarterbacks in football history.

But that’s not necessarily what the numbers say. In my quarterback ranking system, which rewards efficiency and longevity and adjusts for era, Elway only ranked as the 26th best regular-season quarterback of all time. If you’re so inclined, it’s not hard to find the numbers to argue that Elway – at least until Mike Shanahan returned to Denver as head coach in 1995 — was overrated. Consider:

  • Over the first 10 years of his career, Elway threw 158 touchdowns and 157 interceptions.
  • Elway never led the NFL in passer rating, completion percentage, touchdowns, yards per attempt, or Adjusted Net Yards per Attempt. Elway didn’t finish in the top ten in passer rating until his eleventh season in the league. In Net Yards per Attempt, Elway ranked in the top 10 just once from 1983 to 1994 (a first-place finish in ’87); in ANY/A, Elway’s only top ten finishes during his first ten seasons were in ’86 (10th) and ’87 (4th).
  • Elway ranks fourth all-time in passing yards, but that’s because he ranks fourth in career pass attempts. While he led the NFL in passing yards in 1993, Elway only finished in the top five in passing yards four times in his career: 1985 (2nd), 1987 (4th), 1990 (5th), and 1995 (5th).
  • Elway ranked 2nd in passing touchdowns in 1993, the only time he finished in the top 5 in that metric from 1983 to 1995. Despite throwing the fourth most pass attempts in NFL history, he ranks only 7th in passing touchdowns. In eight of sixteen seasons, including seven of his first ten years, Elway produced a below-average touchdown rate.

Here’s another interesting stat: from 1983 to 1992, the Broncos were slightly better on defense than offense. Over that time period, Denver’s Offensive SRS average was +1.01 while their Defensive SRS was +1.32. On average, the Broncos ranked 12th in points scored and 11th in points allowed. Those Denver teams are remembered as Elway’s teams — and perhaps rightly so — but the defense was just as valuable as the offense. [1]On the other hand, it’s worth pointing out that the ’83-’92 Broncos won more games than their Pythagorean record would have predicted, so perhaps Elway was responsible for more wins … Continue reading
[continue reading…]

References

References
1 On the other hand, it’s worth pointing out that the ’83-’92 Broncos won more games than their Pythagorean record would have predicted, so perhaps Elway was responsible for more wins than his passing numbers would indicate.
{ 99 comments }