
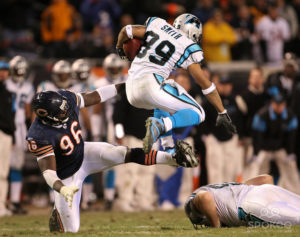
Smith nearly drops the chip on his shoulder
1) Calculate each player’s Adjusted Catch Yards in a game. In a 1974 playoff loss to Pittsburgh, Oakland wide receiver Cliff Branch had a great game. He caught 9 passes for 186 yards and 1 touchdown; giving him 5 yards for every reception and 20 yards for every touchdown, that translates to 251 Adjusted Catch Yards.
In 2012, Calvin Johnson dominated the Saints defenses in the lone playoff game of his career; Johnson finished with a 12/211/2 stat line, worth 311 ACY, tied (with Reggie Wayne against Denver) for the third most ACY in a playoff game since 1960.
2) But we need to account for era, and we should also account for the quality of the opposition. So I looked at every team since 1960, and calculated the ACY allowed to all opposing players in every regular season game. Then, I took the top 16 (or fewer, in non-16 game seasons) performances during the regular season to calculate the average ACY allowed by each defense to the top opposing receiver.
This is a very, very high baseline, of course, but I am trying to measure dominance. If a team allows 80 yards, on average, to the opposing WR1, then an 80-yard playoff performance shouldn’t stand out as special.
The 2011 Saints allowed an average of 155 ACY to the top 16 players it faced that year. As a result, Johnson gets credit for 156 ACY over expectation. The 1974 Steelers? Well, they allowed just 94 ACY to the top 14 players it faced during the regular season. That gives Branch 157 ACY over expectation.
So Branch slightly beats Megatron using this formula, as gaining 251 ACY against a defense that usually allows 94 is seen as a hair better than gaining 311 against a defense that usually allows 156. Is this formula perfect? Of course not, but it’s a start. Branch’s game checks in as the 8th best since 1960, while Johnson’s is 10th. The top game? That honor belongs to Steve Smith, naturally.
The table below should be pretty easy to read, but let’s use the Ricky Sanders as an example. Sanders has the 4th best game since 1960, and he it came when he played for Washington against Denver in 1987. You can click the ‘Boxscore’ cell to see the Boxscore, and this game occurred in the Super Bowl. Sanders had a 9/193/2 stat line, for a whopping 278 ACY. Denver’s “average rating” was 108 ACY, so Sanders was at +170 that day.
- After Sanders’ great game — that earned him a shout out from the president — the top three Super Bowl games all belong to Jerry Rice, including in the two years following Sanders’ game. The 5th best Super Bowl performance? That came from Bengals tight end Dan Ross, in a remarkable performance that has been forgotten. He caught 11 of 13 targets for 104 yards and 2 touchdowns, while playing an ’81 49ers defense that ranked in the top 3 in points, yards, yards per attempt, and passing yards.
- Both of Lynn Swann’s games against the Cowboys in the Super Bowl crack the top 100, although neither make the top 50. That would change quite a bit, of course, if we gave more weight to Super Bowl performances. Should we?
- In case you were wondering, as I was, Don Maynard’s game against the Raiders in the 1968 AFL Championship — 6/118/2 — checked in at 201 on the list. That’s because the “expectation” against the Raiders was a whopping 154 ACY, making the ’68 Raiders similar to the ’11 Saints. Does that make any sense?
The 2011 Saints ranked 30th in passing yards allowed; the ’68 Raiders ranked 4th. New Orleans allowed 260 passing yards per game, while the Raiders allowed just 161. So what gives? Well, this comes back to the distribution of things.
In 14 games, the Raiders allowed 6 100-yard games, and 6 more games of at least 80 receiving yards. If you sort from top to bottom, the average of the 14 players with the most receiving yards against the Raiders in 1968 was 113 yards. The Saints allowed 8 100-yard games, and 13 games of 80+ yards, which is pretty comparable over 16 games. And the ’68 Raiders had two games worse than the ’11 Saints. As a result, the ’11 Saints allowed “only” 107 receiving yards, on average, in their worst 16 games. Using ACY instead of receiving yards make New Orleans slightly worse, but the real issue is that distributions were much narrower in the late ’60s than they are today, which offsets the crazy pass numbers we see today.
I’m not sure what the “right” way to adjust for era is when dealing with wide receivers, so I’ll open this one up to the comments. I don’t love this formula, but I do think it does a decent enough job of isolating the best games that I like it enough for our purposes. Any tweaks, of course, would be welcome (including whether we should adjust for pass attempts).