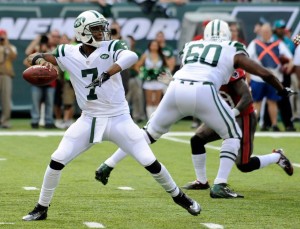
The real question is whether any of that matters. In general, I’m a Splits Happen type of analyst, but I thought I would run some numbers. As it turns out, perhaps there is some reason to think Smith’s strong December (subject to the caveats below) is a sign of good things to come. Here’s what I did:
From 1990 to 2013, there were 51 quarterbacks who threw at least 224 passes during their rookie season. Toss out the 2013 rookies (EJ Manuel, Smith, and Mike Glennon), along with the nine quarterbacks who threw fewer than 100 passes in year two (Jimmy Clausen, Ryan Leaf, Kyle Orton, Chad Hutchinson, Andrew Walter, Bruce Gradkowski, Chris Weinke, Ken Dorsey, and Matt Stafford), and that leaves us with 39 quarterbacks who threw at least 224 passes as a rookie since 1990 and then at least 100 passes in their second season. For those quarterbacks, I calculated their Y/A and AY/A averages over their final 4 games of the season, and their Y/A and AY/A averages over the first 1-12 games of the season (with the 224 pass attempts minimum, I felt pretty confident that we would have a large enough sample on the “early” portion of the season). Then I looked at how those 39 quarterbacks fared in their second years.
The table below shows all 39 quarterbacks, plus the 2013 rookies. Here’s how to read the table below. Heath Shuler, a rookie for Washington in 1994, had 150 “early” season attempts, defined as all pass attempts before the final 4 games of the season. His early year Y/A average was 5.0 and his AY/A average was 2.8. Shuler had 115 “late” season attempts, defined as pass attempts in the final four games. His Y/A in the late part of the season was 7.9, and his AY/A was 7.8. As a result, Shuler improved his Y/A by 3.0 and his AY/A by 5.0 over the final four games of the season. In Year N+1 — i.e., 1995 for Shuler — he had 125 pass attempts, and averaged 6.0 Y/A and 3.9 AY/A.
So more than any other quarterback, Shuler showed the largest improvement in AY/A down the stretch of his rookie season. That’s not a positive sign for Smith, of course, since Shuler was, well, Shuler. But if you look at the top ten biggest improvers in AY/A (excluding Smith), they averaged 5.0 AY/A during the early part of their rookie years and then 7.9 AY/A during the home stretch. Then, in year two, they averaged 7.1 AY/A (after averaging, as a group, 6.0 AY/A as rookies). Nick Foles was a big reason for the group’s average improvement, so to the extent you believe that Foles’ breakout 2013 season wasn’t connected to his relatively strong finish in 2012, the data would be misleading. But all of the ten quarterbacks who made big jumps down the stretch in AY/A showed improvement in Year N+1 relative to their early-season numbers as rookies.
What about the quarterbacks who slumped down the stretch — and Glennon, at least statistically, would be one of the — how do they fare in year two? The eight [1]Why eight and not ten? Because that’s the more appropriate cutoff based on the data. quarterbacks (excluding Glennon) with the biggest dropoff in late-season AY/A averaged 5.8 AY/A in the “early” part of the season, 4.2 in the “late” part of the season, and then only 5.6 as sophomores.
We’re dealing with pretty small sample sizes here, but that’s just life when crunching numbers on NFL quarterbacks. It’s also worth keeping in mind that quarterbacks on average, fare better in year two than in his rookie year (even though many media members like to write articles about “sophomore slumps” for quarterbacks). But the 10 quarterbacks that were “fast finishers” as rookies averaged 6.0 AY/A over the full season and then 7.1 AY/A in year two; the quarterbacks who “hit the rookie wall” and struggled in the final quarter of the year averaged 5.3 AY/A as rookies over the full season and then only 5.6 AY/A as sophomores. The middle group was at 5.9 as rookies and then 6.1 as second-year passers. So there is certainly some evidence to indicate that a strong December is a good sign for a rookie quarterback and not just a “splits happen” type of event.
For Smith, the way quarterbacks like Foles, Manning, Bledsoe, Garcia, and Palmer finished their rookie years is a promising sign; however, I admit to still being a bit skeptical. In Smith’s case, his “early season” numbers are dragged down by a horrible November, not necessarily by a bad start to the season. Smith didn’t show steady progress throughout the year, he was just inconsistent and finished well; that would lend more credibility to the “splits happen” theory than Smith “figuring out the game as the season moved on.”
The better argument, in my opinion, for Smith’s future success is beyond the numbers. He played with perhaps the worst set of skill position talent in the NFL last year. According to Pro Football Focus, Stephen Hill led the team with 350 snaps on pass plays, followed by Jeremy Kerley (338), David Nelson (305), Santonio Holmes (304), Bilal Powell (280), Jeff Cumberland (261), Kellen Winslow (219), and Tommy Bohanon (118). Evaluating a rookie quarterback with those weapons is pretty challenging (especially when you remember that the “name players” in Hill and Holmes were close to useless when they were on the field). Smith finished 2nd to last (ahead of only Matt Schaub) in AY/A as a rookie season, but the Jets should add at least two wide receivers and a tight end through draft and free agency. That, more than a good December of not turning the ball over, is the most likely path to Smith becoming a viable NFL starter.
References
| ↑1 | Why eight and not ten? Because that’s the more appropriate cutoff based on the data. |
|---|

